Foreground contributions to the Cosmic Microwave Background
Abstract
A detailed search has been made for evidence of residual foreground contributions to the Cosmic Microwave Background (CMB) WMAP (Bennett et al., 2003a, b), a map (nominally) cleaned for foreground already (Tegmark et al., 2003). We find positive results in that various features relate to Galactic properties. For example, on the largest angular scales we find significant differences between the power in the fluctuations for positive and negative Galactic latitudes and between the four Galactic Quadrants. There are also differences between the power spectrum at latitudes within 10∘ of the Plane and at higher latitudes. The mean temperature shows similar variations. An explanation in terms of Galactic effects seems inescapable.
In an effort to find the origin of these Galactic-style effects we have examined the evidence from Galactic gamma rays, specifically from the EGRET instrument (Hunter et al., 1997). We are mindful that the CMB maps examined (Tegmark et al., 2003) have already been ‘cleaned’ (for cosmic ray and other effects) in a rather complex way but, in our view, the cleaning has left potentially serious ’contaminations’. A correlation is found between gamma ray intensities and the CMB and other cosmic ray indicators. For example, regions of the Galaxy having (line of sight) steep cosmic ray energy spectra have low mean CMB temperatures and the important Loop I edge region, where the cosmic ray intensity is high, has a high mean temperature.
Most of the large scale Galactic asymmetries (eg North, South difference and Quadrant variations) have analogues in cosmic ray asymmetries and also in some other Galactic properties, such as the column density of gas. Thus, it is possible to hypothesize on direct cosmic ray-induced contributions, although it may be that cosmic rays are simply the indicators of Galactic ‘conditions’ which are influencing the residual CMB fluctuations.
Irrespective of the actual cause of the correlations we have endeavoured to extrapolate to the situation where the residual foreground is minimised. The effect on the usually derived cosmological properties is briefly examined. The least that can be said is that the ’error’ in some of these properties has been underestimated.
keywords:
cosmic microwave background – cosmic rays.1 Introduction
It is well known that although the Galactic foreground to the CMB measurements should be small, it is not zero. Some 15 years ago we (Banday & Wolfendale, 1990; Banday & Wolfendale., 1991) drew attention to the fact that, despite the contribution to the ‘CMB’ spectrum from electron bremsstrahlung falling rapidly with frequency, the contribution from dust rises rapidly and there is a frequency region – from 30 - 100 GHz - where their sum has nearly the same 2.7K spectrum. The derived value of was about , ie is about 7K. The angular scale was 8∘ relating to the Tenerife experiment (, 1988) (beam width 8.8∘ FWHM and the beam throw 8.2∘), and the value related to a ‘quiet’ region of the Galaxy, ’quiet’ in the sense of having low radio and dust signals. The corresponding value for was close to this value. It was claimed, further, that the minimum foreground (synchrotron plus dust) would be at a frequency of 70 GHz for the ’DC signal’, ie the absolute intensity as distinct from the fluctuations in the foreground temperature.An important parameter is the degree of flatness of the foreground temperature vs frequency. Taking a straight line between 20 and 90 GHz as datum, the maximum downward deviation was a factor 3.0. Actual measurements (De Oliveira-Costa, et al., 2004) now enable the DC level to be determined. WMAP data at the five frequencies (22.8 to 93.5 GHz) do indeed show a minimum signal at about 60 GHz and the form of the dependence of temperature on frequency is even flatter, the factor being only 2.0. The absolute temperature level is somewhat higher, even, than ’our’ early prediction.
Taking our predicted temperature fluctuations, as distinct from the DC level, at for the minimum, the average over much of the Galaxy, but away from the Galactic Plane, would be of order 20. Inspection of the power spectrum for the WMAP (Bennett et al., 2003b) shows that for 8∘ () the average power is . ’Our’ 400 is therefore a significant fraction. There is thus a prima facie case for a serious contribution.
Correction of the WMAP for the Galactic foreground has been made by the WMAP group (Bennett et al., 2003c) who have carried out a procedure to generate, not a published map but a power spectrum. Many workers have used this power spectrum to derive important cosmological parameters. Here we will use a cleaned map (Tegmark et al., 2003) the cleaning of which was carried out by a more sophisticated technique, specifically the individual frequency sets of data were weighted not just according to frequency (as in Bennett et al. (2003c)) but also by harmonic () in the power spectrum analysis.
An important point to be mentioned at this stage is the fact that the well-known cosmic ray (electron synchrotron) contribution to the foreground at low frequencies is correlated with that of dust at the highest frequencies. This is a consequence of the well-known strong correlation between the synchrotron and far infra-red radiation emission of galaxies, commented on by many workers over the years, including ourselves eg (Chi & Wolfendale., 1990). Although there can be no certainty about the mechanism, a possibility relates to CR-heating of the very cold dust clouds in the Galactic Halo. In this respect we are mindful of the comment (Burton & Deul, 1987) that ”… between a few and about 30 , the (neutral) gas is almost entirely in the form of molecular hydrogen, residing in dense clumps…”. Interestingly, confining attention to cold clumps, their contribution could well fall off with Galactic latitude more slowly than cosec , because many of the low clouds would be warmed by Galactic Plane radiation and not recorded in the CMB map. In fact, the -dependence may not be at all simple.
Before continuing it is instructive to examine the various energy densities. The CMB radiation has an energy density of 0.24 eV cm-3 and is universal; that in cosmic rays is eV cm-3, and, as is well known, this is the same as that in interstellar magnetic fields, gas motion and starlight – all in the local region of the Galaxy. The fluctuations in the CMB correspond to about (1-10) eV cm-3 – on various angular scales – and a fraction of the CR energy density (or of one of the other components of similar energy density) of order 10-6 going into pseudo-CMB signals would not appear impossible. In view of the importance of the CR ‘background’ in other searches, eg for cosmic neutrinos, dark matter particles, magnetic monopoles, it would perhaps be surprising if CR effects were absent.
How much of the CR foreground has in fact been taken out by the ‘cleaning’ is open to question but we presume that most of the contribution has been removed and that the residual will vary slowly with Galactic latitude. Insofar as the synchrotron radiation has a pronounced asymmetry about the Galactic Plane, with a North/South (N/S) ratio less than unity (Bennett et al., 2003c; Burton & Deul, 1987) – and all the WMAP frequencies show this effect before correction (Bennett et al., 2003c) we will search for such an asymmetry in the cleaned map; such an asymmetry is also present in other Galactic phenomena, as will be demonstrated later. Similarly, in view of all Galactic phenomena being dependent on the Galactic Quadrant concerned, Quadrant variations will also be searched for.
Our work is not the first to claim asymmetries in the cleaned WMAP. Although the WMAP group (Bennett et al., 2003b, c) claimed that there is no evidence for non-Gaussian primordial fluctuations in the WMAP, and they quote many other workers who have come to the same conclusion, other recent studies (Hansen et al., 2004), have shown that ’strong non-Gaussian features emerge when considering the Northern and Southern Galactic hemispheres separately’. Others still (Ericksen, et al., 2004a; Eriksen et al., 2004b) had, previously, found asymmetries in the distribution of the CMB fluctuations in the two hemispheres. Thus, the present work is another contribution to the debate on asymmetries in general, but with an independent approach.
The cosmic ray aspect is, so far as we know, truly original.
Some remarks are necessary first about the adopted map used throughout the analysis. This is the ’high resolution foreground- cleaned CMB map from WMAP’ given by Tegmark et al. (2003). Although the WMAP group itself has analysed the basic data from the WMAP instrument in great detail, and derived best-fit results for the various cosmological parameters (Bennett et al., 2003a, b), it has not given the necessary cleaned-map data. Furthermore, its treatment of the five WMAP frequency maps to allow for foreground appears to us to be rudimentary in that -independent statistical weights were applied before the data were combined. In the map adopted by us, (Tegmark et al., 2003), -dependent weights were used and, although we contend that significant foreground remains, the data should be better.
We estimate that the resolution of the adopted data is about 12’ and that, although the minimum in the power spectrum at is enhanced somewhat, the effect on the ’one-degree-peak’ should be small. The authors state that the Galactic residuals seen along the Galactic Plane ’are present in only a tiny fraction of the total sky area and therefore contribute little to the total power spectrum’.
2 Large scale asymmetries
2.1 The Parameters Under Study
The CMB sky is characterized by the temperatures of individual pixels and these can be studied in a variety of ways, as follows:
-
i)
The search for discrete excesses and deficits. For sizes of the order of a few pixels most will relate to extragalactic systems such as active galactic nuclei. We have identified several AGN and the VIRGO, PEGASUS 1 and PISCES clusters.In general, we find six times as many excesses as we find from searches in ’artificial universes’, taken from the conventional CMB power spectrum. Turning to deficits (eg Sunyaev-Zeldovich reductions in galaxy clusters) we find twice as many in the genuine map as in artificial universes. The significance of the above is two fold; our technique of analysis receives a measure of support; the integrated magnitude of their contributions is small - and only affects the results at the highest of values.
-
ii)
An analysis of the power spectrum formed from the basic data. The standard technique is usually adopted to give , where is the multipole and is the angular power spectrum average derived by averaging the sum of the squares of the terms in the spherical harmonic. The expression gives the power per logarithmic intervals of and inspection of the form of , eg (Bennett et al., 2003b, c; Tegmark et al., 2003), shows that much of the power is at large , specifically in the region of the ’one-degree peak’. We expect the Galactic foreground effects to be on the scales of rather small (perhaps ) as distinct from the related to the ’one-degree peak’ but all scales are, in principle, possible. Here, we usually study the -dependence of parameters but, where undue complexity would arise, we give results for just and .
-
iii)
Averaging the sky over large regions gives the mean CMB temperature,. By definition, over the whole sky this will be zero, but for restricted regions the value will be finite, and its study can be useful. Inspection of the distribution for individual pixels shows a median excess of 80 (of those which are possible) with 10% having . The 80 level in the standard WMAP maps is the ’green level’, with many regions having angular size of order several tens of degrees.
From what has been stated it is apparent that it will be valuable to look at features in the map from both the power – and the mean temperature – points of view.
2.2 North-South Asymmetry
For all Galactic radiations there is a major symmetry, with respect to latitude, together with a N-S asymmetry (details of which are given later). The former usually predominates but the effect of the map cleaning would be expected to remove most of this; the result is that the symmetry and asymmetry may be of not too dissimilar magnitude. A near cosec dependence (but bearing in mind previous remarks) might be expected; in fact, any disk-like emission (or absorption) would be expected to give such a -dependence, assuming near constant emissivity per unit volume over the Galactic disc. It should be remarked that the original WMAP results for the individual frequencies (Bennett et al., 2003c), show a pronounced cosec dependence over the range for which data are given: cosec = 1 to 4, the slope of which is systematically higher in the South than the North (there are also subtleties in the results to which we will refer later). Thus, there are both symmetries and asymmetries. A basic question is ”to what extent has the cosec dependence, and with it the largest scale Galactic foreground, been taken out in the ’cleaning-process’?”
The fact that the cosec dependence, and N-S asymmetry in the basic WMAP data, are independent of frequency is an important result in that it suggests the fact mentioned in Sect. 1 that there may be a spatial connection between the ’low’ frequency emission (22 GHz), which is related to cosmic ray electrons, and the ’high’ frequency emission (93 GHz), which is affected by Galactic dust. This was the logic behind adding the foreground values from these two mechanisms in our earlier work. (Banday & Wolfendale, 1990; Banday & Wolfendale., 1991). We start by comparing the power spectra for the N & S for the same latitude bands. We are mindful of the ’cosmic variance’ which pervades the interpretation of all the WMAP data, but particularly at low values of . Figure 1 shows the situation. The smooth curves through the points for the North have been given in the graph for the South, for illustration purposed only. Interpretation needs to allow for the non-independence of nearby -values for a particular set of data; we estimate that this dependence exists over a range in of a factor 2.
Furthermore, there is the diminishing effect on the South/North ratio at small and low ; for example, at () the ratio should fall at where the innermost -values are separated by less than 20∘. It does; from 3.1 at to 1.3 for .
The most important plot is that of the South/North ratio vs . Figure 1c shows the result summed over all latitudes; also shown is the mean spread for cosmic variance alone. It is interesting to note that the S-excess persists over virtually the whole range of . Formally, it is most significant at the largest -values, a surprising result. The statistical significance of the excess is not easy to estimate but, allowing for the dependence of nearby values (within a factor of 2), it is at the 1% level.
Turning to the -dependence of the S-N ratio, the significance is far less than might be expected from the large excesses seen in Figure 1d, because of the small solid angles for the individual -ranges. Furthermore, the excesses are greatest at low where lack of independence of adjacent bins, for small , are most serious, as remarked already. However, the consequent errors are not large; inspection of Figures 1c and 1d shows that the weighted (by solid angle) ratios from Figure 1a are 3.14 (=5) and 2.1(=10), to be compared with 2.7 and 1.7 respectively. The ’error’ is thus only about 20%.
Restricting attention to and , the dependence is less serious and something useful can be said Allowing for the reduced solid angles, the excesses are in the region of the ’upper limit’ to the variance for , a region having 70% of the solid angle. The corresponding significance of the southern excess, after allowing for the fact that the measured ratio rises at a faster rate than the upper limit expected by chance, gives a formal chance probability of 3%, this value relating to the low -values (much of the weight for the previous 1% came from higher -values).
The results on the N/S ratio suggest that there is a finite Galactic foreground, affecting both low (all ) - and, indeed, perhaps all . In the next section we continue to study the evidence for foreground effects by examining the data Quadrant by Quadrant (Quadrant 1 covers the range to 90∘; Quadrant 2, the range 90, and so on. Quadrants 1 and 4 comprise the Inner Galaxy and Quadrants 2 and 3 the Outer Galaxy).
2.3 Quadrant-dependent effects
There are well-known differences in all Galactic properties, Quadrant to Quadrant. Near the Galactic Plane, at least, the Inner Galaxy has higher intensities of every radiation than the Outer Galaxy. We start with the power spectrum.
Figure 2a shows the mean power vs for each Quadrant for latitudes below 10∘ and Figure 2b shows results for latitudes above 10∘. There is little doubt that the two regions differ. Figures 2c and 2d show ratios with respect to Quadrant 1.
It is evident that a case can be made for there being big variations in power, Quadrant to Quadrant, particularly at small and for these persist to high -values.
Considering, first, , and , the variance expected has an upper limit , so that Q3/Q1 and Q4/Q1 are on this limit. Q2/Q1 is below it. The overall chance probability for is 10%. At higher , where the variance is smaller, there is an interesting and significant difference between the Inner Galaxy (Q1 & Q4) and the Outer (Q2 and Q3), the power in the Inner is decidedly higher. Inner versus Outer is different - for - at about the 1% level.
Turning to , the solid angle is bigger (83% of the whole) but the excess is smaller. Interestingly, the significance of ’the effect’ is similar, at least for Q1, Q2 and Q3 with respect to Q1, in the region of . At higher , the significance drops, although above , the ratios for Q3 and Q4 are formally significantly above unity.
In terms of the absolute magnitudes, Figures 2e and 2f show comparisons between the power as a function of for the two Inner and Outer Galaxy Quadrants and that for the standard CMB model (Bennett et al., 2003b), divided by 4 (ie each for one quarter of the solid angle).
Some remarks are necessary about these two Figures. Firstly, considering the small ’wiggles’, these are not significant. Secondly, the difference between Inner Galaxy (exemplified by Q1) and Outer Galaxy (Q3) is seen. Thirdly, the sum of the powers for each Quadrant is nearer conventional expectation for Q1 than Q3, a result due to the larger contribution from .
Further analysis comes from an examination of the overall mean CMB temperature (as distinct from the power, ) as a function of latitude. Figure 3 shows the results. Inspection of the figure shows a number of features
-
i)
There are marked differences Quadrant to Quadrant in mean temperature. Quantification of a lower limit to the significance of the variations can be made by assuming that the variations within one Quadrant from one latitude band to another are representative of the errors and deriving the mean displacement from zero. Considering , where successive latitude bands are sufficiently independent, we find, taking the 8 ’regions’ (4 Quadrants, N and S); 4 cases between 0 and 1 standard deviation, 3 between 1 and 2 and one as high as 5 standard deviations. There is thus evidence for significant excursions from zero.
In the Galactic Plane itself () there is a clear excess temperature. The average is 27 and, if it is valid to determine the error from the dispersion of the four sets of data this discrepancy from zero is at the 4 standard deviation level. Using the mean error for the other 8 sets of data at (and five values for each set) the significance rises to nearly 6 standard deviations. The excess is far bigger than one would have expected from the remarks about cleaning in Tegmark et al. (2003).
Equally important are the symmetries, as follows:
-
ii)
Figures 3a and 3b show clear symmetries in the dependence for the two Quadrants in the Inner Galaxy (Q1 and Q4) and those in the Outer Galaxy (Q2 and Q3). Turning to data for the N and S separately Figures 3(c) and (d), in Quadrants 1 and 2 there is fair symmetry between N and S. In Quadrants 3 and 4 there is some symmetry (but less than for Quadrants 1 and 2) for (it is relevant to point out that the giant ’hole’ in the CMB, at to 360∘, to , is responsible for the very low mean temperature in Quadrant 4 for : to . The symmetry can be quantified by comparing the separation of the two values, at each , with times the modules of the distribution of the individual values about zero. The result for the ratio of the median values, (equivalent to a number of standard deviations) is, for Q1, Q2, Q3 and Q4; 2.1, 2.1, 1.4 and 1.1. The symmetry is seen to be reasonably significant for Q1 and Q2. Taken overall, N-S symmetry is present at the 2.4 sigma level.
-
iii)
There is no systematic excess temperature in the South as there is in the power spectrum at low (Figure 2), at least averaged over all (but see later).
-
iv)
In the Outer Galaxy (Quadrant 2 and 3) there is some evidence for a minimum in the range , ie a symmetrical feature.
-
v)
In the Inner Galaxy (Quadrants 1 and 4) there is a dip in the range 2 in all four cases, again a symmetrical feature.
-
vi)
In every case the mean temperature for is higher than that for and higher than that averaged over the range.
-
vii)
There is a fall in with increasing over the range , after which there is an increase.
- viii)
The conclusions to be drawn at this stage from the results on are:
-
i)
There is a clear excess at averaged over all Quadrants and thus there is certainly some foreground left in this range.
-
ii)
Whilst there are clear Galactic features these are not of simple cosec form over the whole range of ; nevertheless there is a reduction of temperature from to , the region with most of the solid angle of the sky.
-
iii)
There are interesting symmetries about the Galactic Plane.
Comparison with the other results on ’Gaussianity’, etc will be made later.
The results of the mean temperature are not necessarily inconsistent with those for the power spectrum (Figure 2) because the mean temperature relates to a form of integral over all -values, whereas the power spectrum refers to the square of the temperature and is, of course, -dependent. This aspect can best be studied by examining plots similar to Figure 3 for the power (per unit solid angle) for different -values. We remember that the power spectrum represents the power per unit logarithmic interval in .
Figure 4 shows the results for two values of , and . The main feature here of relevance to symmetry are:
-
i)
Again, there is an excess nearest the Galactic Plane - in this case for . The significance has been examined as for mean temperature, deriving the mean value for the other latitudes, and its error, and finding the difference between the value for and this mean. There are 8 sets of data and the result is that for the average difference is 2.2 standard deviations - ie over 5 standard deviations overall. For =100, the significance is even bigger, amounting to 10 standard deviations. For , where the interdependence of different -bands is least, there is a strong difference between Inner and Outer Galaxy. In the range , the excess in the Inner Galaxy is 2.6 times that in the Outer. The significance is 3.2 standard deviations. For the excess changes to a deficit. The ratio is , ie 5.6 standard deviations from unity. There is clearly no evidence for a constancy of power.
-
ii)
In every one of the 16 cases (for both -values) the power in the is lower than would be expected on the basis of the adjacent points; thus a Galactic symmetry.
-
iii)
For =10, in three out of four Quadrants there is a slow fall of power with increasing latitude beyond . A plot of vs cosec in this range yields a slope of for . The mean S/N ratio in this region can be derived from Figure 1d. It is 1.3 (the square root of the derived value, which related to ), to be compared with , for all longitudes at , (Figure 1c). An important result is that the mean slope for the South is greater than that for the North, although this result comes mainly from Quadrant 4. None of the features described above would be expected for ’cosmic variance’.
-
iv)
At , the effects are too small, in comparison with the errors, for a pattern to be discerned with respect to dependence and N-S ratio.
The conclusions here are that, again, there is residual foreground near the Galactic Plane, the range appears to have been overcorrected and that, at low , there is an all-latitude foreground. Furthermore, there is evidence for a cosec dependence of the root mean square power (at the 2 level).
Turning to the N-S asymmetry, we note that the S/N ratio for power, is, for =10, and increasing : 2.11, 2.49, 1.79, 1.85, 2.25 and 0.95. leaving out the (anomalous) Quadrant 4, the S/N ratios are: 2.39, 2.69, 1.53, 2.83, 1.50 and 0.72.
The S/N ratio therefore dips towards unity at in the second case. Inspection of the 408 MHz results (Bennett et al., 2003c), shows that there is a reduction in ratio starting at reaching a minimum at . The individual frequency bands for WMAP (uncleaned) show a ratio of 1.37(+0.13-0.04) at =30∘ (and little variation at lower ), 1.21 () at = 40∘ and 1.06 (+0.04-0.02)at =60∘, the limits encompassing the whole range of frequencies. It is interesting to note that there is no systematic change to the S/N ratio with frequency; but both in the 408 MHz and the individual WMAP frequencies there is a reduction in ratio at mid-latitudes; 40∘ at 408 MHz and 40∘ in the individual WMAP frequency -values, to be compared with 45∘ - 60∘ in the = 10 WMAP power. Once again, then, there is evidence of insufficient cleaning.
An important aspect is a comparison of the two Quadrants in the outer Galaxy, Q2 and Q3 in both and power; we would expect greater activity in Q2 in comparison with Q3 because of the greater number of SNR, HII regions, etc there.
Inspection of Figure 3 shows that the temperature in Q2 is higher than that in Q3 for every latitude bin, except for the (anomalous) region and the previous bin. The excess (Q2-Q3) in is successively, for , , , : +17, +12, -7, -5, 7, 3, 3 and 19 . An excess is thus well founded. Insofar as much of comes from high -values (and thus small angular sizes), there should be little cross-talk between the two Quadrants.
Surprisingly, perhaps, the same feature (Q2Q3) does not pertain for the power per steradian (Figure 4). For , only for the highest latitudes () is Q2Q3 – and here we would expect the nearest approach to equality. For the ratio for Q2/Q3 is 0.56, for it is 0.43 and the average for is 0.69. At , a similar situation pertains: for , Q2/Q, for , Q2/Q and for Q2/Q. Again, in all latitude bins, Q2/Q31 with the exception of where Q2/Q.
Thus, there is a clear difference in the power per steradian for Q2 and Q3 and one that is systematic over all latitudes (see Figure 2). At first sight it is of the opposite sense to that expected but the answer may lie in the fact that the radial gradient of the CR intensity is (surprisingly) smaller for Q3 in comparison with that for Q2 (Erlykin et al., 1996).
Turning to the S/N ratios for Q2 and Q3, overall (over all ) these are: Q2, 1.63 (1.04); Q3, 1.79 (1.09). The first value related to and the second to .
The corresponding values for are: 1.69 (0.96) and 1.72 (1.02). The ratio is thus rather stable with respect to the limit on . A different situation pertains for , where the differences (S-N) are, for Q2, () and for Q3 () the first value is for and that in brackets is for . The fact that a S-excess is present for in both power and is reassuring, as is the similar magnitude for both Quadrants.
2.4 Comparison with the original WMAP and 408 MHz data
A further aspect of the 408 MHz data is the presence of ’fine structure’ in the cosec -plots’ and also in the separate plots of vs cosec . In every one of the six plots (, 1988) there are consistent features, in order of diminishing magnitude:
-
-
Minima near cosec = 2.0 (ie )
-
-
Minima at cosec = 3.15 ()
-
-
Minima at cosec = 1.15 (), all for the North.
For the South there are:
-
-
Minima at cosec = 1.15 ()
And, for the five WMAP frequencies alone, there are:
-
-
minima at cosec = 2.15.
In the North alone at the smallest angle (cosec , ie ) there is an excess over the ’best straight line’ growing systematically with frequency, reaching 17% at 93 GHz. There is no equivalent in the South.
Such fine structure, even when the data are integrated over all longitudes, lead us to believe that significant variations, correlated in frequency, undoubtedly exist for smaller longitude bins - as we claim. It is very doubtful if such effects would be subtracted out in the WMAP cleaning procedure (Bennett et al., 2003c; , 2003) - in which the weights vary considerably from one frequency to another. (They are, in order of increasing frequency, GHz, , , , and ). Furthermore, the weights are the same for N and S, whereas the dependence of slope of vs cosec is different for N and S. Specifically, the slopes are, for GHz: , 1.47, 1.67, 1.61 and 1.50. That for 408 MHz is lower: 1.10 although, because the dependence of T on cosec is less linear, there is an appreciable error.
2.5 The Situation at High Latitudes
It is instructive to examine the situation beyond in some detail because this region had been expected to be far enough from the Galactic Plane to be completely free of foreground (Bennett et al., 2003b).
Other work (Hansen et al., 2004) , mentioned already, has suggested that the axis of symmetry of a large scale modulation of the CMB signal is in fact, not along the Galactic N-S axis but nearer the axis through the Ecliptic Poles. These results will be discussed later in (Wibig & Wolfendale, 2005); here, we examine this aspect from a different standpoint. Ideally, with a large foreground contribution, we might expect the ’N-S axis’ to be defined by the lowest signals in the N and S hemispheres. However, even in the case of conventional Galactic radiation signatures (eg 21 cm line of the HI column density, synchrotron radiation, etc) the minima are away from the Galactic Poles. Furthermore, as we have noted, some of our CMB parameters increase with latitude above = 45∘. Thus, we determine the directions of both minima and maxima for each hemisphere. The parameters studied comprise those from the CMB analysis already given, viz , W(=10) and the correlation coefficient for CMB temperature with respect to the CR intensity (to be described). In addition, we include directions for low (and high) spectral exponents for CR protons and electrons (Fathoohi et al., 1985a, b), making 5 parameters in all. With the exception of p and e, the directions are imprecise in that they are derived from the Quadrant - wide regions and ranges and ; poor statistics preclude a more precise study.
The results for the range of and , and the mean values, are as follows.
Maxima
-
N:
-range: 120∘, mean :90∘
-range: , mean : +50∘
-
S:
-range: 90∘, mean :230∘ 25∘
-range: 15∘, mean : -50∘ 5∘
Minima
-
N:
-range: 180∘, mean : 200 ∘ 50∘
-range: 20∘, mean :
-
S:
-range: , mean :
-range: , mean :
Inspection of the values shows that indeed the means of both maximum and minimum values do not centre on .
The analysis is such that a uniform (ie random) set of directions would have a range of - 360∘ and a mean with an error in of 90∘, ie bigger than observed.
The result is that the directions are consistent with conformity as expected if foreground effects are significant at the high latitudes - to the extent of about 2-3 sigma in the North and somewhat greater in the South. The small errors for the -values are perhaps illusory because of the small overall range of considered: ’ (from the centre of one bin to the centre of the other).
Interestingly, the South, with its higher power, Figure 1, is more significant. Comparison with the other result (Hansen et al., 2004) is given later.
At this stage, we can claim some support for the hypothesis that the foreground effects contribute to ’high’ latitudes although to use the statistical weights just referred to is unwise since we run the risk of double counting, having already used the e and p result and some aspects of - and power - variations.
2.6 Comparison with other studies of asymmetries in the cleaned maps
Mention has already been made of the ’Gaussianity’ differences. Work on comparing the statistic for each Galactic hemisphere (Ericksen, et al. (2004a) , b)has shown significant differences from expectation for the North but not for the South. The nearest we come to an effect of this sort is the variations from bin to bin in latitude of the power per sr at low (); Figure 4. In two of the Quadrants, 3 and 4, the variation is bigger in the North than in the South. The conclusion that there is ’an unexpected power asymmetry between the N and S hemispheres in the WMAP data’ is certainly supported by our work. The authors of the Gaussianity work referred to above have gone on to use both the power spectrum and N-point correlation functions to argue that the axis of maximum asymmetry is close to the ecliptic axis. A somewhat similar result has come from an analysis of ’the local curvature of WMAP data’ (Hansen et al., 2004) although here anomalies are found for both hemispheres, at least for smoothing and the maximum asymmetry is between the ecliptic axis and the Galactic Pole. Interestingly, it is demonstrated that for smoothing the Southern hemisphere yields results too close to the Gaussian expected values. Inspection of the map for ’lake counts’ (’lakes’ are regions where the differential of temperature vs position is changing from negative to positive) shows maximum fluctuations which correlate reasonably with the ’hot regions’ in Figure 3. In fact, inspection of the map presented in Hansen et al. (2004) shows that the centroids of the N and S hemisphere regions having unusually high fluctuation values are somewhat away from the celestial poles.
Specifically, they are at , :90∘, +50∘ and 270∘, -45∘.
These values are close to our estimates for the mean positions of the maxima
-
-
: , and
-
-
: , .
The near agreement can be regarded as a confirmatory check on our analysis - and thus an agreement - to some extent - with our contentions.
2.7 Power spectra for ’red’ and ’blue’ maps
Before moving to the possible ’cosmic-ray-connection’ it is necessary to refer to a feature that we have discovered which may have significance. We define points on the WMAP (Tegmark et al., 2003) having positive values as ’red’ and negative values as ’blue’. Power spectra have been derived for the whole sky for red maps and blue maps with the result shown in Figure 5a. Figure 5b shows the ratio. Figures 5c and 5d show the results for . It is evident that in both cases, and , there is a systematic difference in the shape of the power spectrum between observation and expectation.
Comparison with the ’limits’ for the artificial universes shows two main features:
-
i)
a clear excess of red over blue at the highest -values;
-
ii)
a less significant deficit for .
The former can immediately be attributed to the contribution from discrete sources. The significance of the important deficit at low needs discussion.
Insofar as the power levels at values exceeding are largely independent, there are two values (at and 10) in this vicinity which are in the region of the lower limit. If this limit corresponds to the one standard deviation level then the chance probability is 7%. The significance for cosmology of the difference at low will be considered later.
Of greater importance is the observation of the clear slow increase in ratio with increasing values of . This increase is due to increased ’foreground’ in terms of both Galactic and Extragalactic (’discrete’ sources) components. Inspection of artificial Universe results shows that the chance probability is less than about 3%. Taking low -values as a datum, and assuming that the total foreground affects only the red points, the result is that for the important one-degree peak the extra contribution is about 10%. Thus, from this argument, the power of the peak should be reduced by this amount.
3 Cosmic Ray – CMB correlations
3.1 General Remarks
As remarked earlier, the presence of a cosec variation in the mean CMB temperature at each and every WMAP temperature from 22.8 to 93.6 GHz, Bennett et al. (2003c) shows that there is a definite contribution to the uncleaned maps from Galactic – ’thin disk’– mechanisms. These are generally regarded as: electron synchrotron radiation, free-free radiation and dust.Insofar as the first mentioned is due to cosmic ray electrons and the dust is heated, in part at least, by CR protons, we expected ’cosmic rays’ in general to be implicated in the foreground problem. It is true that subtracting off a cosec dependence, and arranging that the mean CMB temperature is 2.74K, removes much of the CR-related signal but some inevitably remains. Presumably, the residuals remain on a variety of angular scales and a variety of magnitudes. Insofar as our knowledge of the distribution of cosmic ray intensity and gas density (of all densities, including that in dust clouds) – in 3-dimensions– is very limited, a determination of the likely CR-related contribution is very difficult. Some general points can be made, however, as follows:
-
i)
Lines of sight where the CR-intensity (of relevant energy) is low might be expected to have low foreground CMB (denoted CMB).
-
ii)
Lines of sight where the column density of gas is low (’Galactic chimneys’ and other regions) and thus low CR interaction should have low CMB.
- iii)
Each of these regions will be considered in turn, as will an all-sky correlation using the low energy gamma ray data from EGRET (Tegmark et al., 2003) and a more energetic component for .
3.2 Correlations in Steep CR-Spectra Regions
From the maps of electron and proton (Fathoohi et al., 1985a, b) spectral indices we have chosen regions covering about 10% of the sky area. The results for a smoothing of 15∘ FWHM were taken for both the proton and electron components in that we expect CR ’variations’ to be on this order of scale, corresponding to typical SNR-induced large scale turbulence. We expect the contours for protons and electrons to be similar, but not quite the same (differences of energies for the initiating particles, electrons and protons, will cause differences in diffusion coefficients). An estimate of the difference can be made, as follows. The mean electron energy is about 1 GeV for the electrons responsible for the detected gamma rays and about 10 GeV for the protons so that the proton and electron escaping from their accelerating SNR will be separated by of order 100 pc (, 2001) after a time of 106y (ten times the lifetime of the SNR). At a typical distance of 1 kpc the angular separation will be of order 6∘. The somewhat disparate patterns of Figure 5 are thus understandable.
In order to choose the most reliable regions of steep spectra - and because we are not sure which of electrons and protons are responsible - we have identified regions of common steep spectra for both protons and electrons in Figure 6 (see also (2001)); these should correspond to the most likely regions of maximum effect for the CMB. By ’maximum effect’, here, we mean lowest CMB temperature because steep spectra indicate low particle intensities at the higher energies where we expect the extra pseudo-CMB contribution to arise.
Table 1 indicates the regions so identified and the corresponding values of CMB It will be noted that all are negative. The significance of the deficits will be examined shortly.
3.3 Correlations for Galactic Chimneys
Returning to the presence of chimneys of low column density of HI, in which we have claimed steep spectra (and where we used limited latitude regions above), an analysis has been made of the mean CMB temperature along four major directions – lines of constant longitude (of width ) over their whole latitude range; these directions do not always coincide with those of steep spectra.
The mean temperature has been determined for , this being the nominal region over which the chimneys can be identified. The results are also given in Table 1.
It can be seen that our expected reduction in mean CMB temperature is observed in 6 or 7 out of the 8 regions.
These results are potentially important and they will be examined in more detail. In Wolfendale & Zhang (1994), where evidence was given for correlations of steep spectra for low energy gamma rays with the Galactic chimneys and low HI regions, a comparison was made between () and (). It was found that the results were better, those for negative latitudes being inferior, particularly for and . These results related to electrons. With higher energy gamma rays, however, where protons are the progenitors, at negative latitudes, was poor, but 130∘ was good. The conclusion is that the anomalous positive result for at can, perhaps, be understood, not least because inspection of Galaxy-wide HI column density maps shows that the ’chimney’ at negative and is barely visible.
3.4 Correlations for Other Low HI-Column Density Regions
Another approach, resembling the previous one, is to look at regions where the HI column density is low, irrespective of the CR intensity and away from the HI-chimney. The reason is that it may be that it is the HI density itself that is important rather than the CR intensity as such. Again, the results are shown in Table 1.
3.5 Correlations in High CR Intensity Regions
If, as seems possible, it is CR interacting with gas that gives rise to a pseudo-CMB contribution, then there should be an excess of (CMB) in regions where the CR intensity is high. Probably the best evidence for high CR intensities comes from studies of gamma rays (typically above 100 MeV) from SNR shocks (Bhat et al., 1985; Wolfendale & Zhang, 1994). It has been known for some years that the famous Loop I SNR has somewhat higher gamma ray emission than expected (Bhat et al., 1985; Wolfendale & Zhang, 1994). Most came from the well-developed ridge which is seen in radio, eg at 408 MHz, rising along 30∘ from the Galactic Plane. The gamma ray work just referred to also shows evidence for CR acceleration in the shell of another SNR, Loop III, (Landecker & Wielebinski, 1970) albeit at a lower level. Yet another SRN, Loop II, seems to be present, but rather weak and is disregarded.
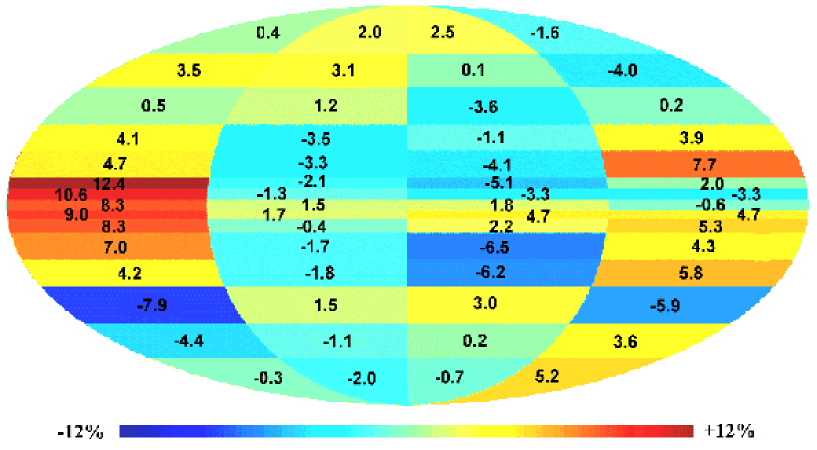
Table 1 shows the results for the leading edge of the Loop I SNR (The North Polar spur), which is best identified in radio. Also shown are values pertaining to the regions at where the two Loops cross the Galactic Plane (Figure 7 shows the relevant CMB temperatures). This region is chosen so as to maximize any potential signal (positive or negative) in view of the higher gas density here.
It is reassuring to note that the mean values of are almost always positive.
It remains in this section to consider the statistical significance of the correlation results so far.
Figure 7 shows a histogram for the values all over the sky. The abscissa is in standard deviations and relates to areas of the magnitude used in the analysis. The symbols above the plot are for the individual areas referred to above. It is evident that the divergences are, taken at their face value, very significant. Formally, the chance of getting such a situation is for the negative excursions and for those in the positive direction.
It is, of course, possible to question the significance on a number of levels: why choose the particular bin widths of latitude, and the particular size of the low N (HI) regions? The answer is that they were chosen before the results were known. Nevertheless, it is best to conclude at this stage that the correlations are ’very suggestive’.
3.6 Whole-sky correlations of gamma rays and CMB
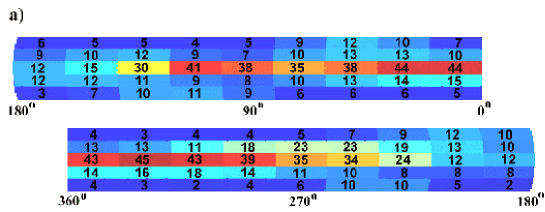
The EGRET data (Hunter et al., 1997; Tegmark et al., 2003)have been used to search for correlations over the whole Galaxy, although it is appreciated that the statistical accuracy of the gamma ray data is not great. Because there is a strong latitude dependence of the gamma ray intensity we study the CR-CMB correlation in narrow (but increasing with ) latitude bins. We concentrate on the highest energy (1 GeV) for which data of reasonable accuracy are available for the whole Galaxy.
The analysis has been made in two ways. Firstly, by taking the data in large, Quadrant size, bins in longitude and successive latitude bins and by taking 10 degree radius regions round successive pixels in the sky. Both methods have their merits, and demerits. Starting the with former, Figure 8 shows a map of the correlations in a manner such that the latitude – and Quadrant – dependence can be sought. It is evident that there are both. The Inner Galaxy has no overall positive correlation, formally it is negative, but the Outer Galaxy has a positive correlation, particularly in Quadrant 2. There is also a pronounced dependence on Galactic latitude. This behaviour is surely suggestive of a relationship between the gamma ray intensity and the average CMB temperature, although the interdependence of bins is a worry. It might be thought that one could take wider intervals of latitude, near the Galactic Places, but here the CR intensity is such a strong function of latitude that artifacts can easily occur.
Before continuing the (largely negative) correlations in the inner Galaxy will be considered further. It is possible, in principle, that the CMB radiation is absorbed in a particular geometrical way by high temperature ionized gas in the Galactic Halo, but the density and temperature needed are excessive. Another source of CR-intensity might be the answer: Inverse Compton interactions of electrons on starlight. Another possibility might be associated with the fact (Sect. 3.3) that there is the reverse gradient of the CMB power at latitudes above 10∘.
We found Quadrant-dependent effects in Sect. 2.2 and it is necessary to study Figure 8 in some detail. Although the latitude regions are of unequal width they can be considered with equal weight because, due to the strong -dependence of the gamma ray intensity, there are similar numbers of detected gamma rays in each band. In terms of strength of the correlation coefficient, the net coefficients are:
Quadrant ; Quadrant 2 ; Quadrant 3 ; Quadrant 4 ;
It is appreciated that adjacent latitude bins are not independent but this dependence is not too large, in view of the observed quite wide spread in coefficients from one bin to another. Thus, we conclude that there is some evidence for a correlation in the Outer Galaxy.
For the range above , the summed coefficients are:
Quadrant 1 ; Quadrant 2 ; Quadrant 3 ; Quadrant 4 .
The differences here are evidently of no significance.
The positive correlation,(as evinced by this technique – but see later), is confined to and is predominantly in the Outer Galaxy. To what extent this result militates against a CR-CMB correlation at is not clear, in view of the poor gamma ray statistics at these latitudes and the fact, mentioned already, that rather than the average CMB temperature that is important it is the temperature of the ’background’ over large angular scales (ie omitting the hot ’blobs’) that should be important. This topic is taken up again later.
Returning to the whole sky, the North-South difference is also of interest. The net coefficient from the North (positive ) is and that from the South is ; again an S-excess. Unfortunately, it is not clear how to work out the statistical significance of this result, except to say that it is in the correct sense. What can be done, however, is to rotate the CMB map and rework the correlations.
This has been done and we have gone further to the extent of examining the correlation between the CR-CMB correlation coefficient and , this has been done because we expect the coefficient to be higher in the regions of positive excess temperature if, as is expected, CR (-like) effects give additional signals.
The latitude region can be divided into two ranges, as usual: and . For the former, all 3-latitude bands show significant positive signals (averaged over ), for both N and S. Furthermore, the profile of the correlation of the coefficient, ), with is similar in the N and the S. In the rotated maps the similarity between N and S is usually only strong in the region , and occurs because of the correlation between adjacent bands – it will clearly be a maximum for such a narrow band, of width only 2∘. Taking the average amplitude alone, the chance of seeing positive signals of the magnitude seen or greater is estimated to be %. The shape similarity (or coefficient vs in the N and the S) will reduce this probability somewhat further, as will be demonstrated.
Continuing to higher latitudes, and show small positive average coefficients whereas to 45∘ and show small negative correlations. Before writing off evidence for a genuine CR-CMB correltion coefficient vs temperature at ,from this particular analysis, however, we draw attention to three features:
-
i)
In the S region (our preferred hemisphere for extra contributions) there is a distinct increase in correlation coefficient with increasing in each of the 4 ranges. In the rotated maps this happens in only 20% of the individual cases and in less than 10% for each in a set of 4.
-
ii)
From past arguments, we expect there to be a correlation between the CR intensity and the ’power per unit solid angle’ at small . The average temperature has a bigger contribution from the high temperature, spatially condensed regions, regions which we do not expect to be affected – except in their base level – by CR (-like) effects. Taking all data at we have examined the correlation of the CR-CMB correlation coefficient with the mean power for the bin (Figure 3, =10). The coefficient is positive at the 15% level.
-
iii)
The behaviour above =45∘ has relevance to the situation for referred to earlier and to the work considered in Wolfendale & Zhang (1994), viz the presence of an axis of symmetry; inspection of the correlation coefficients (Figure 8) for shows pseudo-Galactic N and S poles at: . These directions are those of the maxima in the two hemispheres beyond . They are reassuringly close to those for . The uncertainty in angle is, again, approximately .
The second approach, referred to above, has been made, using smaller spatial regions for the correlations. This involves comparing the appearance of the genuine WMAP and those for artifical universes. Two features in Figure 8 are considered by us to provide the evidence for a bona fide correlation of CR with CMB: the excess in the Galactic Plane and the presence of symmetry about the plane.
For the genuine map we derive the integrated length of longitude for which the CMB temperatures are above the ’red’ minimum (). This is for the WMAP and, for the artificial universe, the mean is . Thus, formally, the WMAP effect is at 5 standard deviations. The significance is almost certainly less than that for a Gaussian distribution, but is it probably greater than corresponding to a 1% probability of being spurious. For symmetry we count the number of symmetrical regions of length at least . There are 7 symmetrical regions compared with 2.0 1.4 for the artificial universes,ie a 3.6 standard deviation effect. The corresponding chance probability is almost certainly less than 5%.
Continuing to higher latitudes, we find, at =30∘ and 60∘, integrated red regions significant to the extent of 2.8 sigma and 2.6 sigma in comparison with the artificial universe results.
Our conclusion from this large scale CR-CMB correlation vs ’temperature’ study is that it exists.
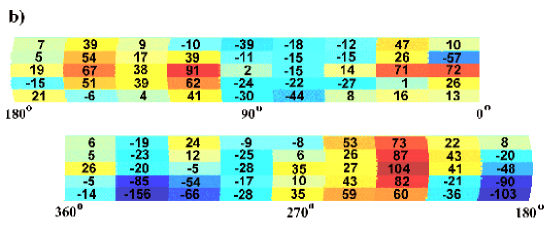
3.7 Restricted region studies at the highest energies
EGRET data are available to 30 GeV for a restricted region, , and a correlation analysis has been made here. Again, because of the strong -dependence of the gamma ray intensity, we take narrow bands of latitude. The results are shown in Figure 9. Although the spread is large there is a clear correlation of the high energy EGRET flux and the CMB excursions, for the region away from the very lowest Galactic latitudes, viz .
We would not have expected correlations for (and to a lesser extent for ) where the lines of sight are very long and where there is considerable ’confusion’. For , where we expect the best correlation following the arguments contributing to Figure 7, the slope is 2.2 standard deviations from zero taking all the data and significantly more for the (CR-favoured) S hemisphere, with smaller significance for the North.
3.8 Indirect studies of a CR-CMB Correlation for
Circumstantial evidence comes from N-S, -dependence effect and Quadrant differences.
For CR-related effects we would expect:
A southern excess; mean for Q2 mean for Q3; a fall-off with increasing latitude, where the quantity under examination is either the power at low or the mean temperature.
The results are, for Q1, 2 and 3 (Q4 is omitted, because of the ’big blue hole’)
- 1.
-
2.
Mean CMB temperature. Southern excess S-N , similar for both Q2 and Q3. Q2 Q3 . A fall-off of with increasing from as far as (from right down to ).
Evidently, most of the features expected do occur, the only exceptions being the reversal of Q2Q3 seen for the =10 power intensity and the termination of the fall in with increasing at 45∘. The former is considered later in Sect. 4. The last mentioned is interesting in its own right. It is seen in all Quadrants (Figure 4) and usually for both N and S. It is germane to remark that the 408 MHz and 5 individual WMAP frequency plots all show an upturn (or constancy) of intensity at = 60∘, in order of increasing . In our case, for the N, the increase (for Q’s 1,2 and 3) is 51 whereas for the South it is ; in the 408 MHz and WMAP frequencies, 4 out of the 5 sets of data which show an increase have a bigger effect in the North. In the power spectrum, =10, data (Figure 4) there is an increase in 4 out of 6 cases although that for the South exceeds that from the North.
3.9 Summary of the CR-related - CMB correlations
It is concluded that for there is good evidence for a correlation of some form; each and every analysis shows an effect. The overall chance probability is less than about 2%.
In the range to there is ambiguity, epitomized by the systematically low intensities in the power spectrum for both = 10 and =100. This is reflected in only if Q4 is included. Without it, the mean temperature for is only a little above zero.
Moving to there is evidence for a correlation of CR with either power intensity (at ) or but the most direct evidence comes from the deficit in in the special regions (Galactic chimneys and regions of steep CR spectrum) and the excess in the SNR shock regions. Insofar as the special regions cover the range , too, there is evidence for correlations here, too, despite the ambiguities referred to above. The overall chance probability is, conservatively, at the 2% level.
4 Combination of External and Internal studies of the WMAP
By ‘external’ we mean the comparison of the WMAP data with cosmic ray parameters and by ‘internal’ we mean a comparison of WMAP data within itself, eg N-S asymmetry, -dependence.
The largest effect concerning non-uniformity relates to low latitudes, typically , or somewhat wider. Both internally and externally there are differences at low latitudes; a Galactic origin is surely very likely here which may, or may not, be CR-related. The main question to be addressed is “are there foreground effects beyond or, in view of the anomalous region , beyond 20∘
This aspect will now be addressed in some detail.
The evidence favouring CR-related effects at can be summarised as follows:
-
i)
The deficit in the mean WMAP temperature associated with the regions of steep CR spectra and low HI column densities are quite significant, and extend to .
-
ii)
The excess for the North Polar Spur similarly extends to . It, too, is significant.
-
iii)
The large scale CR-CMB correlation adds a little weight - at least at the 3% significance level (although the absence of much correlation in the Inner Galaxy is a worry).
-
iv)
The N-S symmetry is large at small (for the power spectrum) and continues to , after which it falls. This is mirrored by the 408 MHz signal and by the individual WMAP data for the various frequencies. It is generally agreed that the -dependence of the 408 MHz and the individual WMAP data sets is due to CR-related Galactic foreground and the low power spectrum asymmetry presumably has the same cause.
-
v)
The form of the actual latitude dependence of various parameters presumably also has the same cause. For the five frequencies the ratio of to is 2.1 (it falls slowly with increasing frequency from 2.3 to 1.9). Our ratio for the power at is 1.7, ie 1.3 for the root mean square temperature. The ratio for larger -values will be smaller. The relationship between the longitude-averaged values for the five frequencies and that for for small () is not completely clear but if the fluctuations are a constant fraction of the total DC signal then the ’2.1’ is to be compared with the ’1.3’. Taken at its face value it would mean that the maps were cleaned to the extent of a factor 4 - and a greater factor at higher (eg by at , using Figure 1d). These factors relate to where most of the CMB signal used for cosmological analyses resides. A lack of cleaning to the extent derived (25% of the signal at being CR-related noise) at is clearly serious.
-
vi)
At the highest latitude the consistency of the maximum intensity, from one parameter to another, adds confidence.
-
vii)
A comparison of both and power (for ) for Q2 and Q3 gives understandable results in terms of Galactic phenomena.
5 Application to Cosmology
5.1 General Remarks
In the absence of clear evidence as to the exact origin of the foreground responsible for the various anomalies in the CMB map it is not possible to correct for it and make an updated cosmological interpretation. However, some progress can be made by looking in detail at three important parameters:
-
-
the height of the ’one-degree peak’;
-
-
the -value of the peak, and
-
-
the amplitude of the power spectrum at low ().
5.2 The height of the one-degree peak
Figure 10 shows the power spectrum for the whole data used by us. Also shown is what is generally regarded as the standard form as given by the WMAP workers themselves (and a curve 10% below this). We note that ’our’ value is low. Interestingly it is nearer to the conclusions drawn from pre-WMAP observations (see (2003)). Specifically, the heights of are:
The difference in height of the peak between our value using the data of Tegmark et al. (2003)and the datum Bennett et al. (2003b) is seen to be at least 25% and therefore serious.
Turning to the variations from Quadrant to Quadrant and N to S, Figures 1 and 2 indicate that these are (at ) of order 10%; similarly, Figure 5 suggests that the observed peak is some 10% too high, in the sense that the red (with extra signals) and blue (without) differ such as to give this difference.
There are two ways forward at this juncture, the first is to assume that our derived value of 3490 (less 10%), ie 3140 is correct and the other that there is a systematic displacement in the scale of the result derived using the cleaned data of Tegmark et al. (2003), and that we should take 90% of the WMAP groups’ result Bennett et al. (2003b); (2003), viz .
The implication of a low peak value is most likely that , the mass content of the universe, should be reduced, although we appreciate that other variants to the cosmological parameters can be taken. Nevertheless, a reduced peak height is most easily achieved by increasing (or specifically ) (Hu, 2003). A peak height of 3590 would indicate , a very high value, and 5130 yields , itself significantly higher than the ’standard value’.
5.3 The -value of the one-degree peak
Less susceptible to systematic errors is the -value of the peak. Conventionally it is at = 220 but it is apparent that our result is systematically lower.
Values have been derived for for the Quadrants, by fitting a ’standard shape’ of W(), derived from the whole data. The values are:
-
-
Quadrant 1 ;
-
-
Quadrant 2 ;
-
-
Quadrant 3 ;
-
-
Quadrant 4
giving a best-estimate of . This value is lower than the conventional 220. Using the expression = -0.24 (Hu, 2003) and a datum of = 0.15, we have = 0.17, ie =0.22.
An alternative approach is by way of Figure 5. Again, using the blue spectrum we have , ie and , ie . The estimated error is .
5.4 The situation at low -values
It is well know that there is a loss of power below in comparison with conventional expectation (Bennett et al., 2003b) and this has given rise to speculation of ’new physics’ (eg Efstatiou (2003)). One possibility is that it is ’mere’ cosmic variance that is responsible and it is true that this is large at low -values. The big differences from Quadrant to Quadrant, both for low and high latitudes, have relevance here; they show that there may be genuine differences. However, these may be due to CR-related foregrounds insofar as the deviations from one Quadrant to another are bigger in the region .
At first sight there is evidence for an even greater fall off of power at low with increasing latitude so that, in the absence of a cosmic-variance-inspired effect, the anomaly might be thought to be secure. However, we are struck by the results in Figure 5 which shows a near-normal power law intensity at low -for the blue regions, ie the favoured set of data. Although the peak of the blue curve is low, from downwards, the form of the blue curve mirrors that of the conventional prediction all the way down to the lowest values of . A possibility is that the form of the foreground contribution is such as to reduce the apparent power at low -; we remember that the total temperature variations are normalized to zero.
6 Conclusions
The major conclusion from this work is that there are features of the WMAP of the fluctuations in the CMB that are not related to the early universe, but are due to a ’foreground’. Some of the foreground at least is surely of Galactic origin and it appears to exist at all Galactic latitudes.
Large scale asymmetries (also seen by others) exist on scales of North vs South and Quadrant to Quadrant. Our understanding of them is limited but guidance seems to come from correlations of the mean temperature, and intensity of the power spectrum, with cosmic ray features.
The implications for cosmology are complex, but some remarks can be made, as follows:
-
1.
Presently derived cosmological constants are more uncertain than usually appreciated.
-
2.
If it is assumed that the only parameter to be adjusted is the universal mass fraction then there is evidence for it being larger than the canonical 0.15. Two of our analyses suggest that it is 0.22 0.05. Another analysis gives a value as high as 0.40. It is premature, however, to put much weight on this very high value. Nevertheless, a value higher than the canonical = 0.15 is preferred. Of course, variations of the values of other cosmological parameters are possible, but such variations would also be of great interest.
-
3.
The situation at low is interesting and our analysis suggests that the more conventional view may prevail, viz that the apparent missing power may be an artifact.
Acknowledgments
The authors are grateful to W.J. Frith for helpful comments and to M. Tegmark for helping us to access the WMAP data.
Some of the results in this paper have been derived using the HEALPix (Górski et al., 1999).
References
- Banday & Wolfendale (1990) Banday A.J. and Wolfendale A.W., 1990, Mon. Not. R. Astr. Soc. 245 182.
- Banday & Wolfendale. (1991) Banday A.J. and Wolfendale A.W., 1991, Mon. Not. R. Astr. Soc. 252 462.
- Bennett et al. (2003a) Bennett C.L. et al., 2003a, Ap.J., 583, 1.
- Bennett et al. (2003b) Bennett C.L., et al., 2003b, Ap.J.Suppl, 148, 1.
- Bennett et al. (2003c) Bennett C.L. et al., 2003c, Ap. J. Supp. 148, 97.
- Bhat et al. (1985) Bhat C.L. et al., 1985, Nature, 314, 515
- Burton & Deul (1987) Burton W.B. and Deul E.R., 1987, ’The Galaxy’, eds. G. Gilmore and B. Carswell, D. Reidel, 141.
- Chi & Wolfendale. (1990) Chi X. and Wolfendale A.W., Mon. Not. R. Astr. Soc. 245 101.
- Fathoohi et al. (1985b) Chi X. et al., 1995, J. Phys. G 21, 1547.
- De Oliveira-Costa, et al. (2004) De Oliveira-Costa A et al., 2004, Ap. J. Lett. 606 L89
- Efstatiou (2003) Efstatiou G., 2003, Mon. Not. R. Astr. Soc., 343, L95
- Ericksen, et al. (2004a) Ericksen, H.K. et al., 2004, Ap.J. 605, 14.
- Eriksen et al. (2004b) Eriksen H.K. et al., 2004, Ap.J. 612, 64.
- Erlykin et al. (1996) Erlykin A.D. et al., 1996, Aston. Astrophys. Supp. 120 397.
- (15) Erlykin A.D. and Wolfendale A.W., 2001, J. Phys. G 27 941.
- Fathoohi et al. (1985a) Fathoohi L.J. et al., 1985, J. Phys. G 21, 679.
- Górski et al. (1999) Górski K.M. et al., in Analysis Issues for Large CMB Data Sets, Proceedings of the MPA/ESO Cosmology Conference ‘Evolution of Large-Scale Structure’, eds. A.J. Banday, R.S. Sheth and L. Da Costa, PrintPartners Ipskamp, NL, pp. 37-47 (1999); also: astro-ph/9812350.
- Hansen et al. (2004) Hansen F.K. et al., 2004, Ap. J. Lett., 607 667.
- (19) Hinshaw G. et al., 2003, Ap. J. Supp. 148 135.
- Hu (2003) Hu W., 2003, CP666 The Emergence of Cosmic Structure Thirteenth Astrophys. Conf. Ed. S.S. Holt and C.S. Reynolds AIP, 45.
- Hunter et al. (1997) Hunter S.D. et al., 1997, Ap. J. 481, 205.
- (22) Komatsu E. et al., 2003, Ap. J. Supp., 148 119.
- Landecker & Wielebinski (1970) Landecker T.L. and Wielebinski R., 1970, Aust. J. Phys. Astrophys. Suppl., 16, 1.
- Osborne et al. (1995) Osborne J.L. et al., 1995, J.Phys.G., 21, 429.
- Spergel et al. (2003) Spergel D.N. et al., 2003, Astrophys. J. Suppl., 148, 175.
- Tegmark et al. (2003) Tegmark M. et al., 2003, Phys. Rev. D 68, 123523.
- (27) Watson R.A. et al, Large Scale Structure and Motions in the Universe, 1988, eds M. Mezzetti et al, Kluwer, Dordrecht, 133.
- Wibig & Wolfendale (2004) Wibig T. and Wolfendale A.W., 2004, Nucl. Phys. B 136C, 179.
- Wibig & Wolfendale (2005) Wibig T. and Wolfendale A.W., (in preparation).
- Wolfendale & Zhang (1994) Wolfendale A.W. and Zhang L., 1994, J.Phys.G 20, 935.
| steep electron/proton spectra | |||
|---|---|---|---|
| () | () | ||
| low HI column density | |||
| () | () | ||
| Galactic chimneys | |||
| () | () | ||
| ‘Loops’ | |||
| () | () | ||