Intermediate-band Photometry of Type Ia Supernovae
Abstract
We present optical light curves of five Type Ia supernovae (2002er, 2002fk, 2003cg, 2003du, 2003fk). The photometric observations were performed in a set of intermediate-band filters. SNe 2002er, 2003du appear to be normal SN Ia events with similar light curve shapes, while SN 2003kf shows the behavior of a brighter SN Ia with slower decline rate after maximum. The light curves of SN 2003cg is unusual; they show a fast rise and dramatic decline near maximum and do not display secondary peak at longer wavelengths during 15-30 days after maximum light. This suggests that SN 2003cg is likely to be an intrinsically subluminous, 91bg-like SN Ia. Exploration of SN Ia feature lines through intermediate-band photometry is briefly discussed.
National Astronomical Observatories of China, Chinese Academy of Sciences, Beijing 100012, PR China
Department of Astronomy, Beijing Normal University, Beijing 100875, P R China
1. Introduction
Supernova (SN) light curves are one of the major sources of information about the nature of these events. They infer structures of the stellar progenitors and reflect the underlying energy sources created in the explosion. Direct comparison of peak luminosities and multiband light curves with the predictions of theoretical models lead to better understanding of the physics of supernova explosion. Light curves of thermonuclear supernovae (SNe Ia) are now the primary tool for the study of precise cosmology (Leibundgut 2001).
We have been engaged in systematic optical monitoring of bright SNe in nearby galaxies (z0.01). The photometric system we use is part of 15-filter intermediate-band system designed to cover the wavelength range 3300 - 1m, which avoids known and variable sky emission. A description of this unique photometric system, also dubbed the BATC system, are detailed elsewhere (Fan et al. 1996; Yan et al. 1999). By using the intermediate-band filters we may learn more about SN light curves. In particular, we could explore the evolution of some spectrum lines during SN explosion through spectrophotometry. Here we report our initial results of the intermediate-band SN photometry program.
2. Intermediate-band Light Curves
In Figure 1, we present the intermediate-band light curves of five SNe Ia. They are SN 2002er in UGC 10743, SN 2002fk in NGC 1309, SN 2003cg in NGC 3169, SN 2003du in UGC 9391, and 2003kf in MCG-02-16-002. Observations of these SNe were made near maximum light in several BATC filters (e.g. dth, hth, ith, kth, and nth filters that centered on 4550, 6075, 6660, 7490 and 8480 respectively). As can be seen from the figure, the light curves of SNe Ia in d and h filters resembles those in B and V except for a decrease of the decline after maximum. The secondary peak feature was observed in BATC’s redder light curves. The most pronounced feature presents in k band, where no prominent spectrum line emerges during the second peak period. It is therefore that the occurrence of the secondary peak is not due to the spectral feature but it is likely due to the time evolution of line opacities (Wheeler et al. 1998)
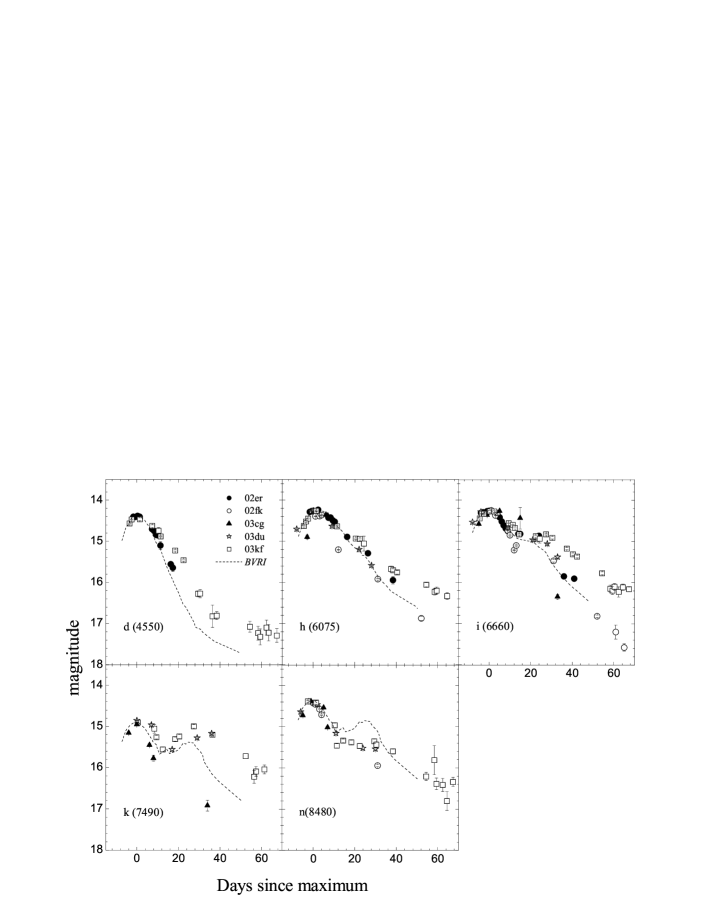
Nevertheless, the diversity of the light curves in several of BATC’s passbands is readily apparent. The differences are most pronounced in i band (and possibly in k band), where the differences in magnitude decline after maximum could reach 0.5 mag at epoch of 30 days and reach 1.0 mag at 60 days even without including SN 2003cg. We considered SN 2003cg as an intrinsically subluminous SN Ia for two reasons. First, the shoulder or secondary peak appears to be missing for SN 2003cg in i and k light curves. This feature is absent for SN 1991bg-like SN Ia events such as SNe 1997cn (Turatto et al. 1998), 1999by (Garnavich et al. 2001). Second, the light curves of SN 2003cg near maximum light are much narrower than normal SNe Ia (see Fig 1). On the other hand, SN 2003kf seems to be an luminous SN Ia. The light curves of SN 2003kf in d band declined by 0.680.02 mag in the first 15 days after maximum, while the counter value of SN 2002er is 1.030.03 mag and its is reported to be 1.330.04 (Pignata et al. 2004).
3. Evolution of Feature Lines
One merit of using BATC’s filters is that they may properly cover the broad spectral lines of SNe at proper redshift. For instance, the h filter may cover Si II 6355 (blueshifted to 6150) and the n filter may cover CaII IR triplets for nearby SNe Ia at . Thus we can gain some knowledge about the evolution of some feature lines of supernovae from the corresponding intermediate-band light curves.

Figure 2 shows the flux ratio of h band vs. i band and n band vs. k band. F(6075)/F(6660) may indicate the variation of SiII6355 while F(8480)/F(7490) may reflect the evolution of CaII IR triplet during the explosion.
The observations discussed here are part of our intermediate-band photometric program on bright SNe. The intermediate-band photometric data of a total 20 SN sample are being analyzed for further publication (Wang et al. 2004 in preparation).
Acknowledgments.
Financial support for this work has been provided by the National Science Foundation of China (NSFC grant 10303002; 10173003) and National Key Basic Research Science Foundation (NKBRSF TG199075402).
References
- Fan et al. (1996) Fan, X., Burstein, D., Chen J., et al. 1996, AJ, 112, 628
- Garnavich et al. (2001) Garnavich P., et al. astro-ph/0105490
- Leibundgut (2001) Leibundgut B. 2001, ARA&A, 39, 67
- Pignata et al. (2004) Pignata G., Patat F., Benetti S., et al. 2004, MNRAS, in press (astro-ph/0408234)
- Turatto et al. (1998) Turatto M., et al. 1998, AJ, 116, 2431
- Wang et al. (2004) Wang X. F., Zhou X., Zhang T. M., et al. 2004 in preparations
- Wheeler et al. (1998) Wheeler J. C., et al. 1998, ApJ, 496, 908
- Yan et al. (1999) Yan, H., Burstein, D., Fan X., et al. 1999, PASP, 112, 691
- Zhang et al. (2004) Zhang T. M., Wang X. F., Zhou X., et al. 2004, AJ, in press. astro-ph/0406582