1–12
The Effects of Multiple Weak Deflections in Galaxy–Galaxy Lensing
Abstract
The Hubble Deep Field (North) and the flanking fields are used investigate the occurrence of multiple weak lensing deflections along the line of sight in relatively deep imaging data (, ). Ray tracing simulations of galaxy–galaxy lensing in the HDF-North show that proper inclusion of multiple weak deflections is important for a correct prediction of the net shear for most sources, and for a given source redshift the number of multiple weak deflections is largely insensitive to the cosmography. The effects of multiple weak deflections on the magnitude of the weak lensing signal are, of course, strong functions of the adopted halo parameters. Independent of the halo parameters, however, the closest lens to a source (in projection on the sky) is not the strongest lens in the case of more than 50% of the sources which acquire a net shear of . In addition, multiple weak deflections result in a tangential shear about the lens centers that is greater than the tangential shear that would occur if source galaxies were lensed solely by the closest lens. Further, multiple weak deflections give rise to correlated image ellipticities and account for a substantial amount of the total cosmic shear signal on small angular scales in CDM and open CDM models.
1 Introduction
It is now generally agreed that it will be possible in the near future to obtain precision cosmological results via weak lensing measurements. However, this statement is often interpreted to mean merely that with appropriate due diligence on the observational end, precision constraints will result. The focus of this paper is to remind the reader that highly accurate theory is equally important to the goal of placing strict constraints on cosmology. Simon White expressed this very nicely in his review talk on numerical simulations when he said simply “Precision cosmology will require precision simulations.”
This paper attempts to demonstrate the truth of Simon’s statement by studying the effects of multiple weak lensing deflections on both the galaxy–galaxy lensing signal and the cosmic shear signal. Galaxy–galaxy lensing has come a long way since the 1995 IAU Symposium on gravitational lensing, where it appeared on the programme in the “Emerging Techniques” session (Brainerd, Blandford & Smail 1996a). Due to a great deal of work by a number of different groups, galaxy–galaxy lensing has not only been detected with impressively high statistical significance, but it is also being used to place strong constraints on the nature of dark matter halos and on the bias between light and mass in the universe (see, e.g., Fischer et al. 2000; McKay et al. 2001; Hoekstra, Yee, & Gladders 2004; Kleinheinrich et al. 2003; Kleinheinrich 2004; Natarajan et al. 220; Seljak 2004)
Simulations of galaxy–galaxy lensing for a moderately deep imaging survey () performed by Brainerd, Blandford & Smail (1996b), hereafter BBS, showed that most of the galaxies with magnitudes in the range would, in fact, have been lensed at a comparable level by two or more foreground galaxies (e.g., §3.5 of BBS). That is, multiple deflections are expected to occur quite frequently in deep data sets and, in particular, when comparing predictions for cosmic shear from a simulation to observations of cosmic shear on small angular scales, it is important that the simulation reproduce faithfully all of the weak galaxy lenses along the line of sight. In other words, a fair comparison between observations and theory on the scales for which galaxy–galaxy lensing is important depends crucially on the ability of simulations to follow the growth of the non–linear power spectrum accurately. Even with current codes and computer architecture, this is still somewhat challenging and appropriate care must be taken (see, e.g., Simon White’s review in these proceedings).
The Hubble Deep Field (North) and the flanking fields have been the subject of a deep redshift survey (Cohen et al. 2000) as well as an extensive multicolor photometric investigation (Hogg et al. 2000). As a result, both the redshifts, , and the rest–frame blue luminosities, , of galaxies in this region of space are known (Cohen 2002). Therefore, it is possible to make quite a detailed theoretical prediction for the weak galaxy–galaxy lensing shear field in the region of the HDF–North and, specifically, for the probability and effects of multiple deflections due to galaxy–galaxy lensing.
2 Halo Properties and Fiducial Model
For simplicity, the approach of BBS in their galaxy–galaxy lensing simulations was adopted and the physical properties of the dark matter halos around the galaxies in the HDF–North and the flanking fields were scaled in terms of the characteristic properties associated with the halos of galaxies. The velocity dispersion of an galaxy halo is given by and it was assumed that a Tully–Fisher or Faber–Jackson type of relation held for each of the galaxies. Therefore,
| (1) |
where is the velocity dispersion of a halo in which a galaxy with luminosity resides. The density profile of the galaxy halos was taken to be
| (2) |
where is Newton’s constant and is a characteristic halo radius. Further, it was assumed that the mass–to–light ratio of a galaxy was constant independent of its luminosity and, therefore, the radii of the halos of galaxies with scale with the radii of the halos of galaxies according to:
| (3) |
The total mass of the halo of an lens galaxy is finite and given by:
| (4) |
Having made these assumptions, it is then possible to make predictions for the galaxy–galaxy lensing shear field within the region of the HDF–North that would be generated by the galaxies in Cohen (2002). The lens galaxies include not only galaxies in the HDF–North, but also galaxies in the flanking fields. Because some of the galaxies in the flanking fields have quite substantial masses, the weak lensing effects of these galaxies have the potential to affect the shear field inside the much smaller region of the HDF–North. Therefore, the flanking field galaxies were included in all of the calculations for the weak shear field inside the HDF–North itself. Also, in order to have a consistent limiting magnitude for the galaxy lenses, only those galaxies in Cohen et al. (2000) with were used in the calculations (i.e., the completeness limit of the full redshift survey is deeper in the HDF–North than it is in the flanking fields).
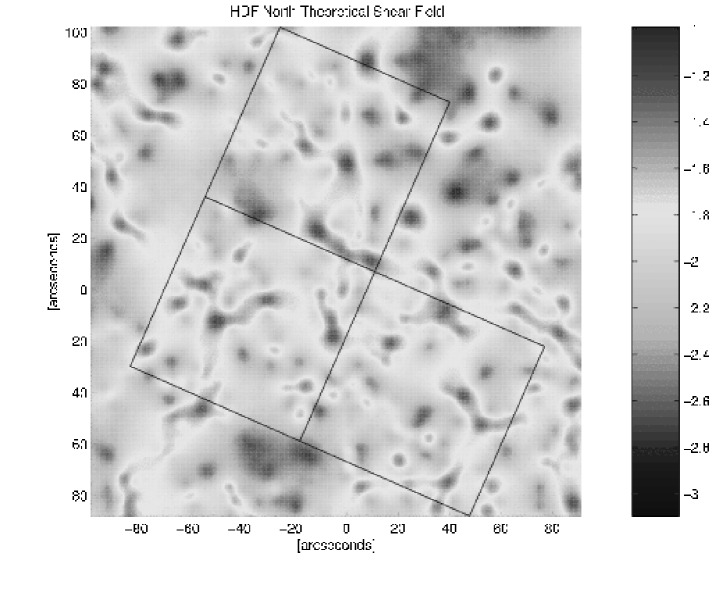
Shown in Fig. 1 is the theoretical shear field in the region of the HDF–North that would be produced by the 427 galaxies in Cohen et al. (2000) and Cohen (2001) for which , and both spectroscopic redshifts and rest frame blue luminosities are known. The median redshift of the lenses is . Source galaxies were assumed to have apparent magnitudes in the range , and were distributed randomly on the sky. A flat, –dominated cosmography with km/s/Mpc, , and was adopted for Fig. 1. A fiducial galaxy model for which the velocity dispersion of the halo is km/s and the outer scale radius is kpc was used and the source galaxies were assumed to follow a redshift distribution of the form:
| (5) |
(e.g., Baugh & Efstathiou 1993), which is in good agreement with the redshift surveys of LeFèvre et al. (1996) and LeFèvre et al. (2004). Here
| (6) |
where is the median redshift, is the median -band magnitude, and is the derivative of the median redshift with respect to . Extrapolating the results of LeFèvre et al. (2004) to a sample of galaxies with , , , , and . The median redshift of the sources is . Fig. 1 shows the mean over 6500 Monte Carlo realizations of the weak lensing shear field and a close comparison of this figure with an image of the HDF–North shows that the peaks in theoretical shear field correspond to the brightest galaxies in the HDF–North.
3 Multiple Deflections
This probability that a given source will have been weakly–lensed by one or more foreground galaxies is, of course, a strong function of the actual value of the shear, , due to a given weak lensing deflection. That is, it is much more likely for a distant galaxy to be lensed by a foreground galaxy which produces an insignificant weak shear of than, say, a large weak shear of . Therefore, in order to discuss the total number of weak deflections that a given source galaxy is likely to encounter, a decision has to be made as to what minimum value of qualifies as a “significant” deflection.
A typical value for the net shear due to galaxy–galaxy lensing is (see, e.g., the observational papers cited in the Introduction) and this value of was used as a baseline for computing the number of weak lensing deflections that source galaxies had undergone. Specifically, the probability that a given galaxy was lensed by foreground galaxies, , where each individual deflection gave rise to a shear of was computed. That is, is the probability that a given galaxy had been lensed by two individual foreground galaxies, each of which lensed the distant galaxy at a level that is comparable to or greater than the expected net shear due to galaxy–galaxy lensing. Therefore, the results shown here are an extremely conservative estimate of the frequency of multiple deflections.

Shown in Fig. 2 is the theoretical probability distribution function, , for source galaxies in the HDF–North with a given redshift, . The fiducial halo model and redshift distribution adopted for Fig. 1 were also used here. In addition, the cosmography was varied from the flat, –dominated model used in Fig. 1 to include both an open (, ) and an Einstein–de Sitter model for Fig. 2. From this figure, then, the probability that a source at redshift has been lensed at a significant level by two or more foreground galaxies is of order 60%. Also, it is clear from Fig. 2 that the probability of multiple deflections occurring is essentially independent of the cosmography. Instead, the frequency is influenced most strongly by the number of massive lens galaxies that are close to the line of sight (i.e., galaxy–galaxy lensing provides information primarily about the potentials of the lens galaxies, not cosmology per se; see also BBS).
At a source redshifts , the probability of a source galaxy encountering multiple deflections of increases to of order 90%. Therefore, in a deep data set for which the median redshift is , it should be expected that multiple weak deflections of a substantial magnitude are very likely to have occurred. Of course, in the case of individual deflections for which , the probability of comparable multiple deflections occurring at any given source redshift will be greater than the results shown in Fig. 2.
4 Effects of Halo Parameters on Multiple Deflections
While the occurrence of multiple deflections is largely independent of the cosmology, it is certainly not independent of the details of the halo parameters. In Figs. 1 and 2 a fiducial galaxy halo with km/s and kpc was adopted. However, galaxy–galaxy lensing constraints on the characteristic velocity dispersion of the lens galaxies range from km/s (e.g., McKay et al. 2001; Hoekstra, Yee, & Gladders 2004) to km/s (e.g., Kleinheinrich et al. 2004). Constraints on the characteristic scale radius are few, and based on the galaxy–galaxy lensing observations of Hoekstra, Yee, & Gladders (2004), the halos of galaxies may be as large as kpc.
In this section, then, the effects of varying the halo parameters on the occurrence of multiple deflections is investigated. Since the occurrence of multiple deflections is only weakly dependent on the cosmography, for the remainder of this paper only the flat, –dominated model was used. Again, all source galaxies were assumed to have magnitudes in the range , with redshifts determined by eqns. (2.4) and (2.5) above. The halo parameters of the lens galaxies in the HDF–North and flanking fields were then varied as follows: km/s, 150 km/s, and 165 km/s; kpc, kpc, and kpc.

Shown in Fig. 3 is for all source galaxies in the HDF–North with . Like Fig. 2, the minimum value for a “deflection” to be counted in this figure is . Unlike Fig. 2, however, has been computed over the entire redshift distribution of the sources. From this figure, then, the probability that a given source in the HDF–North has been lensed more than once is 27% for the lowest mass halo (upper left panel), 53% for the fiducial halo of Figs. 1 and 2 (center panel), and 69% for the highest mass halo (bottom right panel). Therefore, it is clear that the mass adopted for the halo of an galaxy has a rather substantial effect on the number of multiple deflections that occur in a galaxy–galaxy lensing calculation.

Since the halos are roughly isothermal and, therefore, the shear decreases with projected radius approximately as , it is interesting to ask whether the closest lens to a given source (in projection on the sky) is necessarily the strongest lens. That is, for a source that undergoes multiple deflections, is the strongest deflection most likely to come from the nearest lens on the sky? The answer to this question is “No,” and is shown clearly by Fig. 4. In the case of sources for which the net shear (i.e., the total shear after all weak deflections have occurred) is , more than 50% of the time the strongest lens is not the closest lens on the sky. Note that this result is essentially independent of the characteristic halo parameters that were chosen, which is consistent with the fact that, by and large, it is only the most massive galaxies that contribute substantially to the overall galaxy–galaxy lensing signal.
Figs. 5 and 6 demonstrate a result that is perhaps somewhat counter–intuitive: multiple weak lensing deflections, on average, give rise to a greater net shear on the source galaxies and a greater mean tangential shear about the lens centers. That is, multiple deflections do not simply cancel one another out, leading to little or no net shear on the source galaxies. Fig. 5 shows probabilities for the distribution of the ratio of the maximum value of any given single deflection, , to that of the net shear, , for all sources with that underwent more than one deflection of any magnitude (i.e., ). The vertical dotted line shows the median value of the distribution, and for all halo models the median is less than 1. That is, more than 50% of the time, the net shear on a given source is greater than the maximum single deflection that it underwent.

Fig. 6 shows the mean tangential shear, computed about the lens centers in the HDF–North. Squares show the results of the proper inclusion of multiple deflections for all sources, and crosses show the result of lensing each source solely by the closest lens on the sky (i.e., a “single deflection” calculation). In all cases, the inclusion of multiple deflections gives rise to a larger mean tangential shear on scales , and in the case of the more massive halos, the increase in the shear is quite substantial. This figure, then emphasizes the need for a correct, multiple deflection calculation when using observations of the mean tangential shear to constrain the halo properties of the lens galaxies (i.e., the comparison of single deflection calculations to observations leads to an inferred halo mass for galaxies that is too large).

5 Correlated Image Ellipticities and Cosmic Shear
In addition to giving rise to a generally larger net shear on source galaxies and a larger mean tangential shear about the lens centers, multiple deflections in galaxy–galaxy lensing give rise to correlated ellipticities in the images of the galaxies. This is, of course, precisely the effect of cosmic shear, but in the case of galaxy–galaxy lensing, this is merely the very small end of the power spectrum (i.e., the highly non–linear regime) that is contributing to the total cosmic shear signal (i.e., when computed over all structures along the line of sight).

The degree to which multiple deflections give rise to correlated image ellipticities and, hence, contribute to the cosmic shear signal is a strong function of the mass adopted for the halo of an galaxy. This is shown in Fig. 7, where the shear correlation function,
| (7) |
is shown as a function of the halo parameters. The mean value is computed for all foreground–background pairs of galaxies separated by angles on the sky (see, e.g., Blandford et al. 1991). Here is the image shape of galaxy and is the complex conjugate of the image shape of galaxy . The image shape is defined as
| (8) |
where and are the major and minor axes of the image equivalent ellipse and is its position angle. As in Fig. 6, squares show the results of the full multiple deflection calculations and crosses show the results of calculations in which each source was lensed solely by the closest lens on the sky. From this figure, then, the single deflection calculations do not give rise to correlated image ellipticities on scales (on smaller scales, of course, the images of distant sources that have been lensed by the identical foreground galaxy will be correlated because of the tangential alignment about the lens center). In the multiple deflection calculations, however, sufficiently massive halos give rise to correlated ellipticities that persist to significantly large angles, just due to the galaxy–galaxy lensing signal alone.
Oftentimes the phrase “cosmic shear” is interpreted to mean “lensing by large–scale structure”, and this is true on large angular scales where it is only structure in the linear regime that is responsible for the gravitational lensing. Properly, however, cosmic shear is the lensing of distant galaxies by all the mass along the line of sight, including highly non–linear structures. This is why, on small angular scales, it is necessary to use large simulations (e.g., Jain, Seljak, & White 2000; Valageas, Barber, & Munshi 2004; Vale & White 2003) to make accurate theoretical predictions of cosmic shear.
From Fig. 7, it is clear that, depending upon the characteristic mass of the halos of galaxies, galaxy–galaxy lensing will contribute to the cosmic shear signal as measured, for example, via the top hat shear variance,
| (9) |
Here is the power spectrum of the projected mass density of the universe, is a Bessel function of the first kind, and is the size of the aperture over which the mean is computed. In an observational data set, the function is computed as
| (10) |
for all galaxies within an aperture of size on the sky (see, e.g., Hämmerle et al. 2002). The above published predictions for in CDM models have been based on simulations in which the mass and force resolution were not quite adequate to resolve the halos of galaxies particularly well and, so, it is difficult to be certain how accurate the theoretical predictions truly are on very small angular scales.

The symbols in Fig. 8 show the r.m.s. cosmic shear, , computed within circular apertures of radius in the full multiple deflection calculations of galaxy–galaxy lensing in the HDF–North. That is, the symbols in this figure show the r.m.s. cosmic shear due to galaxies alone, without any contribution from linear or quasi–linear structures along the line of sight. From bottom to top, the point types correspond to increasing the halo mass from a minimum mass of (open diamonds) to a maximum mass of (four–pointed stars). The mass of the fiducial halo with km/s and kpc is , and the r.m.s. cosmic shear in this case is shown by the solid squares. Also shown is the prediction for for CDM and open CDM from the simulations of Jain, Seljak, & White (2000) for a source galaxy population with median redshift of (i.e., similar to the HDF–North raytracing simulations for sources with ). The CDM and OCDM predictions do not extend below .
The filled circles and filled triangles show the r.m.s. cosmic shear produced by galaxy–galaxy lensing alone for cases in which the mass of the halo of an galaxy is % less than the fiducial halo mass and % greater than the fiducial halo mass, respectively. At , then, a change in the fiducial halo mass of only 20% results in a change in the predicted cosmic shear signal that is quite comparable to the predicted differences between two rather different cosmological models. In other words, if one wishes to use observations of cosmic shear on small angular scales to constrain the cosmography (through, e.g., a comparison to ray–tracing simulations) it is vital that the simulations have followed the formation of the growth of non–linear structures very accurately.
The r.m.s. cosmic shear due solely to galaxy–galaxy lensing extrapolates to zero at for the fiducial halo model with km/s and kpc. It is, therefore, only on scales that contributions of galaxy–galaxy lensing to the cosmic shear signal are likely to be of importance.
6 Conclusions
The occurrence and effects of multiple weak deflections due to galaxy–galaxy lensing were investigated for a deep data set in which and . Ray–tracing simulations of galaxy–galaxy lensing by lens galaxies with in the Hubble Deep Field (North) and flanking fields were used to compute the net shear on source galaxies with magnitudes in the range . Both the redshifts and the rest frame blue luminosities of the lenses are known, which allows for a detailed theoretical prediction of galaxy–galaxy lensing in the HDF–North, given a particular cosmography and a model for the halos of the lens galaxies. The primary conclusions from this work are:
-
•
Multiple weak deflections are commonplace in such deep data sets, and the proper inclusion of multiple deflections is important to a correct prediction for the net shear experienced by the majority of source galaxies.
-
•
For a given source redshift, the probability of multiple weak deflections is largely insensitive to the cosmography (i.e., galaxy–galaxy lensing is much more sensitive to the details of the gravitational potentials of the lens galaxy halos than it is to the values of the cosmological parameters).
-
•
Compared to a single deflection calculation in which sources are lensed solely by the nearest lens on the sky, a full multiple deflection calculation leads both to a larger net shear for most individual sources and a larger tangential shear about the lens centers.
-
•
Multiple weak deflections give rise to correlated image ellipticities (i.e., “cosmic shear” due to power on highly non–linear scales).
-
•
On angular scales , galaxy–galaxy lensing alone accounts for a substantial amount of the cosmic shear signal expected in CDM and open CDM models. The magnitude of the signal is, however, very sensitive to the characteristic halo mass and, hence, accurate comparisons of observations of cosmic shear and theory on such scales rely heavily on the ability of simulations to follow the growth of the non–linear power spectrum with high accuracy.
Acknowledgements.
It is a great pleasure to thank Yannick and Georges for the invitation to come to the beautiful city of Lausanne, and for their tremendous efforts to insure that the Symposium was a true success. Support under NSF contract AST-0098572 is gratefully acknowledged.References
- [] Baugh, C. M. & Efstathiou, G. 1993, MNRAS, 265, 145.
- [] Blandford, R. D., Saust, A. B., Brainerd, T. G., & Villumsen, J. V. 1991, MNRAS, 251, 600.
- [] Brainerd, T. G., Blandford, R. D., & Smail, I 1996a, in: Kochanek, C. & Hewitt, J. (eds.), Astrophysical Applications of Gravitational Lensing. proceedings of IAU Symposium 173 (Dordrecht: Springer), 83.
- [] Brainerd, T. G., Blandford, R. D., & Smail, I. 1996b, ApJ, 466, 623. (BBS)
- [] Cohen, J. 2002, ApJ, 567, 672.
- [] Cohen, J., Hogg, D. W., Blandford, R., Cowie, L. L., Hu, E., Songaila, A., Shopbell, P., & Richberg, K. 2000, ApJ, 538, 29.
- [] Fischer, P. et al. (the SDSS collaboration) 2000, AJ, 120, 1198.
- [] Hämmerle, H., Miralles, J.–M., Schneider, P., Erben, T., Fosbury, R. A., Freudling, W., Pirzkal, H., Jain, B., & White, S. D. M 2002, AA, 388, 68.
- [] Hoekstra, H. 2004, these proceedings.
- [] Hoekstra, H., Yee, H. K. C., & Gladders, M. D. 2004, ApJ, 606, 67.
- [] Hogg, D. W., Pahre, M. A., Adelberger, K. L., Blandford, R., Cohen, J. G., Gautier, T. N., Jarrett, T., Neugebauer, G., & Steidel, C. C. 2000, ApJS, 127, 1.
- [] Jain, B., Seljak, U., & White, S. D. M. 2000, ApJ, 530, 547.
- [] LeFèvre, O., Hudon, D., Lilly, S.J., Crampton, D., Hammer, F., & Tresse, L. 1996, ApJ, 461, 534.
- [] LeFèvre, O., Vettolani, G., Paltani, S., Tresse, L., Zamorani, G., Le Brun, V., & Moreau, C. 2004, AA submitted, astro–ph/0403628.
- [] McKay, T. et al. (the SDSS collaboration) 2001, ApJ submitted, astro–ph/0108013.
- [] Kleinheinrich, M. 2004, these proceedings.
- [] Kleinheinrich, M., Schneider, S., Erben, T., Schirmer, M., Rix, H.–W., Meisenheimer, K., & Wolf, C. 2003, in proceedings of Aussois meeting on “Gravitational Lensing: A Unique Tool for Cosmology”, astro–ph/0304208.
- [] Natarajan, P., Kneib, J.–P., & Smail, I. 2002, ApJ, 580, L17.
- [] Seljak, U. 2004, these proceedings.
- [] Valageas, P., Barber, A. J., & Munshi, D. 2004, MNRAS, 347, 654.
- [] Vale, C. & White, M. 2003, ApJ, 592, 699.
- [] White, S. D. M. 2004, these proceedings.