Anisotropic inverse Compton emission in the radio galaxy 3C 265
Abstract
We present the results from a Chandra observation of the powerful radio galaxy 3C 265. We detect X–ray emission from the nucleus, the radio hotspots and lobes. In particular, the lobe X–ray emission is well explained as anisotropic inverse Compton scattering of the nuclear photons by the relativistic electrons in the radio lobes; the comparison between radio synchrotron and IC emission yields a magnetic field strength a factor lower than that calculated under minimum energy conditions. The X–ray spectrum of the nucleus is consistent with that of a powerful, strongly absorbed quasar and the X–ray emission of the south-eastern hotspot can be successfully reproduced by a combination of synchro-self Compton and inverse Compton emission assuming a magnetic field slightly lower than equipartition.
keywords:
Radiation mechanisms: non-thermal – Galaxies: active – Galaxies: individual: 3C 265 – Radio continuum: galaxies – X-rays: galaxies1 Introduction
The number of powerful radio galaxies (FR IIs) and quasars with detected non–thermal X–ray emission from the radio lobes and hotspots has steadily increased since the launch of the Chandra X–ray observatory.
Compact X–ray emission from the hotspots is mainly accounted for by the synchro–self Compton (SSC) mechanism under approximate equipartition conditions, although a synchrotron component may be present in some cases (Hardcastle et al. 2004 and ref. therein). On the other hand, extended X-ray emission from the lobes is produced by the inverse Compton (IC) scattering off the Cosmic Microwave Background (CMB) photons and far-IR/optical photons from the nuclear source. The IC emission with the CMB is sampling relativistic electrons with Lorentz factor , synchrotron emitting at radio wavelengths in the typical magnetic field of the lobes, while the IC emission off the nuclear far-IR/optical photons is powered by electrons, whose synchrotron emission falls in the undetected hundred kHz range. Thus, the detection of diffuse X-rays from the IC scattering of the nuclear photons provides a unique tool to extend our knowledge of the electron spectrum down to lower energies and to constrain the physical parameters of the radio lobes [Brunetti, Setti & Comastri 1997]. Since the IC scattering of nuclear photons is anisotropic, the far lobe of a symmetric double lobed radio galaxy, inclined with respect to the plane of the sky, should appear more X–ray luminous than the near one (Brunetti et al. 1997; Brunetti 2000). Confirmations of this mechanism have come from the Chandra observations of a number of radio sources (e.g., Brunetti et al., 2001,2002; Sambruna et al., 2002; Carilli 2003).
3C 265 (z=0.811) is one of the most luminous radio galaxies in the 3CR sample with two prominent radio lobes extending for about 80 arcsec [Fernini et al. 1993]. Optical and infrared observations suggest the presence of a powerful quasar hidden in the nucleus. By a detailed analysis of the spectral energy distribution and optical polarisation, di Serego et al. (1996) have derived an apparent de–absorbed magnitude for the central quasar which corresponds to a bolometric isotropic luminosity in the range erg s-1, depending on the bolometric correction assumed [Elvis et al. 1994]. This high bolometric luminosity is consistent with the prominent IR bump emission recently measured by ISOCAM (erg s-1, Siebenmorgen et al. 2004 ). The visual extinction toward the nucleus derived from these infrared observations is extremely high: and cm-2 if Galactic conversion values are assumed.
We observed the radio galaxy 3C 265 with the Chandra X–ray observatory to directly test the presence of a very powerful quasar in the nucleus and of the nuclear photons’ IC scattering scenario outlined above. Throughout this paper we assume km s-1 Mpc-1 and , so that 1 arcsec corresponds to 5.9 kpc projected at the source.
2 Radio And X–ray data
2.1 VLA observations
The radio galaxy 3C 265 has been extensively observed with the Very Large Array (VLA) in the frequency range GHz at various angular resolutions. High quality images of 3C 265 have been published by Fernini et al. (1993), whilst our goal is to obtain multifrequency images at the same resolution in order to perform a spectral analysis of the source’s components. For this reason we have reduced and combined VLA archive data sets taken with different configurations at four frequencies (1.4, 4.9, 8.4, and 15 GHz, project codes AF186, AL124, AL200, AM224 and AV153). The data reduction was carried out in the standard way by means of the NRAO Astronomical Image Processing System (AIPS). For the spectral analysis we obtained two data sets of images: the lower resolution one (circular beam of 4 arcsec) includes all the 4 frequencies and has been used to derive the spectral index of the extended lobe emission, the higher resolution set (circular beam 1.3 arcsec) has only 1.4, 4.9 and 8.4 GHz images and has been used to derive the spectral index of the compact components.
3C 265 has a typical FR II radio morphology: a weak core, two extended lobes (total extension of about 500 kpc) and bright hotspots at the leading edge of the lobes. The north-western (NW) lobe contains two bright regions labelled as C and A by Fernini et al. (1993) and both identified as hotspots. The south-eastern (SE) hotspot (labelled E) is the brightest component.
Figure 1 shows the 4.9 GHz image of 3C 265 with a resolution of 1.3 arcsec obtained by combining the A and B configuration data sets. The off-source rms is 0.022 mJy/beam and together with the components already identified by Fernini we detect, for the first time, a faint linear feature west of the nucleus that we identify with the main jet.

2.2 Chandra observations
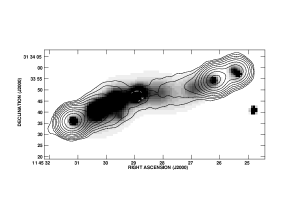
The target was placed at about from the nominal aimpoint of the back illuminated ACIS S3 chip onboard Chandra and observed, in Very Faint mode, on 2002 April 24th. The raw level 1 data were re–processed using the latest version 3.0 of the CXCDS CIAO software and filtered using a standard grade selection. The time intervals corresponding to a background level higher than the average count rate were filtered out leaving about 47.9 ksec of useful data. The smoothed full band (0.5–7 keV) X–ray image is reported in Figure 2. The radio contours obtained from the low resolution 4.9 GHz radio image are also overplotted. The Chandra position has been found to be offset by approximately 0.40 arcsec in R.A. and 0.13 arcsec in declination, consistently with known Chandra astrometric uncertainties.
A visual inspection of the X–ray image shows several features: a relatively bright pointlike source coincident with the radio nucleus, enhanced diffuse emission in the direction of the south-eastern lobe, weaker diffuse emission on the north-western side of the core, and three X–ray knots spatially coincident with the radio hotspots.
3 Results
In this Section we present the combined results from radio and X–ray observations and the modelling of the observed non–thermal emission. We adopt a simple scenario in which the emitting electrons are injected in the hotspots’ regions and simply age due to synchrotron and IC losses in the lobes. In both hotspots and lobes we thus adopt an electron spectrum which is a power law with injection energy index which steepens beyond a break energy () up to a high energy cutoff . Throughout the paper, errors are reported at the 90% confidence interval for one interesting parameter.
3.1 The nuclear source
The radio core is relatively weak (2.7 mJy at 4.9 GHz) with a spectral index () between 1.4 and 4.9 GHz and between 4.9 and 8.4 GHz.

The nuclear X–ray spectrum has been extracted by the cleaned events considering a radius of 1.5 arcsec (enclosing about 90% of the PSF) centered on the maximum of the X–ray counts distribution. The background spectrum was averaged over several nearby relatively large regions to minimize small scale fluctuations. Appropriate response and effective area functions were generated using standard tools. The spectrum has been grouped with a minimum of 20 counts per bin and fitted with the latest version (11.3.0) of XSPEC.
The broad band (0.5–6 keV) spectrum is relatively complex and best fitted with an absorbed power law plus an unabsorbed power law component at low energies (Figure 3). The 1 keV normalization of the soft component is about 5% of the primary one.
The absorption is intrinsic to the source and relatively high (N), consistent with the visual extinction derived by Siebenmorgen et al. (2004) . The power law component has a photon index . The unabsorbed 0.5–7 keV X–ray flux is 2.5 erg cm-2 s-1. The intrinsic X–ray luminosity over the broad 0.1–10 keV band of the hidden nucleus is about 5 erg s-1 (with a maximum value of about a few erg s-1 at the 90% confidence level for ). A narrow iron line at 6.4 keV is clearly detected in the X-ray spectrum of the core, even if the counting statistic at high energy is not such to allow a detailed analysis of the line properties. Fixing the rest–frame energy at 6.4 keV and the line width at the instrumental resolution the rest frame equivalent width is 490340 eV.
The observed high column density, the iron line and the intrinsic core luminosity are a direct and unambiguous signature of the presence of a powerful hidden quasar obscured by a dense, dusty torus in the nucleus of 3C 265.
3.2 The lobes
The low resolution (4 arcsec) radio images clearly trace the extended emission of the lobes from the hotspots back to the nucleus. The low frequency (178–750 MHz) spectral index of the source is . The SE lobe shows a steepening of the spectral index: (1.4 – 4.9 GHz) and (8.4 – 14.9 GHz). The flux density ratio between the SE and NW lobes derived at 1.4 GHz is .
Extended emission in the X–ray image is clearly detected on both side of the nucleus of 3C 265. The X–ray emission is cospatial with the radio lobes thus strongly pointing to a non-thermal origin. The X–ray distribution is clearly asymmetric, with the X–ray SE lobe brighter than the NW one. This asymmetry, combined with the presence of a faint radio jet in the NW lobe, suggests that most of the extended X–rays may be due to the IC scattering of the nuclear photons. Source spectra have been extracted using appropriate response and effective area functions. The instrument response has been also corrected for the degradation in the ACIS quantum efficiency using the latest version of the ACISABS tool. Integrating over the whole source area and subtracting the contribution from the core and hotspots, we derive net counts (0.5-2 keV band) for the total extended emission of which 140 are due to the SE lobe. The 0.5–2 keV fluxes are erg cm-2 s-1 and erg cm-2 s-1 for the SE and NW lobes, respectively, so that the flux ratio is , roughly the same as the brightness ratio. The total extended emission can be fitted with a power law with (plus Galactic absorption) which is consistent, within the errors, with the radio synchrotron spectrum. The 0.5-2 keV flux of erg cm-2 s-1 corresponds to a rest-frame luminosity of erg s-1. The IC scattering off the nuclear photons would roughly outweigh that of the CMB photons at angular distances (in arcsecond) from the nucleus :
| (1) |
where is the (isotropic) nuclear luminosity in units of erg s-1 in the far-IR to optical band and with the angle between the radio axis and the plane of the sky (negative for the near lobe). With being about half of the bolometric luminosity erg s-1 derived by di Serego et al. (1996), and , it is found that the major contributor to the X–ray extended emission of the far lobe is the anisotropic IC with the far-IR/optical photons from the central quasar (Eq.1), as indeed suggested by the asymmetric X–ray brightness distribution. The faintness of the radio jet and the absence of depolarization asymmetry in the lobes [Fernini 2001] are strong indicators that the radio source axis must lie almost on the plane of the sky justifying the range of adopted.

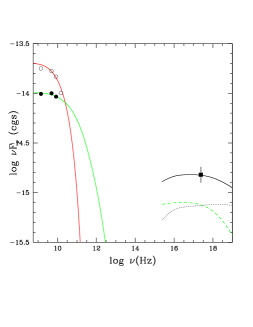
We calculate the X–ray emission from the radio lobes by combining the contribution from the anisotropic IC scattering of the nuclear photons and that of the isotropic scattering of the CMB photons. The anisotropic scattering is computed by integrating the Brunetti (2000) equations with and , so that the results are insensitive to , and . We also assume that the nuclear photons are isotropically emitted within a cone, of half opening angle or , with the axis coincident with the radio axis. Finally, in our calculations the spatial distribution of the emitting electrons is modelled with two half-ellipsoid volumes, whose semiaxis are arcsec and arcsec for the SE and NW lobe respectively. The volume averaged equipartition magnetic field in the lobes, as derived from the 178 MHz radio flux by making use of minimum energy formulae with a low energy cut–off (e.g., Brunetti et al. 1997), is about 46 G.
As can be seen in Figure 4 we find that, under equipartition conditions (), the predicted IC luminosity is about a factor of 4 lower than the observed one (for ). To account for this difference the average field intensity () should be a factor lower than the equipartition value (). A moderate departure from equipartition conditions is consistent with a number of recent Chandra and XMM findings (e.g. Brunetti et al. 2002; Hardcastle et al. 2002; Comastri et al. 2003; Grandi et al. 2003; Isobe et al. 2002). Given the above assumptions, we derive the IC X–ray flux ratio of the two lobes as a function of for different quasar luminosities and cone apertures (Figure 5). The predicted flux asymmetry is found to be in the range , for , in very good agreement with the observations, provided that the far lobe is the SE one (we stress that this ratio is independent on the assumed magnetic field intensity in the lobes). In principle the observed X-ray asymmetry can also be reproduced via the IC scattering of CMB photons by assuming an ad hoc asymmetry in the energetics of the two radio lobes, such that and (corresponding to an energy ratio between electrons and field of and ) are required for the SE and NW lobes, respectively. The fact that this ad hoc model requires an energetics times larger than the anisotropic IC model, the detection of the faint radio jet in the NW lobe (indicating that the SE lobe is further away from us in agreement with the geometry required by the anisotropic IC model) and the morphology of the X-ray emission (stronger in the innermost regions of the SE lobe and not strictly correlated with the radio brightness) allow us to consider the anisotropic IC model a more realistic interpretation.

3.3 The south-eastern hotspot
At the highest resolution (0.35 arcsec, Fernini et al. 1993) the SE hotspot is clearly elongated transversely to the radio axis, a possible indication of a bow shock–like structure or of the presence of multiple sub-components. Using the 1.3 arcsecond resolution maps we have performed a radio spectral analysis of the hotspot region coincident with the X–ray emission deriving between 1.4 and 4.9 GHz and between 4.9 and 8.4 GHz. A reasonable fit to the radio hotspot consists of two gaussian components: a compact region (FWHM arcsec) and a more extended component (FWHM arcsec) responsible for the elongated shape of the hotspot in the higher resolution radio images.
The SE hotspot is clearly detected in the Chandra image with net counts. The peak of the X–ray emission is within 0.1 arcsec from the radio peak, although no distinction can be made between the two radio components; the 0.5-2 keV flux is erg cm-2 s-1. X–ray emission is also detected from both hotspots A & C in the NW lobe but, due to the limited statistics, here we focus on the SE hotspot only.
Due to the structure of the hotspot we consider 3 contributions to the predicted X–ray emission:
-
•
SSC emission from the most compact region (FWHM arcsec) in the hotspot;
-
•
IC emission produced by scattering of the electrons of the compact region with the synchrotron photons from the more extended hotspot region (FWHM arcsec);
-
•
IC emission with the CMB photons from both the compact and extended hotspot components;
In modelling the inverse Compton emission we follow Brunetti et al. (2002) , assuming , Hz, Hz and . We note that the results are insensitive to the choice of and . The comparison between the model predictions and data is reported in Figure 6. The radio data show both the total hotspot spectrum, derived from the low resolution images, and the compact component. The IC spectra have been calculated assuming a magnetic field of 70 G and 90 G in the extended and compact component respectively. These values are a factor 1.7 lower than the equipartition magnetic fields derived in these regions ( G in the compact region and G in the more extended component). Although more complex modelling is adopted here, the results are consistent with an independent estimate of the SSC emission from the hotspot recently made by Hardcastle et al. (2004).
4 Summary
We have presented the results from a relatively deep Chandra observation of the powerful radio galaxy 3C 265, supported by complementary radio data. Evidence of a powerful quasar hidden in the nucleus of this radio galaxy has been previously gathered by optical spectro–polarimetry and infrared observations .
The combination of a very powerful nucleus and of a prominent radio structure with strong synchrotron emission allow us to test the mechanism of IC scattering with the nuclear photons.
The main results of our analysis can be summarized as follows:
-
1.
A powerful, strongly absorbed (N) X–ray nucleus is detected; the de-absorbed power law photon spectrum () and luminosity (about 5 erg s-1) are consistent with those of a powerful quasar as conjectured by previous indirect measurements in other bands.
-
2.
Extended X–ray emission is clearly detected in the Chandra image with total rest frame luminosity of erg s-1. This emission is nicely cospatial with the radio lobes and its power law spectrum () consistent with that of the radio synchrotron emission, strongly indicating a non–thermal (IC) origin. The lobes emission is asymmetric, the NW lobe being relatively fainter.
-
3.
The extended emission is mostly contributed by the anisotropic IC scattering of the far-IR/optical photons from the powerful central quasar. A clear signature of this process comes from the detected asymmetric X–ray emission of the lobes, implying that the the radio source axis is inclined by an angle with respect to the plane of the sky, the fainter NW lobe being nearer to us. This is confirmed by our detection of a one-sided radio jet pointing in the direction of the NW lobe.
-
4.
By a detailed modelling of the anisotropic IC scattering we are able to reproduce all the observed properties of the extended emission with and a half opening angle of the quasar radiation cone –, under the assumption that the average magnetic field intensity is a factor lower than the equipartition value.
-
5.
The SE hotspot, showing a somewhat complex radio structure, is clearly detected by Chandra. Its X–ray emission can be accounted for by a contribution of the compact component, via the SSC mechanism and the IC scattering off the synchrotron photons from the more extended radio component, plus a contribution from the IC scattering off the CMB photons of both components, under the assumption of an average magnetic field strength a factor 1.7 lower than the equipartition value.
Acknowledgments
We thank the referee, Martin Hardacastle, whose helpful comments have improved the paper. This research has made use of the NASA/IPAC Extragalactic Database (NED) which is operated by the Jet Propulsion Laboratory, California Institute of Technology, under contract with the National Aeronautics and Space Administration. The authors acknowledge partial support by the ASI contract I/R//057/02 and the MIUR grants Cofin 03-02-7534 and 03-02-23.
References
- [Brunetti 2000] Brunetti G., 2000, APh, 13, 105
- [Brunetti, Setti & Comastri 1997] Brunetti G., Setti G., Comastri A., 1997, A&A, 325, 898
- [Brunetti et al. 2001] Brunetti G., Cappi M., Setti G., Feretti L., Harris D.E., 2001, A&A, 372, 755
- [Brunetti et al. 2002] Brunetti G., Bondi M., Comastri A., Setti G., 2002, A&A, 381, 795
- [Carilli 2003] Carilli C.L., 2003, NewAR, 47, 231
- [Comastri et al. 2003] Comastri A., Brunetti G., Dallacasa D., Bondi M., Pedani M., Setti G., 2003, MNRAS, 340, L52
- [di Serego Alighieri et al. 1996] di Serego Alighieri S., Cimatti A., Fosbury R.A.E., Perez-Fournon I., 1996, MNRAS, 279, L57
- [Elvis et al. 1994] Elvis M. et al., 1994, ApJS, 95, 1
- [Fernini 2001] Fernini I., 2001, AJ, 122, 83
- [Fernini et al. 1993] Fernini I., Burns J.O., Bridle A.H., Perley R.A., 1993, AJ, 105, 1690
- [Grandi et al. 2003] Grandi P., Guainazzi M., Maraschi L., Morganti R., Fusco-Femiano R., Fiocchi M., Ballo L., Tavecchio F., 2003, ApJ, 586, 123
- [Hardcastle et al. 2002] Hardcastle M.J., Birkinshaw M., Cameron R.A., Harris D.E., Looney L.W., Worral D.M., 2002, ApJ, 581, 948
- [Hardcastle et al. 2004] Hardcastle M.J., Harris D.E., Worral D.M., Birkinshaw M., 2004, ApJ, in press, astro-ph/0405516
- [Isobe et al. 2002] Isobe N., Tashiro M., Makishima K., Iyomoto N., Suzuki M., Murakami M. M., Mori M., Abe K., 2002, ApJ, 580, L111
- [Sambruna et al. 2002] Sambruna R.M., Maraschi L., Tavecchio F., Urry C.M., Cheung C.C., Chartas G., Scarpa R., Gambill J.K., 2002, ApJ, 571, 206
- [Siebenmorgen et al. 2004] Siebenmorgen R., Freudling W., Krügel E., Haas M., 2004, A&A, 421, 129