Nebular and stellar properties of a metal poor HII galaxy at 3.36.
Abstract
We have characterized the physical properties (electron temperature, density, metallicity) of the ionized gas and the ionizing population (age, metallicity, presence of WR stars) in the Lynx arc, a HII galaxy at 3.36. The UV doublets (CIII], SiIII] and NIV) imply the existence of a density gradient in this object, with a high density region (0.1-1.0 105 cm-3) and a lower density region (3200 cm-3). The temperature sensitive ratio [OIII]1661,1666/5007 implies an electron temperature =17300 K, in agreement within the errors with photoionization model predictions. Nebular abundance determination using standard techniques and the results from photoionization models imply a nebular metallicity of O/H103% (O/H)⊙, in good agreement with Fosbury et al (2003). Both methods suggest that nitrogen is overabundant relative to other elements, with [N/O]2.0-3.0 [N/O]⊙. We do not find evidence for Si overabundance, as Fosbury et al. (2003).
Photoionization models imply that the ionizing stellar population in the Lynx arc has an age of 5 Myr. If He+ is ionized by WR stars, then the ionizing stars in the Lynx arc have metallicities Zstar5% Z⊙ and ages 2.8-3.4 Myr (depending on Zstar), when WR stars appear and are responsible for the He+2 emission. However, alternative excitation mechanisms for this species are not discarded. Since the emission lines trace the properties of the present burst only, nothing can be said about the possible presence of an underlying old stellar population.
The Lynx arc is a low metallicity HII galaxy that is undergoing a burst of star formation of 5 Myr age. One possible scenario that explains the emission line spectrum of the Lynx arc, the large strength of the nitrogen lines and the He+2 emission is that the object has experienced a merger event that has triggered a burst of star formation. WR stars have formed that contribute to a fast enrichment of the ISM.
As Fosbury et al. (2003), we find a factor of 10 discrepancy between the mass of the instantaneous burst required to power the luminosity of the H line and the mass implied by the continuum level measured for the Lynx arc. We discuss several possible solutions to this problem. The most likely explanation is that gas and stars have different spatial distributions so that the emission lines and the stellar continuum suffer different gravitational amplification by the intervening cluster.
keywords:
cosmology:observations – galaxies: abundances – galaxies: high redshift – HII regions – stars: formation1 Introduction
H II galaxies are dwarf emission-line galaxies undergoing a burst of star formation. They are characterized by strong and narrow emission lines originated in a giant star-forming region which dominate their observable properties at optical wavelengths (e.g. [Terlevich et al. 2004]). Most are blue compact galaxies (BCGs). They have very low metallicities, high rates of star formation and a very young stellar content. Many are compact and isolated. One of the reasons why these objects have attracted significant attention is the possibility that they are very young galaxies in the process of formation. This possibility, however, has been challenged since evidence for an old (several Gyr) stellar population has been found in numerous BCGs (see [Kunth & Östlin 2000] for a review). Therefore, a model with a single, instantaneous burst of star formation does not seem appropriate to describe these galaxies and a succession of short starbursts separated by quiescent periods seems more likely ([Terlevich et al. 2004]).
Even in the case if HII galaxies are not primeval, little chemical evolution has happened and they provide important information about how galaxies form and evolve, as well as about the process of star formation in low metallicity environments.
The most distant HII galaxy in the catalogue compiled by Terlevich et al. (1991) is at redshift 0.31, while the vast majority are at 0.1. The proximity of these galaxies allows studies of their structure, metal content and stellar population with high sensitivity and precision, difficult to achieve for high redshift star forming galaxies. Still, finding high redshift HII galaxies is of great interest to investigate their abundance patterns and stellar properties at earlier epochs, compare them with the nearby counterparts and obtain further information about the formation and evolution of galaxies using objects that have undergone little chemical evolution.
The Lynx arc is a star forming object at z3.36. It was discovered during spectroscopic follow-up of the cluster RXJ 0848+4456 (z=0.57) from the Deep Cluster Survey ([Holden et al. 2001]). The arc shows a very red R-K color and very strong optical and UV (rest frame) narrow emission lines. From the analysis of HST WFPC2 images and Keck optical and near infrared spectroscopy, Fosbury et al. (2003, FOSB03 hereafter) concluded that the arc is an HII galaxy magnified by a factor of 10 by a complex intervening cluster environment. The authors concluded that the continuum is mostly nebular.
By means of photoionization modeling, [FOSB03] showed that the spectroscopic properties of the Lynx arc are all consistent with a simple HII region model of a cluster of 106 massive stars, characterized by a very high T80 000 K, a high ionizing parameter (U0.1) and low nebular metallicity Z 5% Z⊙. Indirect arguments suggest that the ionizing stellar population could have much lower abundances. Using simple photoionizaton models, the authors conclude that the spectroscopic properties of the Lynx arc are consistent with those of a metal-poor nebula ionized by a cluster of primordial (i.e. metal-free) stars. In this scenario, the overabundance of Si implied by the models is explained as due to enrichment by past pair-instability supernovae, requiring stars more massive than 120 M⊙.
We investigate in this paper the possibility that normal (i.e. non primordial) stars are responsible for the excitation of the gas in the Lynx arc. Our first goal is to constrain the physical properties of the gas: electron temperature, density, metallicity. We will first use standard spectroscopic techniques of nebular analysis (e.g. [Aller 1984]). These results will be compared with those from detailed photoionization modeling and those obtained by [FOSB03].
The second goal is to characterize the ionizing stellar population: age, metallicity, stellar mass of the burst, possible presence of WR stars. This will be achieved by means of detailed photoionization models, whose objective is to find an ionizing stellar population able to explain all the spectroscopic properties of the Lynx arc (line ratios, equivalent widths, intensity of the continuum). In addition, such models set tight constrains on the nebular properties, which must be consistent with the results from the standard techniques mentioned above.
We present in §2 the results of the nebular analysis and the photoionization models. These results will be discussed in §3. Summary and conclusions are presented in §4.
2 Analysis
2.1 Nebular properties
In this section we will set constrains on the electron temperature, density and the nebular abundances of the ionized gas in the Lynx arc.
All the analysis and discussion presented below are based on spectra obtained with different slit widths and orientations (see [FOSB03] for a detailed description of the data set and reduction techniques). For this reason, [FOSB03] estimated carefully scaling factors that were applied in order to derive a consistent calibration. We will therefore assume that the errors introduced by calibration uncertainties are negligible.
The results are also dependent on whether reddening is present or not. We have ignored this effect. The very strong UV lines and the lack of evidence for dust reddening from the photoionization models and the fit to the continuum shape ([FOSB03]) makes as confident that such assumption is reasonable and our results are not seriously affected by it. Our own work presented in this paper will show that the line ratios are consistent with no dust reddening.
2.1.1 Electron temperature
The [OIII]4363/[OIII]5007 ratio has been traditionally used to measure electron temperatures in ionized nebulae. Unfortunately, the [OIII]4363 line is outside the observed spectral range. We have used the UV [OIII] doublet instead, since the [OIII]1661,1666/[OIII]5007 ratio is mostly sensitive to electron temperature.
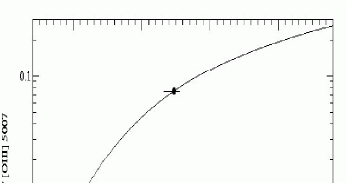
We show in Fig.1 the dependence of the [OIII]1661,1666/[OIII]5007 ratio with electron temperature The position of the Lynx arc (the value of the ratio is 0.0740.005, see Table 1) is also shown as a filled circle. It implies 17300 K. This value is somewhat higher than that predicted by the photoionization models presented in 2.2 which give 16200500 K, although taking errors into account, the discrepancy is not important. This further supports that dust reddening effects are negligible, otherwise, the temperature derived from Fig. 1 would be a lower limit and large discrepancies with the photoionization model predictions would arise. This temperature is much lower than that derived by [FOSB03] and [Binette et al. (2003)] by means of photoionization modeling (20000 K). The discrepancy is due to a combination of the very hard ionizing continuum (very energetic electrons are therefore released in the ionization processes) and high (ionization parameter) value used by these authors.
2.1.2 Electron density
There are three UV line doublets we can use to estimate the electron density in the Lynx arc: CIII]1907,1909, SiIII]1883,1892 and NIV1483,1487 (see [Keenan, Feibleman & Berrington 1992], [Keenan et al. 1995]). The results shown in Table 1 correspond to T10000-20000 K range, where the ratios are quite insensitive to temperature. The upper limits take the errors into account (i.e. the densities shown correspond to the minimum possible value of the line ratio).
The SiIII] doublet density determination has to be considered carefully. We have noticed that the predictions by Keenan, Feibleman & Berrington (1992, see Fig.2) are actually inconsistent with the results of our photoionization models (§2.3). As an example, for some of the =1000 cm-3 models presented in §2.3, SiIII]1883/1892=1.8, which is above the maximum possible value (1.5) predicted by those authors for this ratio. For models with =10 cm-3, we find that the ratio reaches a value of 2 in some cases. We also find that the ratio varies for a fixed density (between 1.45 and 1.8 for =1000 cm-3), depending on other parameters such as the spectral energy distribution (SED) properties.
| Ratio | Lynx | |
| cm-3 | ||
| CIII] | 1.450.06 | 3200 |
| SiIII] | 1.50.1 | 2000 |
| NIV | 0.70.1 | 2104 |
The range of densities implied by the different doublets suggests that there is a gradient in the Lynx arc. The highly ionized region responsible for the emission of the N+3 lines has [0.1-1.0]105 cm-3. The C+3 lines (1549,1551 Å) are also emitted within this region. There is a zone of lower ionization level, where the C+2, Si+2 and N+2 lines are emitted and which has 3200 cm-3.
Usually, the optical estimates of electron densities of H II regions, based on forbidden emission line ratios, are in the range 100 to 1500 cm-3. However, radio techniques have revealed the existence in the Galaxy of very small and dense (104-105 cm-3) objects, the so-called compact or ultracompact HII regions (e.g. [Habing & Israel 1979]).
Density gradients in several giant and galactic HII regions have been observed (e.g. [Copetti et al. 2000]). In most of these cases, the spatial variation of density may be interpreted as a radial gradient with the density decreasing from the centre to the edges. A good example is the Orion nebula. Based on measurements of the ratio [O II]3729/3726, Osterbrock & Flather (1959) showed the existence of a steep radial density gradient in the Orion Nebula, with the electron density decreasing from 1.8104 cm-3 in the centre to 2.6102 cm-3 near the edge.
2.1.3 Nebular abundances
Photoionization models by [FOSB03] imply that the nebular abundances in the Lynx arc are 5% solar within a factor of 2. We set here tighter constraints by means of using standard techniques of nebular abundance determination.
The following expressions were used to calculate the ionic abundances of several elements (Aller 1984), assuming the low density regime. These expressions will then be used to calculate total element abundances.
or, alternatively
where =/104 and
For silicon we have used the expression:
(from [Garnett et al. 1995])
Garnett et al. (1995) showed that this expression is a good approximations within the temperature range 10000-20000 K and for the values expected for the Lynx arc, well below the critical densities of all the lines considered above.
The total element abundances are then calculated as follows:
In both cases, we assume that most oxygen and neon atoms are twice ionized and therefore the ion abundance ratio is a good representation of the element abundance ratio. This assumption is supported by the high level of ionization of the gas implied by the high [OIII]/H and [OIII]/[OII] ratios of the Lynx arc. It is also confirmed by our photoionization models (see §2.2) which show that 99% of O and Ne are in the O+2 and Ne+2 forms.
For the other elements we use:
(as Table 1 shows, the abundance of N+4 in negligible compared with that of N+3 and N+2)
We assume that the low ionization species N+, N0, C+ and C0 are not present, which is expected due to the high level of ionization of the gas. It is also confirmed by our photoionization models (see §2.2), that also predict negligible abundance for ionization species higher than the ones considered above.
To calculate the abundance of Si we need to account for the presence of different ions of this element using an ionization correction factor :
Garnet et al. (1995) predicted the values of ICFSi/C for different X(O+2) (see Fig. 1 in their paper). The scatter at large X(O+2)(0.99) values implies that ICFSi/C is in the range 2.5 - 5. Our photoionization models (§2.2) imply ICFSi/C in the range 3.2-3.4 (best models with no WR stars) and 2.3-2.9 (best models with WR stars). We therefore assume ICFSi/C in the range 3.4 - 2.3 (accounting for different stellar metallicities/ages).
The results of the calculations are shown in Table 2. Errors were calculated using the uncertainties on the line measurements presented in Table 3111Errors on line measurements provided by A. Humphrey, private communication. We have not added an error for CIV/H, since this value is determined by the uncertainties on the reconstruction model of the line profile, rather than the line flux measurements ([FOSB03]). The errors on the abundances relative to the Sun are less than few per cent. C and O solar abundance values come from photospheric abundances of Allende-Prieto, Lambert & Asplun (2002, 2001), while N, Ne, Mg, Si and Fe are from [Holweger (2001)]. Uncertainties on these values were not considered in the error calculation.
| Ion | Lynx | Lynx |
|---|---|---|
| =1.7 | t= | |
| O+2/H | (5.40.2)10-5 | (6.00.2)10-5 |
| O+2/H | (6.80.5)10-5 | (9.60.7)10-5 |
| N+4/H+ | 9.510-7 | 1.410-6 |
| N+3/H+ | (8.20.2)10-5 | (1.20.3)10-5 |
| N+2/H+ | (7.10.8)10-6 | (101)10-6 |
| C+3/H+ | 2.110-6 | 3.110-5 |
| C+2/H+ | (5.80.5)10-6 | (7.80.7)10-6 |
| Ne+3/H+ | (1.20.1)10-5 | (1.40.1)10-5 |
| Si+2/H+ | (1.50.4)10-6 | (2.10.5)10-6 |
| Element | Lynx | Lynx |
| =1.7 | t= | |
| O/O | 0.11 | 0.12 |
| O/O | 0.14 | 0.18 |
| C/C⊙ | 0.12 | 0.16 |
| N/N⊙ | 0.20 | 0.27 |
| Ne/Ne⊙ | 0.12 | 0.14 |
| Si/Si⊙ | 0.15-0.11(WR) | 0.21-0.14(WR) |
Calculations were done for two temperature values =16 000 and 17 000 K (=1.6 and 1.7) to account for the most likely range implied by the photoionization models (§2.2) and the [OIII] lines (§2.1.1). It is important to note that the electron temperature is different in high and low ionization zones of HII regions. To perform a more accurate abundance determination, this temperature variation should be taken into account. Most of the gas is ionized in the Lynx arc (99 % of oxygen in the O+2 form) and there is not a low ionization zone (i.e. a region where species such as [OI], [OII], [SII], etc exist). We expect therefore that the electron temperatures measured using the [OIII] lines can be safely assumed to be representative of a large fraction of the nebula. Somewhat higher temperatures might be present in the most highly ionized region. In such case, the abundances presented in Table 2, are upper limits 222The small discrepancy between the O/H values calculated with the [OIII]5007,4959 and OIII]1661,1666 values (see Table 2) could be due the fact that the excitation of the UV doublet requires somewhat higher electron temperatures than the optical doublet. .
We conclude that the nebular metallicity in the Lynx arc (defined as O/H) is in the range 10 - 20% Z⊙. This is somewhat higher than the value derived by [FOSB03] of 5% Z⊙.
In addition, we conclude that nitrogen is overabundant relative to oxygen by a factor of 2.0-3.0 compared with the solar abundance.
Departures from the constant density case may produce variations in the derived ICF values and therefore, the element abundances (Luridiana & Cerviño 2003, Luridiana et al. 2004, in prep.). This does not affect oxygen seriously. However, the derived abundance of nitrogen can be off by up to a factor of 1.75 for their models with the steepest power law density gradient (index 1.5). It is therefore possible, that N is not overabundant and the large derived N/O is a consequence of assuming constant density.
[FOSB03] concluded that silicon has to be well overabundant relative to other elements, to be able to explain the strong SiIII] lines detected in the Lynx arc. The reason for this discrepancy will be discussed in §2.2.
Photoionization models in §2.2 will set further constrains on the nebular abundances of all elements.
2.2 Age and metallicity of the ionizing stellar population
We have characterized the age and metallicity of the ionizing stellar population in the Lynx arc by means of producing photoionization models that best reproduce the emission line properties. Further constraints on the nebular physical properties and chemical abundances will also be set.
The most outstanding spectroscopic properties of the Lynx arc that models should reproduce are (see [FOSB03]):
-
•
The large strength of the UV collisionally excited lines (NIV1486, CIV1550, OIII]1663, NIII]1750, etc) relative to recombination lines such as H
-
•
The large [OIII]/H(=7.5) and the weakness of [OII]3727 relative to other lines ([OIII]/[OII] 30, [OII]/H0.25 and [NeIII]3869/[OII]2.8)). I.e., the high ionization level of the gas.
-
•
The strength of the He+2 emission (HeII1640/H=0.11)
-
•
The extremely weak UV and optical continuum
All the SEDs used in this paper were computed by Cerviño, Mas-Hesse & Kunth (2004, hereafter CMK04) available at http://www.laeff.esa.es/users/mcs/SED. The isocrones were computed following the prescriptions quoted in [Cerviño, Gómez-Flechoso & Castander (2001)] and the models assume a power law Initial Mass Function (IMF) with a Salpeter slope, =2.35 ([Salpeter 1955]) in the mass range 2–120 M⊙. We have adopted the evolutionary tracks with standard mass loss rates by [Schaller et al. (1992), Schaerer et al. (1993a), Schaerer et al. (1993b), Charbonnel et al. (1993)] and the following atmosphere models: [Schaerer & de Koter (1997)] CoStar for main-sequence hot stars more massive than 20 M⊙, [Schmutz, Leitherer & Gruenwald (1992)] for WR stars and [Kurucz (1991)] for the remaining stars. An instantaneous star formation law was assumed. We have also considered the influence of the X-ray emission of the starburst in the SED by varying the efficiency of conversion of kinetic energy into X-rays. However, we have found that this effect does not produce significant differences in the predicted emission line spectrum at the young ages considered here. Therefore, we have ignored it and we present only the results for SED models without X-ray emission.
We used the numerical code Cloudy ([Ferland et al. 1998]) to predict the line ratios in different circumstances.
Given the complete lack of information on the geometry of the gas and the relative distribution between stars and gas in the arc, we have assumed the standard spherical geometry often used in photoionization models of other extragalactic HII regions and HII galaxies. The distance between the ionizing source and the gas was assumed to be 10 pc and we used constant density =1000 cm-3. The filling factor was varied until finding the model that best reproduces the Lynx arc line ratios. Conclusions on the size and geometry of the ionized region cannot be extracted from our modeling since different values of , and might produce the same output spectrum. In addition, the assumption of spherical geometry is likely to be too simple, since the ionizing stars might be distributed in several clusters.
We adopt log = 55.20, as calculated by [FOSB03] from the H flux and corrected for magnification. is the ionizing luminosity in erg s-1. Since the authors assumed covering factor =1 in these calculations, we have also adopted this value.
We show in Tables 3 to 6 the results of the models that best reproduce the Lynx spectrum, together with the Lynx measurements. Although He+2 is a problem for some of these models, they are also shown because of the very good agreement with the rest of the line ratios. The He+2 problem will be discussed in more detail in §3.1. We find that the nebular metallicity Zneb that produces the best fit to the Lynx spectrum is 10% Z⊙. This is in very good agreement with the results obtained in §2.1.3.
Zneb=5% Z⊙ models are rejected. The models that can produce [OIII]5007/H7, require very high filling factor 0.32 (i.e. high ionization level). The predicted electron temperature is 20000 K, much higher than the value implied by the [OIII] lines (§2.1.1). In addition, due to the high and ionization level of the nebula, the high ionization UV lines such as CIV1550 and [OIII]1665 become too strong, with CIV/H.
The opposite effect is found for models with Z15% Z⊙, which can also be rejected with confidence. Due to the higher metallicity, lower filling factors (i.e. ionization level) are required to produce the same [OIII]5007/H. For those models with [OIII]5007/H7-8, the predicted is 14 000K, too low compared with the expected value (§2.1.1). In addition, because of the low ionization level and the low electron temperature, the high ionization UV collisionally excited lines become too weak, with CIV/H1.
Therefore, all the models presented here assume Zneb=10% Z⊙ for all elements (except nitrogen, see below). The most discrepant line ratios will always be shown in bold characters.
Zstars = 5% Z⊙ models
The results of these models are shown in Table 3. The 2 Myr() model assumes that all elements have an abundance of 10% the solar value. Notice that the NIII] and NIV lines are severely underestimated. This is the case for all models considered below, as long as N abundance is not enhanced. The discrepancy disappears if we assume that this element is overabundant by a factor of 3. This result was also suggested by the nebular abundance determination in §2.1.3. Hereafter, this overabundance will be assumed in all models.
Models with ages 4 Myr reproduce very well the Lynx line properties, except the He+2 emission. Ages of 5 Myr and specially older present strong discrepancies with the measured line ratios, due to the drastic reduction of the ionizing photons as stars get older. We only show 5 and a 6 Myr models in Table 3 for illustration.
The He+2 lines are always predicted too faint. The reason is that according to the stellar evolution models no WR stars are formed in such low metallicity environment (but see §3.1).
Zstars = 20% Z⊙ models
Models with ages 3 Myr are in very good agreement with the Lynx spectrum (Table 4), except for the He+2 lines which are predicted too faint. At 3.4 Myr Wolf Rayet stars make an important contribution to the the hard ionizing radiation and the He+2 problem is solved. NV should be detected according to this model. However, given the uncertainties on the estimation of the upper limit for this line, the predicted ratio is likely to be well within the errors ([FOSB03]) of the measured value. Ages of 4 Myr and older produce strong discrepancies with the measured spectrum. We show 4 and 5 Myr models in Table 4 for illustration.
Zstars = 40% Z⊙ models
Models with ages 3 Myr are in good agreement with the Lynx emission line spectrum, except for the He+2 lines which are predicted too weak (Table 5). Between 3.0 and 4 Myr, WR stars appear and the He+2 problem is solved. Ages of 4 Myr and older produce strong discrepancies with the measured spectrum. We show 4 and 5 Myr models in Table 5 for illustration.
Zstars = Z⊙ models
Models with ages 5 Myr can explain the Lynx emission line spectrum remarkably well, except the He+2 lines, which are predicted too weak. The appearance of WR stars at 2.8 Myr solves the He+2 problem and produces a good fit to the observed spectrum. Ages of 6 Myr and older produce strong discrepancies with the measured spectrum. We only show a 6 Myr model in Table 6 for illustration.
| Zstars /Z⊙ | Lynx | 5% | 5% | 5% | 5% | 5% | 5% | 5% |
|---|---|---|---|---|---|---|---|---|
| Agestars | 1 Myr | 2 Myra | 2 Myrb | 3 Myr | 4 Myr | 5 Myr | 6 Myr | |
| Zneb/Z⊙ | 10% | 10% | 10% | 10% | 10% | 10% | 10% | |
| N/N⊙ | 30% | 10% | 30% | 30% | 30% | 30% | 30% | |
| log() | -1.7 | -1.5 | -1.5 | -1.3 | -0.3 | 0.0 | 0.0 | |
| NV1240 | 0.09 | 0.01 | 0.01 | 0.01 | 0.03 | 0.01 | 0.13 | 0.27 |
| SIV1394 | 0.09 | 0.13 | 0.12 | 0.12 | 0.10 | 0.12 | 0.13 | 0.09 |
| SIV1402 | 0.09 | 0.06 | 0.06 | 0.06 | 0.06 | 0.06 | 0.10 | 0.07 |
| NIV]1486 | 0.420.05 | 0.52 | 0.18 | 0.52 | 0.47 | 0.52 | 0.28 | 0.06 |
| CIV1549 | 3.65 | 3.63 | 3.90 | 3.69 | 3.33 | 3.63 | 1.97 | 0.60 |
| HeII1640 | 0.110.03 | 0.008 | 0.008 | 0.008 | 0.004 | 0.005 | 0.012 | 0.023 |
| OIII]1665 | 0.560.04 | 0.52 | 0.54 | 0.52 | 0.46 | 0.52 | 0.37 | 0.17 |
| NIII]1750 | 0.180.02 | 0.17 | 0.05 | 0.17 | 0.13 | 0.17 | 0.17 | 0.13 |
| SiIII]1883 | 0.090.02 | 0.12 | 0.11 | 0.11 | 0.11 | 0.12 | 0.03 | 0.11 |
| SiIII]1892 | 0.060.02 | 0.07 | 0.05 | 0.07 | 0.07 | 0.07 | 0.02 | 0.08 |
| CIII]1909 | 0.590.06 | 0.94 | 0.88 | 0.91 | 0.74 | 0.99 | 0.84 | 0.84 |
| [OII]3727 | 0.25 | 0.08 | 0.08 | 0.08 | 0.06 | 0.08 | 0.03 | 0.43 |
| [NeIII]3869 | 0.690.06 | 0.62 | 0.63 | 0.62 | 0.59 | 0.62 | 0.58 | 0.37 |
| [NeIII]3968 | 0.22 | 0.19 | 0.19 | 0.19 | 0.18 | 0.19 | 0.17 | 0.11 |
| HeII 4686 | 0.015-0.025 | 0.0011 | 0.0011 | 0.0011 | 0.0006 | 0.0007 | 0.0016 | 0.0024 |
| [OIII]5007 | 7.500.3 | 8.25 | 8.36 | 8.28 | 7.97 | 8.25 | 7.8 | 5.43 |
| H | 1.00 | 1.00 | 1.00 | 1.00 | 1.00 | 1.00 | 1.00 | 1.00 |
| 1.73 | 1.64 | 1.64 | 1.65 | 1.59 | 1.64 | 1.48 | 1.31 |
| Zstars /Z⊙ | Lynx | 20% | 20% | 20% | 20% | 20% | 20% |
|---|---|---|---|---|---|---|---|
| Agestars | 1 Myr | 2 Myr | 3 Myr | 3.4 Myr | 4 Myr | 5 Myr | |
| Zneb/Z⊙ | 10% | 10% | 10% | 10% | 10% | 10% | |
| N/N⊙ | 10% | 30% | 30% | 30% | 30% | 30% | |
| log() | -1.7 | -1.5 | -0.5 | -1.5 | 0.0 | 0.0 | |
| NV1240 | 0.09 | 0.012 | 0.02 | 0.05 | 0.16 | 0.12 | 0.18 |
| SIV1394 | 0.09 | 0.14 | 0.12 | 0.09 | 0.11 | 0.08 | 0.07 |
| SIV1402 | 0.09 | 0.07 | 0.06 | 0.05 | 0.06 | 0.05 | 0.05 |
| NIV]1486 | 0.42 | 0.54 | 0.47 | 0.46 | 0.53 | 0.44 | 0.05 |
| CIV1549 | 3.65 | 3.79 | 3.25 | 3.25 | 3.61 | 3.16 | 0.55 |
| HeII1640 | 0.11 | 0.007 | 0.006 | 0.007 | 0.16 | 0.009 | 0.016 |
| OIII]1665 | 0.56 | 0.54 | 0.49 | 0.43 | 0.47 | 0.39 | 0.13 |
| NIII]1750 | 0.18 | 0.17 | 0.17 | 0.11 | 0.13 | 0.09 | 0.10 |
| SiIII]1883 | 0.09 | 0.11 | 0.12 | 0.04 | 0.11 | 0.03 | 0.13 |
| SiIII]1892 | 0.06 | 0.07 | 0.07 | 0.03 | 0.06 | 0.02 | 0.08 |
| CIII]1909 | 0.59 | 0.95 | 0.94 | 0.63 | 0.72 | 0.51 | 0.80 |
| [OII]3727 | 0.25 | 0.08 | 0.09 | 0.04 | 0.10 | 0.03 | 0.79 |
| [NeIII]3869 | 0.69 | 0.63 | 0.60 | 0.59 | 0.58 | 0.59 | 0.34 |
| [NeIII]3968 | 0.22 | 0.19 | 0.19 | 0.18 | 0.17 | 0.18 | 0.10 |
| HeII 4686 | 0.015-0.025 | 0.0011 | 0.0011 | 0.001 | 0.02 | 0.0012 | 0.0017 |
| [OIII]5007 | 7.50 | 8.24 | 7.98 | 7.98 | 7.60 | 8.01 | 4.92 |
| H | 1.00 | 1.00 | 1.00 | 1.00 | 1.00 | 1.00 | 1.00 |
| 1.73 | 1.67 | 1.62 | 1.56 | 1.62 | 1.50 | 1.28 | |
| WR |
| Zstars /Z⊙ | Lynx | 40% | 40% | 40% | 40% | 40% | 40% |
|---|---|---|---|---|---|---|---|
| Agestars | 1 Myr | 2 Myr | 3 Myr | 3.3 Myr | 4 Myr | 5 Myr | |
| Zneb/Z⊙ | 10% | 10% | 10% | 10% | 10% | 10% | |
| N/N⊙ | 10% | 30% | 30% | 30% | 30% | 30% | |
| log() | -1.7 | -1.3 | -1.3 | -1.0 | 0.0 | 0.0 | |
| NV1240 | 0.09 | 0.01 | 0.022 | 0.12 | 0.16 | 0.20 | 0.24 |
| SIV1394 | 0.09 | 0.12 | 0.11 | 0.11 | 0.09 | 0.06 | 0.08 |
| SIV1402 | 0.09 | 0.06 | 0.06 | 0.06 | 0.05 | 0.04 | 0.07 |
| NIV]1486 | 0.42 | 0.45 | 0.48 | 0.53 | 0.52 | 0.51 | 0.03 |
| CIV1549 | 3.65 | 3.13 | 3.34 | 3.69 | 3.69 | 3.77 | 0.50 |
| HeII1640 | 0.11 | 0.007 | 0.006 | 0.10 | 0.14 | 0.18 | 0.02 |
| OIII]1665 | 0.56 | 0.48 | 0.48 | 0.48 | 0.44 | 0.40 | 0.07 |
| NIII]1750 | 0.18 | 0.18 | 0.15 | 0.14 | 0.09 | 0.04 | 0.06 |
| SiIII]1883 | 0.09 | 0.13 | 0.10 | 0.09 | 0.06 | 0.018 | 0.19 |
| SiIII]1892 | 0.06 | 0.08 | 0.06 | 0.06 | 0.04 | 0.013 | 0.12 |
| CIII]1909 | 0.59 | 0.98 | 0.84 | 0.70 | 0.50 | 0.21 | 0.77 |
| [OII]3727 | 0.25 | 0.09 | 0.08 | 0.08 | 0.06 | 0.03 | 2.17 |
| [NeIII]3869 | 0.69 | 0.60 | 0.60 | 0.59 | 0.57 | 0.57 | 0.20 |
| [NeIII]3968 | 0.22 | 0.18 | 0.18 | 0.18 | 0.17 | 0.17 | 0.06 |
| HeII 4686 | 0.015-0.025 | 0.001 | 0.0008 | 0.012 | 0.017 | 0.022 | 0.002 |
| H | 1.00 | 1.00 | 1.00 | 1.00 | 1.00 | 1.00 | |
| [OIII]5007 | 7.50 | 7.95 | 7.97 | 7.85 | 7.59 | 7.8 | 3.01 |
| H | 1.00 | 1.00 | 1.00 | 1.00 | 1.00 | 1.00 | 1.00 |
| 1.73 | 1.62 | 1.61 | 1.62 | 1.59 | 1.52 | 1.20 | |
| WR | WR | WR |
| Zstars /Z⊙ | Lynx | 100% | 100% | 100% | 100% | 100% | 100% |
|---|---|---|---|---|---|---|---|
| Agestars | 1 Myr | 2 Myr | 2.8 Myr | 4 Myr | 5 Myr | 6 Myr | |
| Zneb/Z⊙ | 10% | 10% | 10% | 10% | 10% | 10% | |
| N/N⊙ | 10% | 30% | 30% | 30% | 30% | 30% | |
| log() | -1.3 | -0.5 | -1.3 | -1.3 | -0.7 | 0.0 | |
| NV1240 | 0.09 | 0.02 | 0.04 | 0.15 | 0.32 | 0.16 | 0.58 |
| SIV1394 | 0.09 | 0.12 | 0.09 | 0.10 | 0.10 | 0.10 | 0.16 |
| SIV1402 | 0.09 | 0.06 | 0.05 | 0.06 | 0.06 | 0.06 | 0.14 |
| NIV]1486 | 0.42 | 0.47 | 0.49 | 0.51 | 0.52 | 0.52 | 0.046 |
| CIV1549 | 3.65 | 3.26 | 3.48 | 3.57 | 3.73 | 3.9 | 0.79 |
| HeII1640 | 0.11 | 0.012 | 0.009 | 0.13 | 0.26 | 0.038 | 0.071 |
| OIII]1665 | 0.56 | 0.48 | 0.45 | 0.45 | 0.42 | 0.44 | 0.06 |
| NIII]1750 | 0.18 | 0.16 | 0.11 | 0.12 | 0.08 | 0.08 | 0.04 |
| SiIII]1883 | 0.09 | 0.10 | 0.09 | 0.09 | 0.08 | 0.05 | 0.17 |
| SiIII]1892 | 0.06 | 0.06 | 0.05 | 0.06 | 0.05 | 0.03 | 0.14 |
| CIII]1909 | 0.59 | 0.90 | 0.63 | 0.62 | 0.47 | 0.44 | 0.49 |
| [OII]3727 | 0.25 | 0.08 | 0.04 | 0.09 | 0.09 | 0.05 | 2.81 |
| [NeIII]3869 | 0.69 | 0.60 | 0.61 | 0.56 | 0.53 | 0.57 | 0.12 |
| [NeIII]3968 | 0.22 | 0.18 | 0.18 | 0.17 | 0.16 | 0.17 | 0.03 |
| HeII 4686 | 0.015-0.025 | 0.0016 | 0.0012 | 0.017 | 0.033 | 0.0046 | 0.0063 |
| [OIII]5007 | 7.50 | 8.00 | 8.2 | 7.49 | 7.0 | 7.5 | 1.53 |
| H | 1.00 | 1.00 | 1.00 | 1.00 | 1.00 | 1.00 | 1.00 |
| 1.73 | 1.61 | 1.57 | 1.60 | 1.60 | 1.59 | 1.25 | |
| WR | WR |
To summarize, the best photoionization models imply:
-
•
The nebular abundances in the Lynx arc are 103% Z⊙. This is in very good agreement with the measured abundances in §2.1.3 and with [FOSB03] within the errors. Lower (7% Z⊙) and higher (15% Z⊙) metallicities produce strong discrepancies with the measured line ratios.
-
•
Nitrogen is overabundant. The models suggest N/O 3 (N/O)⊙. This is in good agreement with the results obtained in §2.1.3.
-
•
Our models do not imply overabundance of Si relative to O, contrary to the results obtained by [FOSB03]. The reason to claim Si overabundance by this authors is that their model predicts SiIII]/H ratios a factor of 100 below the measured value. Si+2 is the species found in the Lynx arc with the lowest ionization potential (IP). All other lines detected are emitted by ions with higher IP (N+2 and C+2 are next, with 47.4 eV and 47.9 eV respectively). A hot black body (80 000 K in [FOSB03] models) produces a large supply of ionizing photons that efficiently remove Si+2 while still keeping a considerable amount of other species such as N+2 and C+2. The same can be said about [Binette et al. (2003)] models. The ionization of the gas in our models is dominated by much colder stars that allow the survival of Si+2 in the nebula.
-
•
The electron temperature is 16200500 K, in good agreement within the errors with the value determined from the [OIII]1663/5007 ratio (see §2.1.1).
-
•
Ages 5 Myr produce good fits to the Lynx spectrum, except for the He+2 lines, which are predicted too faint in most cases. Only when Wolf Rayet stars appear, the He+2 lines are properly fit. If Wolf Rayet stars are responsible for the ionization of He+ (but see §3.1), this implies:
-
–
Zstars must be 5% Z⊙, since no Wolf Rayet stars are formed at lower metallicities, according to the models (but see §3.1).
-
–
the Lynx arc is undergoing a WR phase and the age of the burst is in the range 2.8 - 3.4 Myr, depending on the stellar metallicity.
-
–
3 Discussion
3.1 The He+2 problem
All models in Tables 3 to 6 with ages of 5 Myr or younger (depending on the stellar metallicity) reproduce remarkably well most line ratios of the Lynx spectrum. Some of those models, however (those with no contribution from WR stars) cannot explain the He+2 nebular emission.
HeII4686 nebular emission has been detected in the optical spectrum of numerous extragalactic HII regions and star forming galaxies (e.g. [Garnett et al. 1991]). If the excitation of this line is due to photoionization by hot stars, these must have 55 000 K. Based on photoionization modeling, [FOSB03] concluded that 80 000 K in the Lynx arc, in the range of values typical of Wolf Rayet stars.
We have shown that Wolf Rayet stars are good candidates to explain the He+2 emission in the Lynx arc (they could also be responsible for the outflowing wind discovered by [FOSB03]). The non detection of the typical Wolf Rayet bumps found in Wolf Rayet galaxies (e.g. [Vacca & Conti 1992]) is simply due to the fact that the stellar population is not detected at all (see §3.3).
We have used two of the SEDs that best reproduce the Lynx spectrum (Zstars=20% Z⊙ and 3.4 Myr; Zstars=40% Z⊙ and 3.0 Myr, see §2.2) to predict the number of WR stars in the Lynx arc. CMK04 models predict 2.910-4 and 2.510-4 Wolf Rayet stars per solar mass for these two SEDs. Using the total stellar burst masses estimated from the H luminosity (see §3.3) , we obtain 2.7104 or 2.1104 WR stars for the 20% Z⊙ and 40% Z⊙ SEDs respectively. This is in the range of values found for low redshift WR galaxies, where the presence of 100 to 100 000 WR stars has been inferred ([Vacca & Conti 1992]).
WR stars have been proposed to explain the He+2 emission in stellar ionized nebulae. However, this is an unsolved problem in nearby star forming objects. For this reason, we do not reject the possibility that another unknown ionization source is present.
As an example, evidence for the existence of Wolf Rayet stars in the metal poor galaxy I Zw 18 (Z=1/50 Z⊙) has been reported by several authors ([Izotov et al. 1997], [Legrand et al. 1997]). [Stasińska & Schaerer (1999)] showed that the He+2 nebular intensity can be reproduced using a radiation field consistent with the observed Wolf-Rayet spectral features in this object (see also [de Mello et al. 1998]). However, it is not clear whether WR stars can explain the spatial distribution of the He+2 emission ([Vílchez & Iglesias-Páramo 1998]).
Izotov et al. (2004) have recently discovered the high ionization emission line [NeV]3426 in the spectrum of the blue compact low metallicity galaxy TOL 1214-277. Fricke et al. (2001) detected the [FeV]4227 line. Izotov et al. (2004) conclude that the stellar radiation is too soft to explain the existence of these high ionization species and propose that fast shocks or high mass X-ray binary systems could be responsible. The possibility that ultra-luminous X-ray sources (ULX) are responsible for the He+2 emission in the dwarf irregular galaxy Holmberg II has been proposed by [Pakull & Mirioni (2002)] and [Kaaret, Ward & Zezas (2004)]. ULXs may be be accreting normal mass (20 M⊙) black holes or neutron stars. An alternative possibility is that ULXs are high-mass X-ray binaires with super-Eddington mass transfer rates ([King et al. 2001]).
Peimbert, Sarmiento & Fierro (1991) showed that the emission line spectra of giant HII regions can be altered by the presence of shock waves produced by stellar winds or supernova events. This is also the case in star forming galaxies depending on the evolutionary phase of the stellar cluster ([Viegas, Contini & Contini 1999]). The outflowing wind in the Lynx arc discovered by [FOSB03] provides evidence for the possible presence of shocks in the Lynx arc. Such kind of effects are not included in our synthesis models (where the supernova X-ray emission is the time-average contribution of the events).
A final possibility is the presence of super-soft X-ray sources ([Rappaport, di Stefano & Smith 1994]). One of the physical models proposed to explain the nature of these sources involves mass transfer from a main-sequence or subgiant donor star to the surface of a white dwarf in a binary system ([van den Heuvel et al. 1992]). If this is the case in the Lynx arc, an additional stellar population with an age older than 50 Myrs must be present.
Therefore, we do not discard the possibility that alternative mechanisms to WR stars are responsible for the ionization of He+ in the Lynx arc.
3.2 The nitrogen overabundance
We have found that the strength of the NIII] and NIV] lines cannot be explained assuming solar abundances. As explained above, a possible explanation for this discrepancy is the assumption of constant density, rather than taking into account the presence of a gradient (see §2.1.3) (Luridiana et al. 2004, in preparation).
An alternative explanation is that N is overabundant by a factor 2-3 relative to the solar abundance (see §2.1.3 and §2.2). Significant nitrogen excesses, although rare, have been found in some star forming objects. Particularly interesting are the five extremely metal poor BCGs with large nitrogen excesses (see [Pustilnik et al. (2004)] for a more detailed discussion on this issue). The authors propose that the nitrogen excesses could be a consequence of merger events and a short powerful starburst phase when many WR stars contribute to a fast enrichment of the ISM.
The morphology ([FOSB03]) of the Lynx arc is reminiscent of a merging system (several clumps , , and joined by a very faint arc), but this is misleading since it is strongly distorted by the effects of the lensing cluster. In their strong lensing model, [FOSB03] assume that the Lynx arc consists of two different clumps ( and ) of the same source, while and are mirror images of and respectively. and (or and ) might be two components of a merging system. The evidence, however, is not strong enough to confirm this.
3.3 The continuum problem
We investigate here whether the starburst luminosity required to excite the strong emission lines in the Lynx arc is consistent with the non detection of the stellar component.
[FOSB03] found a discrepancy (a factor of 20) between the mass of the starburst needed to power the H lumininosity of the Lynx arc and the mass of a starburst whose continuum would be just marginally detected, in agreement with the fact that the observed continuum is mostly nebular. We have done a similar exercise using the SED models that best reproduce the spectroscopic properties of the Lynx arc.
Using the SEDs by [CMK04] we have calculated the stellar mass of a burst that can generate the observed Lynx H luminosity =4.3 1042 erg s-1 (corrected for magnification, [FOSB03]). The results are shown in Table 7 for two of the SEDs that best reproduce the emission line spectroscopic properties of the Lynx arc (see §2.2).
The calculations have been done assuming covering factor =1 ([FOSB03]). We obtain M9 107 M. This is a lower limit, since we have assumed that all ionizing photons are absorbed by the gas and there is no dust reddening. It is important to note that the uncertainties on the assumed magnification factor are large. [FOSB03] found a rather wide range of models that successfully describe the Lynx arc system. This introduces serious uncertainties in the estimated cluster mass.
| Metallicity | Age | (H) | MassHβ | F1600 |
|---|---|---|---|---|
| / | Myr | erg s-1 M | M⊙ | erg s-1 cm-2 Hz-1 |
| 20% | 3.4 | 3.2 1034 | 9.4 107 | 6.210-31 |
| 40% | 3.0 | 3.5 1034 | 8.6 107 | 6.410-31 |
| Lynx | 7.910-32 |
We have then calculated the stellar continuum at 1600 Å (rest frame) emitted by these instantaneous bursts and compared it with the continuum level measured for the Lynx arc which is 0.15 Jy (observed frame value corrected for magnification, [FOSB03]). This corresponds to Fν=7.8910-32 erg s-1 cm-2 Hz-1 (rest frame). The results are shown in Table 7. The theoretical values are a factor of 10 higher than the value measured for the Lynx arc. The discrepancy is even higher if we take the nebular continuum into account, which according to [FOSB03] is the dominant continuum component.
As [FOSB03], we therefore conclude that the stellar burst that reproduces the measured H luminosity would produce an observable continuum much (10 times) brighter than that detected from the Lynx arc. Adding the nebular contribution, the continuum should be even brighter. The conclusion is not affected by uncertainties on the magnification factor if the continuum and the H flux scale in the same way with . A similar problem was reported by [Steidel et al. (2000)] regarding the giant Ly nebulae associated with Lyman break galaxies. The authors found that the measured UV continuum is not enough to explain the high Ly luminosities of the nebulae.
We now discuss some possible reasons for this discrepancy in the Lynx arc.
The AGN scenario
The previous discussion suggests that the ionizing source in the Lynx arc is hidden from the observers view. Such a geometry is characteristic of type II active galaxies (AGN). [Chapman et al. (2004)] have recently suggested that the Lyman “blobs” found by [Steidel et al. (2000)] might be powered by a hidden AGN. [Binette et al. (2003)] suggested the possibility that the Lynx arc is a type II active galaxy. We, however, strongly support that this is a star forming object for several reasons:
-
•
an unusual (filtered) ionizing continuum shape is required to explain the line ratios of the arc (Binette et al. 2003) within the AGN scenario. Our new models using normal (i.e. non primordial) stars show an excellent agreement with the Lynx arc measured line ratios, better than the filtered AGN models (see for instance, [OIII]5007/Hb, NV/Hb, CIV/H, CIII]/H in Table 1 of [Binette et al. (2003)]). I.e. there is no need for an exotic AGN model to reproduce the line ratios.
-
•
the very narrow lines of the Lynx arc (FWHM of non resonant lines 100 km s-1, [FOSB03]) are typical of star forming objects. AGNs usually show line widths of few hundred km s-1. Although there are examples of extended emission line regions in active galaxies with narrower lines, these cases are exceptional.
-
•
The strongest discrepancies of the filtered AGN model disappear with our new models: these are the severe underprediction of the SiIII] lines and the too high electron temperature (20 000 K) predicted by the filtered AGN models.
We therefore reject the possibility that the Lynx arc is an active galaxy.
A hidden starburst
Hidden starbursts have been proposed to explain the spectroscopic properties of the metal poor blue compact galaxy HS 0837+4717 (Pustilnik et al. 2004). In this object, the extinction of the narrow emission lines from the giant HII region is low, but the large Balmer decrement (194) of the broad components suggests that part of the current starburst is highly obscured by dust. A highly obscured starburst has also been revealed by mid-IR observations of the very low metallicity galaxy SBS 0335-052 (=1/41 [Hunt, Vanzi & Thuan 2001]). Roughly 3/4 of the star formation in this object occurs within the obscured cluster.
It is not clear however, that this scenario solves the the Lynx arc problem. In HS 0837+4717 and SBS 0335-052 the non-obscured regions emit both strong continuum and emission lines. I.e., if optical emission lines are detected, the ionizing stars are also detected. This is not the case for the Lynx arc.
Differential gravitational lensing amplification
The different spatial distribution between ionized gas and young stars can be the solution to the Lynx continuum problem.
The discrepancy between reddening values derived using the UV continuum and the ratios of the Balmer lines found in some star forming galaxies (e.g. [Mas-Hesse & Kunth 1998]) has been explained as due to ionized gas and stars having different spatial distributions and suffering different extinction by dust. When this discrepancy is found, the UV continuum seems to be less affected by extinction than the emission lines. The opposite case would apply to the Lynx arc. Spatial decoupling between ionized gas and young stars has been observed in some star forming galaxies (e.g. [Maiz-Apellániz et al. 1998]) and proposed by several authors to explain different issues (e.g. [Mas-Hesse & Kunth 1998], [González Delgado & Pérez 2000])
The degree of amplification suffered by the source undergoing lensing depends strongly on both the position close to the critical lines and the geometry of the lensed object, so that separate regions can suffer different degrees of amplification. If stars and gas have different spatial distributions in the Lynx arc, emission lines and stellar continuum can suffer different magnification due to the intervening cluster. Differential amplification between lines and continuum has been observed in several quasars (e.g. [Racine 1992]). Detailed gravitational lensing models would be necessary to verify this possibility.
A primordial stellar population
The SED of metal-free stars is characterized by effective temperatures on the Main Sequence around 105 K, hotter than their counterparts of equal mass but finite metallicity (e.g. [Tumlinson & Shull 2000]). The UV recombination emission lines, such as HeII1640, would have extreme equivalent widths more than an order of magnitude larger than the expectation for a normal cluster of hot stars with the same total mass and a Salpeter IMF. Bromm, Kudritzki & Loeb (2001) estimated that a cluster of 106 M⊙ of popIII stars with a heavy IMF would produce 2.31042 erg s-1 in the HeII1640 line and a spectral luminosity per unit frequency of 1.81027 erg s-1 Hz-1. For the observed luminosity of the HeII1640 in the Lynx arc (4.41042 erg s-1) a cluster of 2106 M⊙ of primordial stars would be required. Such a cluster would produce a spectral flux per unit frequency of 3.110-32 erg s-1 cm-2 Hz-1 at the distance of the Lynx arc. This is a factor of 2.3 below the continuum measured for the Lynx arc. The discrepancy, therefore, disappears and this result is consistent with the conclusion by [FOSB03] that the continuum is mostly nebular.
The possibility that the Lynx arc is a popIII object was proposed and discussed in detail by [FOSB03]. It is difficult to explain, however, nebular abundances as high as 10% if the stellar population is primordial.
4 Summary and conclusions
We have characterized the physical properties (electron temperature, density, chemical abundances) of the ionized gas and the ionizing stellar population in the Lynx arc, a gravitationally amplified HII galaxy at =3.36. The temperature sensitive ratio [OIII]1661,1666/5007 implies an electron temperature =17300 K, in good agreement within the errors with photoionization model predictions. The UV doublets imply the existence of a density gradient in this object, with a highly ionized high density region (0.1-1.0 105 cm-3) and a low density region (3200 cm-3) with lower ionization state.
Both the photoionization modeling and standard techniques of chemical abundance determination imply that the gas metallicity is 103% Z⊙. Both methods suggest that nitrogen is overabundant with N/O2.0-3[N/O]⊙, unless a density gradient produces this apparent effect. We do not find evidence for Si overabundance as Fosbury et al. (2003). The reason is the different shape of the ionizing continuum assumed by these authors (80 000 K black body, much hotter than the dominant ionizing stars in our models).
Photoionization models imply that the ionizing stars have very young ages 5 Myr. Since the emission lines trace the properties of the present burst only, nothing can be said about the possible presence of an underlying old stellar population. Instantaneous burst models with Zstar5% Z⊙ and ages 2.8-3.4 Myr (depending on Zstar), are in excellent agreement with the Lynx spectrum, including the strong He+2 emission. At this age Wolf Rayet stars make an important contribution to the hard ionizing luminosity and they are responsible for the excitation of the He+2 emission. In such case, we infer the existence of 2.5104 WR stars in the Lynx arc. Alternative excitation mechanisms for He+2, however, cannot be discarded.
Therefore, the Lynx arc is a low metallicity HII galaxy that is undergoing a burst of star formation of 5 Myr age. One possible scenario that explains the emission line spectrum of the Lynx arc, the strength of the nitrogen lines and the strong He+2 emission is that the object has experienced a merger event that has triggered a powerful starburst phase. Wolf Rayet stars have been formed and contribute to a fast chemical enrichment of the interstellar medium.
As Fosbury et al. (2003), we find a factor of 10 discrepancy between the mass of the instantaneous burst implied by the luminosity of the H line and the mass implied by the continuum level measured for the Lynx arc. We have discussed several possible solutions to this problem. The most satisfactory explanation is that gas and stars have different spatial distribution so that the emission lines and the stellar continuum suffer different gravitational amplification by the intervening cluster. Detailed gravitional lensing models are needed to test the vailidity of this scenario.
Acknowledgments
We thank an anonymous referee for providing very useful comments that helped to improve this paper substantially. We thank Valentina Luridiana for useful scientific discussions and Andrew Humphrey for providing Figure 1. M. Villar-Martín and M. Cerviño are supported by the Spanish National program Ramón y Cajal. We acknowledge support by the Spanish Ministry of Science and Technology (MCyT) through grant AYA-2001-3939-C02-01.
References
- [Allende-Prieto, Lambert & Asplun 2001] Allende-Prieto C., Lambert D.L., Asplund M., 2001, ApJ, 556, L63
- [Allende-Prieto, Lambert & Asplun 2002] Allende-Prieto C., Lambert D.L., Asplund M., 2002, ApJ, 573, L137
- [Aller 1984] Aller L. H., 1984, Physics of Thermal Gaseous Nebulae, D. Reidel, Publ. Company, Dordrecht.
- [Binette et al. (2003)] Binette L., Groves B., Villar-Martín M., Fosbury R.A.E., Axon D., 2003, A&A, 405, 975
- [Bromm, Kudriztki & Loeb 2001] Bromm V., Kudritzki R. P., Loeb A., 2001, ApJ, 552, 464
- [Cerviño & Mas-Hesse 1994] Cerviño M., Mas-Hesse J. M., 1994, A&A, 284, 749
- [Cerviño, Gómez-Flechoso & Castander (2001)] Cerviño M., Gómez-Flechoso M.A., Castander F.J., Schaerer D., Molla M., Knödlseder J., Luridiana V., 2001, A&A, 376, 422
- [CMK04 ] Cerviño M., Mas-Hesse J.M., Kunth D. 2004 available at http://www.laeff.esa.es/users/mcs/SED (CMK04)
- [Charbonnel et al. (1993)] Charbonnel C., Meynet G., Maeder A., Schaller G., & Schaerer D., 1993, A&AS, 101, 415
- [Chapman et al. (2004)] Chapman S., Scott D., Windhorst R., Frayer D., Borys C., Lewis G., Ivison R., 2004, ApJ, 606, 85
- [Copetti et al. 2000] Copetti M.V.F., Mallmann J.A.H., Schmidt A.A., Castañeda H.O., 2000, A&A, 357, 621
- [de Mello et al. 1998] de Mello D.F., Schaerer D., Heldmann J., Leitherer C., 1998, ApJ, 507, 199
- [Ferland et al. 1998] Ferland G. J., Korista K., Vernet D., Ferguson J., Kingdon J., Verner E., 1998, PASP, 110, 761
- [FOSB03] Fosbury R.A.E., Villar-Martín M., Humphrey A., Lombardi M., Rosati P., Stern D., Hook R, Holden B.P., et al. 2003, ApJ, 596, 797
- [Fricke et al. 2001] Fricke K.J., Izotov Y., Papaderos P., Guseva N.G., Thuan T.X., 2001, AJ, 121, 169
- [Garnett et al. 1991] Garnett D. R., Kennicutt R. C., Chu Y. Skillman E. D., 1991, ApJ, 373, 458
- [Garnett et al. 1995] Garnett D., Dufour R. J., Peimbert M., Torres-Peimbert S., Shields G. A., Skillman E.D., Terlevich E., Terlevich R. J, 1995, ApJ, 449, L77
- [González Delgado & Pérez 2000] González Delgado R. & Pérez E., 2000, MNRAS, 317, 64
- [Guzmán et al. (1996)] Guzmán R., Koo D.C., Faber S.M., Illingworth D., Takamiya M., Kron R.G., Bershady M.A., 1996, ApJ, 460, L5
- [Habing & Israel 1979] Habing H.J., Israel F.P., 1979, ARA&A, 17,345
- [Holden et al. 2001] Holden B.P., Stanford S.A., Rosati P., Squires G., Tozzi P., Fosbury R.A.E., Papovich C., Eisenhardt P., Elston R., Spinrad H., 2001, AJ, 122, 629
- [Holweger (2001)] Holweger H., 2001, Joint SOHO/ACE workshop ”Solar and Galactic Composition”. Ed. R. F. Wimmer-Scheweingruber. American Institute of Physics Conferece proceedings vols. 598, p. 23.
- [Hunt, Vanzi & Thuan 2001] Hunt L.K., Vanzi L., Thuan T.X., 2001, A&A, 377, 66
- [Izotov et al. 1990] Izotov Y. I., Lipovetskij V. A., Guseva N. G., Knyazev A. Y., 1990, Astronomicheskii Zhurnal (AZh), 67, 682
- [Izotov et al. 1997] Izotov Y., Foltz C.B., Green R.F., Guseva N.G., Thuan T.X., 1997, ApJ, 487, L37
- [Izotov et al. 2004] Izotov Y., Noeske K.G., Guseva N.G., Papaderos P., Thuan T.X., Fricke K.J., 2004, A&A, 415, L27
- [Kaaret, Ward & Zezas (2004)] Kaaret P., Ward M.J., Zezas A., 2004, MNRAS, 351, L83
- [Keenan, Feibleman & Berrington 1992] Keenan F.P., Feibleman W.A., Berrington K.A., 1992, ApJ, 389, 443
- [Keenan et al. 1995] Keenan F.P. Ramsbottom C. A., Bell K. L., Berrington K. A., Hibbert A., Feibelman W. A., Blair W. P., 1995, ApJ, 438, 500
- [King et al. 2001] King A., Davies M., Ward M., Fabbiano G., Elvis M., 2001, ApJ, 552, L109
- [Kunth & Östlin 2000] Kunth D., Östlin, 2000, A&ARv, 10, 1
- [Kurucz (1991)] Kurucz, R. L. 1991, in Stellar Atmospheres, Beyond Clasical Limits, Crivellari L., Hubeny I., Hummer D.G. (eds.), Kluwer, Dordrecht, p. 441 (http://kurucz.harvard.edu/grids/)
- [Legrand et al. 1997] Legrand F., Kunth D., Roy J-R., Mas-Hesse J.M., Walsh J.R., 1997, A&A, 326, L17
- [Leitherer et al. 1999] Leitherer C., Schaerer D., Goldader J.D., González Delgado R.M., Robert C., Foo Kune D., de Mello D.F., Devost D., Heckman T., 1999, ApJSS, 123, 3
- [Luridiana & Cerviño 2003] Luridiana V., Cerviño M., 2003, in Star Formation Through Time, ASP Conference Proceedings, Vol. 297, p.49 Perez E., Gonzalez Delgado R.M. and Tenorio-Tagle G. Eds.
- [Maiz-Apellániz et al. 1998] Maiz-Apellániz, Mas-Hesse J., Muñoz-Tuñón C., Vílchez J.M., Castañeda H.O., 1998, A&A, 329, 409
- [Mas-Hesse & Kunth 1998] Mas-Hesse J.M., Kunth D., 1998, in Ultraviolet Astrophysics Beyond the IUE Final Archive : Proceedings of the Conference held in Sevilla, Spain, from 11th to 14th November 1997. W. Wamsteker and R. Gonzalez Riestra Eds.. Noordwijk, The Netherlands : ESA Publications Division, 1998. (ESA SP ; 413), p.537
- [Melnick, Terlevich & Eggleton 1985] Melnick J., Terlevich R., Eggleton P. P., 1985, MNRAS, 216, 255
- [Osterbrock & Flather 1959] Osterbrock D., Flather E., 1959, ApJ, 129, 26
- [Pakull & Mirioni (2002)] Pakull M., Mirioni L., 2002, in proceedings of the symposium New Visions of the X-ray Universe in the XMM-Newton and Chandra Era, 26-30 November 2001, ESTEC, The Netherlands
- [Peimbert, Sarmiento & Fierro 1991] Peimbert M., Sarmiento A., Fierro J., 1991, PASP, 103, 815
- [Pustilnik et al. (2004)] Pustilnik S., Kniazev A., Pramskij A., Izotov Y., Foltz C., Brosch N., Martin J-M., Ugryumov A., 2004, A&A, 419, 469
- [Racine 1992] Racine R., 1992, ApJ, 395, L65
- [Rappaport, di Stefano & Smith 1994] Rappaport, S., di Stefano R., Smith J. D., 1994, ApJ, 426, 692
- [Rieke et al. 1993] Rieke G.H., Loken K., Rieke M.J., Tamblyn P., 1993, ApJ, 412, 99
- [Salpeter 1955] Salpeter E. E., 1955, ApJ, 121, 161
- [Schaerer et al. (1993a)] Schaerer D., Charbonnel C., Meynet G., Maeder A., & Schaller G., 1993a, A&AS, 102, 339
- [Schaerer et al. (1993b)] Schaerer D., Meynet G., Maeder A., & Schaller G., 1993b, A&AS, 98, 523
- [Schaerer & de Koter (1997)] Schaerer D., de Koter A., 1997, A&A, 322, 598
- [Schaller et al. (1992)] Schaller, G., Schaerer D., Meynet G. & Maeder A, 1992, A&AS, 96, 269
- [Schmutz, Leitherer & Gruenwald (1992)] Schmutz, W., Leitherer, C., & Gruenwald, R. 1992, PASP, 104, 1164
- [Stasińska & Schaerer (1999) ] Stasińska G., Schaerer D., A&A, 351, 72
- [Stasińska, Schaerer & Leitherer 2001] Stasińska G., Schaerer D., Leitherer C., 2001, A&A, 370, 1
- [Steidel et al. (2000)] Steidel C., Adelberger K., Shapley A., Pettini M., Dickinson M., Giavalisco M., 2000, ApJ, 532, 170
- [Terlevich et al. 1991] Terlevich R., Melnick J., Masegosa J., Moles M., Copetti M., 1991, A&AS, 91, 285
- [Terlevich et al. 2004] Terlevich R., Silich S., Rosa-González D., Terlevich E., 2004, MNRAS, 348, 1191
- [Tumlinson & Shull 2000] Tumlinson J., Shull J.M., 2000, ApJ, 528, L65
- [Vacca & Conti 1992] Vacca W. D., Conti P. S., 1992, ApJ, 401, 543
- [van den Heuvel et al. 1992] van den Heuvel, Bhattacharya D., Nomoto K., Rappaport S. A., 1992, A&A, 262, 97
- [Viegas, Contini & Contini 1999] Viegas S.M., Contini M., Contini T., 1999, A&A, 347, 112
- [Vílchez & Iglesias-Páramo 1998] Vílchez J.M. & Iglesias-Páramo J., 1999, ApJ, 508, 248
- [Weidner & Kroupa 2004] Weidner C., Kroupa P., 2004, MNRAS, 348, 187