Correlated Infrared and X-ray Flux Changes Following the 2002 June Outburst of the Anomalous X-ray Pulsar 1E 2259+586
Abstract
We present the results of a near-infrared monitoring program of the Anomalous X-ray Pulsar 1E 2259+586, performed at the Gemini Observatory. This program began three days after the pulsar’s 2002 June outburst, and spans 1.5 years. We find that after an initial increase associated with the outburst, the near-infrared flux decreased continually and reached the pre-burst quiescent level after about one year. We compare both the near-infrared flux enhancement and its decay to those of the X-ray afterglow, and find them to be remarkably consistent. Fitting simple power laws to the RXTE pulsed flux and near-infrared data for day post-burst, we find the following decay indices: (X-ray), (near-infrared), where flux is a function of time such that . This suggests that the enhanced infrared and X-ray fluxes have a physical link post-outburst, most likely from the neutron-star magnetosphere.
1 INTRODUCTION
The origin of the optical and infrared (IR) emission in Anomalous X-ray Pulsars (AXPs) is currently uncertain. To date, possible IR counterparts have been identified for 5 (of 6) known AXPs [1E 2259+586: Hulleman et al. (2001); Kaspi et al. (2003), 1E 1048.15937: Wang & Chakrabarty (2002); Israel et al. (2002), 1RXS J170849400910: Israel et al. (2003), 4U 0142+61: Hulleman et al. (2004) and XTE J1810197: Israel et al. (2004)]. In one case, 4U 0142+61, optical emission has been detected (Hulleman et al., 2000a) and was seen to pulse at the same period as the X-ray pulsar (Kern & Martin, 2002). All of these sources show excess optical/IR emission when compared to the prediction of a simple blackbody model extrapolated from X-ray energies (assuming the 2-component model consisting of a power-law plus blackbody component for the X-ray emission). The extrapolation of the power-law component greatly overpredicts the optical/IR flux, however.
On 2002 June 18, 1E 2259+586 exhibited an outburst that included, apart from the 80 bright, short-lived X-ray bursts, a large and long-lived X-ray flux enhancement with subsequent decay (Kaspi et al., 2003; Woods et al., 2004; Gavriil et al., 2004), as well as a significant near-IR flux enhancement, demonstrated with Gemini-North Target of Opportunity observations made 3 and 10 days after the outburst (Kaspi et al., 2003). This was the first demonstration of IR variability in an AXP, and subsequently the first example of an associations between X-ray and IR activity. Since then, IR variability has also been reported in 1E 1048.15937 (Wang & Chakrabarty, 2002; Israel et al., 2002; Durant et al., 2004) and 4U 0142+61 (Hulleman et al., 2004) without evidence for a correlation with X-ray outbursts, though sparsity in X-ray observations do not preclude this. Recently, Rea et al. (2004) reported that a second near-IR observation of the proposed counterpart to XTE J1810197 showed variablity possibly linked to X-ray flux decay.
In order to verify that the enhancement in IR flux seen post-outburst in 1E 2259+586 was genuinely related to the outburst, as well as to characterize its decay, we monitored the source using the Gemini North telescope. Here we report on this program, demonstrating conclusively that the IR enhancement reported by Kaspi et al. (2003) was associated with the outburst. We also find that the post-outburst IR and X-ray radiation properties are correlated. In §4, we compare our results with expectations from different models and other AXPs.
2 OBSERVATIONS
Images in the near-IR band (m, m) were obtained with the Near-InfraRed Imager (NIRI; f/6 camera; Aladdin InSb detector array; pixels; pixel size) at the 8-m Gemini North Observatory. For a description of the observing parameters and conditions, see Table 1. The detector array was read several times in order to reduce read-out noise. This was done both before and after each exposure, and the difference was recorded in the data files. Each target frame consisted of 4 coadded exposures of 15-s integrations. Two earlier observations of 1E 2259+586, which took place 3 and 10 days after the X-ray burst in June 2002 as part of a Target of Opporunity (ToO) program, were described in Kaspi et al. (2003) and are also included in this analysis. All data were reduced using the Gemini IRAF package for NIRI data. Each frame was divided by a normalized flat field constructed from the lamp flat frames obtained with the Gemini standard calibration unit. The sky background image was derived from the data frames themselves with the objects masked out, taking advantage of the 9-point dither pattern applied during the observation: this was subtracted from all data frames. Finally, all data from a single night were coadded into one image.
Photometry was performed using standard procedures within the DAOPHOT package (Stetson, 1987) as implemented in IRAF. To calibrate the instrumental magnitudes found by DAOPHOT, we tied our measurements directly to stars in the 1E 2259+586 field (Hulleman et al., 2001). The eight nearest neighbours that were bright, isolated and not varying (stars A, B, B′, D, F, G, K and N under the numbering system of Hulleman et al., 2001) were used to measure the mean offset between the instrumental and published band magnitudes. To verify non-variability, we chose only stars that fell within a standard devation of mag from the weighted mean. The advantage of this procedure was that it gave much more precise relative fluxes than would have been possible by using the single standard star observed during each night.
Measured band magnitudes of 1E 2259+586 are listed in Table 1. We analytically estimated magnitude errors from the standard deviation of the sky background, under the assumption that an aperture with a radius equal to the PSF FWHM contains 70% of a star’s flux: this was added in quadrature to the uncertainty in the photometric tie to produce final uncertainties in Table 1. Our careful re-analysis of the ToO data (the first two points) gave results consistent with Kaspi et al. (2003) well within uncertainties: the differences in magnitude between the two analyses were (Jun. 21) and (Jun. 28). The third data point was observed with the Canada France Hawaii Telescope (CFHT) by Israel et al. (2004): we have assumed in our magnitude to flux conversion. From Table 1, one sees that 400 days post-burst, the source appears to have returned to its pre-burst brightness of mag (Hulleman et al., 2001).
3 RESULTS
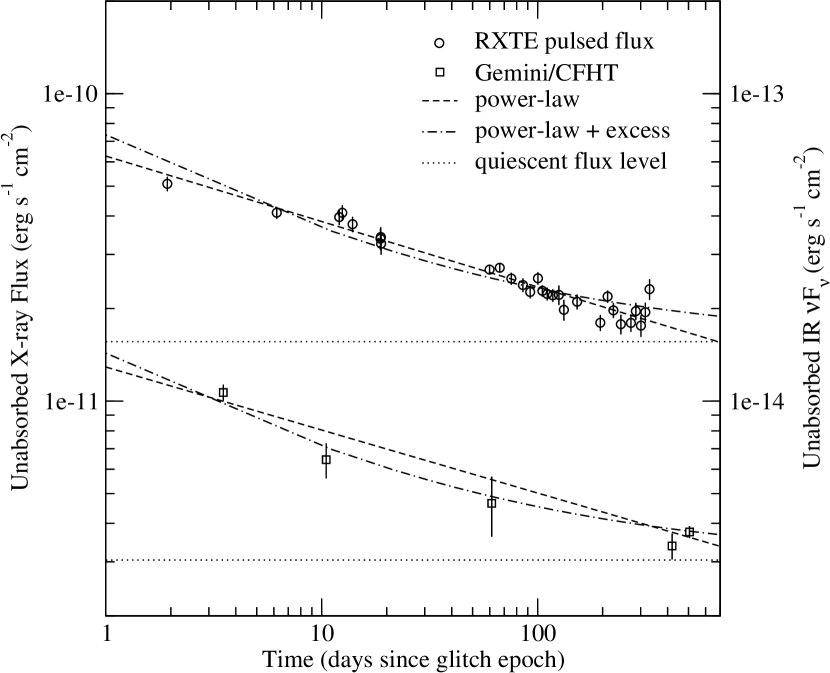
The post-outburst evolution of the X-ray pulsed flux of 1E 2259+586 is described by Woods et al. (2004) in terms of a model with two power laws in time, where , with the unabsorbed 210 keV pulsed flux, the time since the glitch epoch MJD, and the power-law index. Immediately after the outburst (1 day) the decay appears to follow a much steeper power-law index than it does over the following year. We compare the near-IR flux enhancement and decay to those of the second, slower X-ray segment consisting of flux from 1 day post-burst, for which Woods et al. (2004) find a temporal decay index of .
To the near-IR data, we first apply an extinction correction of , which is inferred from cm mag (Predehl & Schmitt, 1995) where cm-2 (Patel et al., 2001). Magnitudes are then converted to (see Table 1 and Figure 1).
We fit a simple power-law function, , to the X-ray and IR flux using a numerical fitting program that directly searches over parameter space, where is a constant with dimensions erg/s/cm2, is time in days since the glitch, and the choice of the factor of 100 roughly minimizes the covariance between and . Note also that represents both X-ray flux and near-IR , depending on the case, in erg/s/cm2. Table 2 contains our best-fit parameter values and 1 uncertainties. Fitting the RXTE pulsed-flux data only, we confirm the index reported by Woods et al. (2004)111The small discrepancy can be explained by noting that Woods et al. (2004) perform a fit on log-log data to a linear function, which neglects to account for asymmetric uncertainties, unlike our numerical method.. Comparing the long-term decay of near-IR and X-ray afterglow, we find the simple power-law indices remarkably consistent: (X-ray) and (IR).
Interestingly, the X-ray and IR enhancements also appear to be offset from their respective quiescent levels at by nearly the same amount and, as a result, decay back to on similar time scales. To quantify this, we perform a fit to a second function consisting of a power-law with an excess offset , where days is the time since the glitch of the first IR observation, is the flux excess, and is the flux enhancement at . Data from are included to determine . If the offsets are correlated, then we would expect the best-fit from X-ray and data to be consistent: this is in fact what we find in the latter part of Table 2. We note that larger errors and a small number of near-IR data points result in and large uncertainties on and when all three parameters are fit to the near-IR data. To confirm that the shapes of the decay curves of the X-ray and data are consistent statistically, we re-fit the data to the excess model with and fixed at the X-ray excess best-fit values. The effect of holding two parameters constant is a reasonable increase in to , showing that the two shapes are indeed consistent with each other at the 1 level. In Figure 1, we plot the best-fit power laws as modelled on the X-ray and data (dashed lines); overplotted is the power-law plus excess model where and (dot-dashed lines), and the corresponding best-fit value (dotted lines), for comparison.
Thus, we find that the 1 day IR and X-ray initial enhancements and subsequent decays after the 2002 outburst are correlated.
4 DISCUSSION
In this section, we compare our results with other AXPs and discuss them in the context of various models.
AXP optical/IR emission has been argued as originating from a fossil disk around the neutron star (e.g. Chatterjee et al., 2000; Ekşı & Alpar, 2003). The exceptionally high X-ray to optical/IR flux ratio seen in AXP 1E 2259+586 rendered this model problematic (Hulleman et al., 2000b, 2001). Moreover, the SGR-like bursting phenomena, observed in the 2002 outburst of 1E 2259+586 (Kaspi et al., 2003; Gavriil et al., 2004; Woods et al., 2004), and from 1E 1048.15937 in 2001 (Gavriil et al., 2002) and very recently in 2004 (Kaspi et al., 2004), as well as the high optical pulsed fraction seen in AXP 4U 0142+61 (Kern & Martin, 2002), simply cannot be explained by such disks. Ertan & Cheng (2004) argue that the high optical pulsed fraction can be reproduced in a disk-dynamo model, although whether this could produce the observed bursts is unclear.
“Hybrid” fallback disk models, in which the disk surrounds a magnetar, have recently been proposed to attempt to explain all AXP properties (Ekşı & Alpar, 2003). In this case, the quiescent pulsed X-ray emission arises from accretion from the disk while optical pulsations and bursts are magnetar magnetospheric emission. Ertan & Alpar (2003) argue, in the context of such a hybrid model, that enhanced X-ray emission, following an SGR-like flare, is released from the inner disk which has been pushed back by the burst itself. For 1E 2259+586, however, no such SGR-like flare was detected prior to the observed enhanced X-ray emission, with upper limit 3 orders of magnitude below the total observed energy release (Woods et al., 2004). Furthermore, one AXP shows uncorrelated torque and X-ray flux variations, contrary to the predictions of any fallback disk model (Gavriil & Kaspi, 2004). It is true that one natural prediction of fallback disk models is some form of correlation between the IR and X-ray emission (see Rea et al., 2004, and references therein). Nevertheless, in the absence of solutions to the problematic aspects of these models as listed above, we do not find the observed IR/X-ray correlation to render fallback disk models particularly compelling.
By contrast, the magnetar model accounts very well for the bulk of AXP properties, especially bursts (Thompson & Duncan, 1996), and qualitatively can explain optical/IR properties as well. In the magnetar model, thermal surface emission is ruled out as the energy source for AXP optical/IR emission because of the impossibly high implied brightness temperature; hence, optical/IR emission must originate in the stellar magnetosphere, regardless of what powers it. Recently, Eichler et al. (2002) and Özel (2004) argued that electron/positron radiation in the magnetosphere of a magnetar, produced in analogy with that in rotation-powered pulsars, could explain the observed optical/IR properties of AXPs. The strong correlation between IR and X-ray flux decay that we have observed in the afterglow of the 2002 outburst of 1E 2259+586 argues for a physical link between the origins of both types of radiation. The X-ray emission is far too luminous ( in 110 keV at a distance 4 kpc, Mereghetti et al., 2002) to be rotation-powered; it follows that the IR emission is likely not either. Though Özel (2004) argued that the IR emission from an energetics standpoint could be rotation-powered, the large implied efficiency (, from Figure 1 of Özel, 2004) of conversion from spin-down flux into IR emission in 4U 0142+61, if the latter is rotation-powered, also argues against (though does not disprove) this hypothesis.
The post-outburst correlation does clarify, however, the origin of the X-ray afterglow following the 2002 outburst, because of the following reasoning. Woods et al. (2004) identified two possible mechanisms to produce the X-ray afterglow. The first was a genuine afterglow, i.e. thermal emission from the surface, a result of an impulsive heat injection to the crust from the magnetosphere. Such a thermal afterglow mechanism has been invoked in SGRs, in which the impulse, namely a bright soft gamma-ray flare, was clearly observed (Hurley et al., 1999). For 1E 2259+586, however, no such flare was seen (Woods et al., 2004). An alternative to this thermal afterglow model is that the enhanced X-rays are a result of a twisting of the magnetospheric field, perhaps as a result of the twisting of its footpoints following a signficant surface restructuring. Such an event is consistent with the coincidental rotational glitch that was observed (Kaspi et al., 2003; Woods et al., 2004), since the latter clearly implies a major disturbance in the crustal superfluid. Such a twisting could naturally result in enhanced X-rays (Thompson et al., 2002), with subsequent field relaxation accounting for the decay. Given that the IR enhancement cannot be from surface thermal emission, the correlation with the X-ray decay strongly favors the twisting model, as it is difficult to understand how surface thermal X-ray emission could be so closely correlated with magnetospheric radiation. Moreover, the IR enhancement being a result of a decaying magnetospheric disturbance is consistent with the picture suggested by Eichler et al. (2002) and Özel (2004) in which the IR emission is radiation from magnetospheric pairs. It would be interesting to see, in future outbursts, whether the IR emission is pulsed and/or polarized, and if so, whether the pulse morphology is similar, and changes in concert with any X-ray pulse morphological changes, as this would strongly support this scenario.
IR variability over long time periods has been seen in three other AXPs. In the case of 1E 1048.15937, -band variability has been detected (Wang & Chakrabarty, 2002; Israel et al., 2002). However, no variation in X-ray flux was seen between the different epochs. Moreover, a more recent observation (Durant et al., 2004) found that the IR flux was consistent with the fainter of the two previous measurements, even though the X-ray flux was significantly larger (Gavriil & Kaspi, 2004). Despite showing no evidence of X-ray activity (Gavriil & Kaspi, 2002, and unpublished work), 4U 0142+61 also appears to vary in (Hulleman et al., 2004). This suggests that the physical mechanism responsible for the IR emission is distinct from that responsible for the quiescent X-rays, even during the broad X-ray flaring reported by Gavriil & Kaspi (2004). This is in contrast to the post-outburst behavior we have seen in 1E 2259+586. That AXP IR and X-ray emission is generally correlated following an AXP outburst is further supported by the recent report of IR decay in data from the transient AXP candidate XTE J1810197 (Rea et al., 2004) following its X-ray brightening and fading in 2004 (Ibrahim et al., 2004).
References
- Chatterjee et al. (2000) Chatterjee, P., Hernquist, L., & Narayan, R. 2000, ApJ, 534, 373
- Cox (2000) Cox, A. N., ed. 2000, Allen’s astrophysical quantities, 4th ed. (New York: AIP Press; Springer)
- Durant et al. (2004) Durant, M., van Kerkwijk, M. H., & Hulleman, F. 2004, in Young Neutron Stars and Their Environments, IAU Symposium 218, ed. B. Gaensler & F. Camilo (San Francisco: Astronomical Society of the Pacific), in press (astro-ph/0309801)
- Eichler et al. (2002) Eichler, D., Gedalin, M., & Lyubarsky, Y. 2002, ApJ, 578, L121
- Ekşı & Alpar (2003) Ekşı, K. Y. & Alpar, M. A. 2003, ApJ, 599, 450
- Ertan & Alpar (2003) Ertan, Ü. & Alpar, M. A. 2003, ApJ, 593, L93
- Ertan & Cheng (2004) Ertan, Ü. & Cheng, K. S. 2004, ApJ, 605, 840
- Gaensler & Camilo (2004) Gaensler, B. & Camilo, F., eds. 2004, Young Neutron Stars and Their Environments, IAU Symposium 218 (San Francisco: Astronomical Society of the Pacific)
- Gavriil & Kaspi (2002) Gavriil, F. P. & Kaspi, V. M. 2002, ApJ, 567, 1067
- Gavriil & Kaspi (2004) Gavriil, F. P. & Kaspi, V. M. 2004, ApJ, 609, L67
- Gavriil et al. (2002) Gavriil, F. P., Kaspi, V. M., & Woods, P. M. 2002, Nature, 419, 142
- Gavriil et al. (2004) —. 2004, ApJ, 607, 959
- Hulleman et al. (2001) Hulleman, F., Tennant, A. F., van Kerkwijk, M. H., Kulkarni, S. R., Kouveliotou, C., & Patel, S. K. 2001, ApJ, 563, L49
- Hulleman et al. (2000a) Hulleman, F., van Kerkwijk, M. H., & Kulkarni, S. R. 2000a, Nature, 408, 689
- Hulleman et al. (2004) Hulleman, F., van Kerkwijk, M. H., & Kulkarni, S. R. 2004, A&A, 416, 1037
- Hulleman et al. (2000b) Hulleman, F., van Kerkwijk, M. H., Verbunt, F. W. M., & Kulkarni, S. R. 2000b, A&A, 358, 605
- Hurley et al. (1999) Hurley, K., Cline, T., Mazets, E., Barthelmy, S., Butterworth, P., Marshall, F., Palmer, D., Aptekar, R., Golenetskii, S., Ill’lnskii, V., Frederiks, D., McTiernan, J., Gold, R., & Trombka, T. 1999, Nature, 397, 41
- Ibrahim et al. (2004) Ibrahim, A. I., Markwardt, C. B., Swank, J. H., Ransom, S., Roberts, M., Kaspi, V., Woods, P. M., Safi-Harb, S., Balman, S., Parke, W. C., Kouveliotou, C., Hurley, K., & Cline, T. 2004, ApJ, 609, L21
- Israel et al. (2003) Israel, G. L., Covino, S., Perna, R., Mignani, R., Stella, L., Campana, S., Marconi, G., Bono, G., Mereghetti, S., Motch, C., Negueruela, I., Oosterbroek, T., & Angelini, L. 2003, ApJ, 589, L93
- Israel et al. (2002) Israel, G. L., Covino, S., Stella, L., Campana, S., Marconi, G., Mereghetti, S., Mignani, R., Negueruela, I., Oosterbroek, T., Parmar, A. N., Burderi, L., & Angelini, L. 2002, ApJ, 580, L143
- Israel et al. (2004) Israel, G. L., Rea, N., Mangano, V., Testa, V., Perna, R., Hummel, W., Mignani, R., Ageorges, N., Lo Curto, G., Marco, O., Angelini, L., Campana, S., Covino, S., Marconi, G., Mereghetti, S., & Stella, L. 2004, ApJ, 603, L97
- Israel et al. (2004) Israel, G. L., Stella, L., Covino, S., Campana, S., Angelini, L., Mignani, R., Mereghetti, S., Marconi, G., & Perna, R. 2004, in Young Neutron Stars and Their Environments, IAU Symposium 218, ed. B. Gaensler & F. Camilo (San Francisco: Astronomical Society of the Pacific), in press (astro-ph/0310482)
- Kaspi et al. (2004) Kaspi, V., Gavriil, F., Woods, P., & Chakrabarty, D. 2004, The Astronomer’s Telegram, 298, 1
- Kaspi et al. (2003) Kaspi, V. M., Gavriil, F. P., Woods, P. M., Jensen, J. B., Roberts, M. S. E., & Chakrabarty, D. 2003, ApJ, 588, L93
- Kern & Martin (2002) Kern, B. & Martin, C. 2002, Nature, 415, 527
- Mereghetti et al. (2002) Mereghetti, S., Chiarlone, L., Israel, G. L., & Stella, L. 2002, in Neutron Stars, Pulsars and Supernova Remnants, ed. W. Becker, H. Lesch, & J. Trümper, 29
- Özel (2004) Özel, F. 2004, ApJ, submitted (astro-ph/0404144)
- Patel et al. (2001) Patel, S. K., Kouveliotou, C., Woods, P. M., Tennant, A. F., Weisskopf, M. C., Finger, M. H., Göğüş, E., van der Klis, M., & Belloni, T. 2001, ApJ, 563, L45
- Predehl & Schmitt (1995) Predehl, P. & Schmitt, J. H. M. M. 1995, A&A, 293, 889
- Rea et al. (2004) Rea, N., Israel, G. L., Testa, V., Stella, L., Mereghetti, S., Tiengo, A., Oosterbroek, T., Mangano, V., Campana, S., Covino, S., Curto, G. L., & Perna, R. 2004, The Astronomer’s Telegram, 284
- Rea et al. (2004) Rea, N., Testa, V., Israel, G. L., Mereghetti, S., Perna, R., Stella, L., Tiengo, A., Mangano, V., Oosterbroek, T., Mignani, R., Curto, G. L., Campana, S., & Covino, S. 2004, A&A, in press
- Stetson (1987) Stetson, P. B. 1987, PASP, 99, 191
- Thompson & Duncan (1996) Thompson, C. & Duncan, R. C. 1996, ApJ, 473, 322
- Thompson et al. (2002) Thompson, C., Lyutikov, M., & Kulkarni, S. R. 2002, ApJ, 574, 332
- Wang & Chakrabarty (2002) Wang, Z. & Chakrabarty, D. 2002, ApJ, 579, L33
- Woods et al. (2004) Woods, P. M., Kaspi, V. M., Thompson, C., Gavriil, F. P., Marshall, H. L., Chakrabarty, D., Flanagan, K., Heyl, J., & Hernquist, L. 2004, ApJ, 605, 378
| Date | Instrument | Exposure | Seeing | Band | Absorbed | Unabsorbed aa erg/s/cm2 for absorbed (Chapter 7 of Cox, 2000). |
|---|---|---|---|---|---|---|
| (min) | magnitude | ( erg/s/cm2) | ||||
| 2002 Jun. 21 | Gemini/NIRI | 19 | 20.41(7) | |||
| 2002 Jun. 28 | Gemini/NIRI | 12 | 20.96(14) | |||
| 2002 Aug. 18 | CFHT/AOB/KIR | 122 | 21.31(24) | |||
| 2003 Aug. 11 | Gemini/NIRI | 58 | 21.66(11) | |||
| 2003 Nov. 5 | Gemini/NIRI | 49 | 21.54(5) |
| Function | (erg/s/cm2) | (erg/s/cm2) | ||||
|---|---|---|---|---|---|---|
| X-ray PL | 37.1aaErrors scaled to infer uncertainties on the parameters. values reflect those before rescaling. | 1.0 | ||||
| IR PL | 7.1aaErrors scaled to infer uncertainties on the parameters. values reflect those before rescaling. | 1.0 | ||||
| X-ray excess | 97.3aaErrors scaled to infer uncertainties on the parameters. values reflect those before rescaling. | 1.0 | ||||
| IR excess | 1.4 | 0.5 |