Diffuse Interstellar Bands in NGC 1448††thanks: Based on observations collected at the European Southern Observatory, Paranal, Chile (ESO Programmes 67.D-0227 and 71.D-0033).
We present spectroscopic VLT/UVES observations of two emerging supernovae, the Type Ia SN 2001el and the Type II SN 2003hn, in the spiral galaxy NGC 1448. Our high resolution and high signal-to-noise spectra display atomic lines of Ca ii, Na i, Ti ii and K i in the host galaxy. In the line of sight towards SN 2001el, we also detect over a dozen diffuse interstellar bands (DIBs) within NGC 1448. These DIBs have strengths comparable to low reddening galactic lines of sight, albeit with some variations. In particular, a good match is found with the line of sight towards the type diffuse cloud (HD 144217). The DIBs towards SN 2003hn are significantly weaker, and this line of sight has also lower sodium column density. The DIB central velocities show that the DIBs towards SN 2001el are closely related to the strongest interstellar Ca ii and Na i components, indicating that the DIBs are preferentially produced in the same cloud. The ratio of the 5797 and 5780 DIB strengths (r 0.14) suggests a rather high UV field in the DIB environment towards SN 2001el. We also note that the extinction estimates obtained from the sodium lines using multiple line fitting agree with reddening estimates based on the colors of the Type Ia SN 2001el.
Key Words.:
supernovae: individual: SN 2001el, SN 2003hn – Galaxies: individual: NGC 1448 – Galaxies: ISM – ISM: lines and bandse-mail: jesper@astro.su.se
1 Introduction
1.1 Extragalactic DIBs
The Diffuse Interstellar Bands (DIBs) are a large number of absorption lines between Å that are superimposed on the interstellar extinction curve (e.g., Herbig 1995). During the last 7 decades of DIB studies almost 300 DIBs have been detected. Within the Milky Way, DIBs have been observed towards more than a hundred stars. However, there is still no definitive identification of the DIB carriers. Recent studies indicate that the environmental behaviors of DIBs reflect an interplay between ionization, recombination, dehydrogenation and destruction of chemically stable species (Herbig (1995); Cami et al. (1997); Voung & Foing (2000)). It is therefore of interest to study DIBs in different environments, especially in external galaxies.
Hitherto, only a handful of DIBs have been observed in extragalactic targets (e.g., Vladilo et al. (1987); Morgan (1987); Heckman & Lehnert (2000); Ehrenfreund et al. (2002)). The Magellanic Clouds have been most intensely studied in this respect. Detailed views of LMC DIBs were obtained towards the bright supernova (SN) 1987A (Vladilo et al. (1987)). Today, high resolution spectra can also be obtained of reddened stars in the LMC with large telescopes (Ehrenfreund et al. 2002). For more distant galaxies, however, supernovae still provide the most promising opportunity to probe the extragalactic interstellar medium. Spectra taken of SN 1986G in the nearby galaxy NGC 5128 (Rich (1987); D’Odorico et al. (1989)) allowed the detection of a few extragalactic DIBs outside the Local Group. Some DIBs were also tentatively detected towards SN 1989M in NGC 4579 (Steidel et al. (1990)).
In this paper we present high-resolution observations of two emerging supernovae in NGC 1448. The data of the well studied Type Ia SN 2001el allowed us to detect more than a dozen extragalactic DIBs with unprecedented signal-to-noise. At a different line-of-sight through the same galaxy, the Type II SN 2003hn did not show the same spectacular DIB signal.
1.2 SNe 2001el and 2003hn in NGC 1448
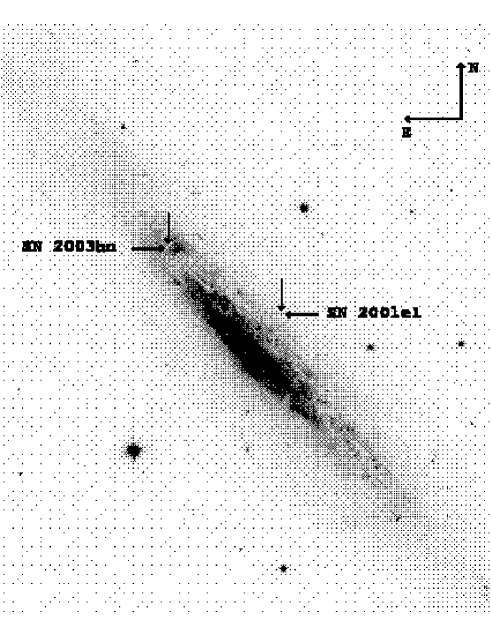
Supernova 2001el was discovered on September 17.1 (UT) 2001 (Monard (2001)). It was situated about 14″ West and 20″ North of the nucleus of the nearby warped spiral galaxy NGC 1448 (Fig. 1). Within our Target-of-Opportunity programme to carry out early high resolution spectroscopy of nearby supernovae (e.g., Lundqvist et al. (2004)), we obtained a first spectrum on September 21. This allowed a classification of the supernova as a Type Ia observed well before maximum (Sollerman et al. (2001)).
SN 2001el reached its maximum magnitude () on 2001 September 30, and thereby became the brightest supernova that year. This supernova has been well monitored both photometrically and spectroscopically, and has been shown to be a normal Type Ia supernova (Krisciunas et al. (2003)).
SN 2003hn was discovered in the same galaxy on August 25.7 2003 (Evans (2003)). It was located approximately 47″ East and 53″ North of the nucleus (Fig. 1). Spectroscopy showed this to be a Type II supernova approximately 2 weeks after explosion (Salvo et al. (2003)). In this case we were motivated by our previous detection of DIBs against SN 2001el in the very same galaxy. We therefore executed high-resolution spectroscopy also for SN 2003hn, to probe the interstellar matter in another line-of-sight in NGC 1448.
In Sect. 2 we will outline the observations and data reduction procedures. The results are then presented in Sect. 3 and discussed in Sect. 4. We summarize our conclusions in Sect. 5.
2 Observations and data reduction
All observations were obtained with the Ultraviolet and Visual Echelle Spectrograph (UVES)111www.eso.org/instruments/UVES/ on the second unit telescope (Kueyen) of the Very Large Telescope (VLT) on Paranal, Chile. UVES is a high-resolution two-arm cross-dispersed Echelle spectrograph, where both arms can be operated simultaneously using a dichroic beamsplitter (Kaufer et al. (2002)). This enables high efficiency from the atmospheric cutoff in the blue to the long-wavelength limit of the CCDs in the red.
On the night of September 21, we obtained 4 exposures of 2400 seconds each of SN 2001el. These were divided into two setups, in order to obtain a complete wavelength coverage. The log of all our observations of SN 2001el is given in Table 1. The supernova was observed again on September 26 and was revisited for the last time on September 28. The observations were thus obtained 9, 4 and 2 days before maximum light of the supernova.
The observations of SN 2003hn were obtained on August 31, 2003. We obtained 3 exposures of 1400 seconds each in both the red and blue set-ups. The details are given in Table 2. This supernova was only observed once, and since it was also at least one magnitude fainter than SN 2001el at the time of our observations, the signal-to-noise of the SN 2003hn data is not as good as for SN 2001el.
The spectra were interactively reduced using the UVES-pipeline222www.eso.org/observing/dfo/quality/ (versions 1.4.0 and 2.0) as implemented in . This reduction package allows for bias subtraction and flat-fielding of the data using calibration frames obtained in the morning. Wavelength calibration can be very accurately achieved by comparison to ThAr arc lamps.
In searching for the DIBs, we summed together all the observations from epochs 1 and 3 for SN 2001el, when applicable (see Table 1). The second epoch was not added to the final spectrum, since the exposure time was shorter and the seeing was worse at this epoch. For SN 2003hn all available data were combined.
3 Results
3.1 Interstellar atomic lines
Superposed on the spectra of SNe 2001el and 2003hn we detect interstellar atomic absorption lines, both from the Milky Way (MW; , ) and from NGC 1448. The detected lines are Ca II K&H (3933.66, 3968.47 Å), Na I D (5889.95, 5895.92 Å) and Ti II (3383.76 Å). K I (7664.90, 7698.96 Å) was also detected for SN 2001el, albeit with much weaker signal. The strongest components of these lines come from absorption within NGC 1448 (see Table 3).
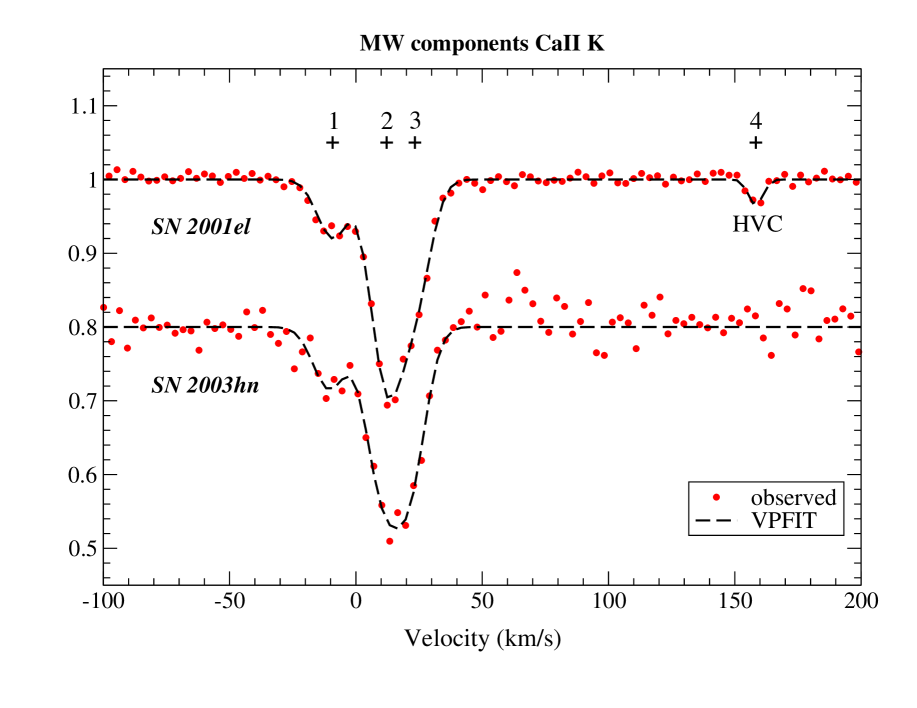
The Ca II H&K lines are clearly detected also in the MW. On the sky, the two lines-of-sight given by the two supernovae are separated by about 69 arcseconds. The MW line profiles also look very similar with two strong components centered at heliocentric radial velocities of about 10 to 20 km s-1 (Fig. 2; Table 3). Towards SN 2001el we also detect a high velocity component at 158 km s-1 which can not be seen in the noisier data obtained towards SN 2003hn.
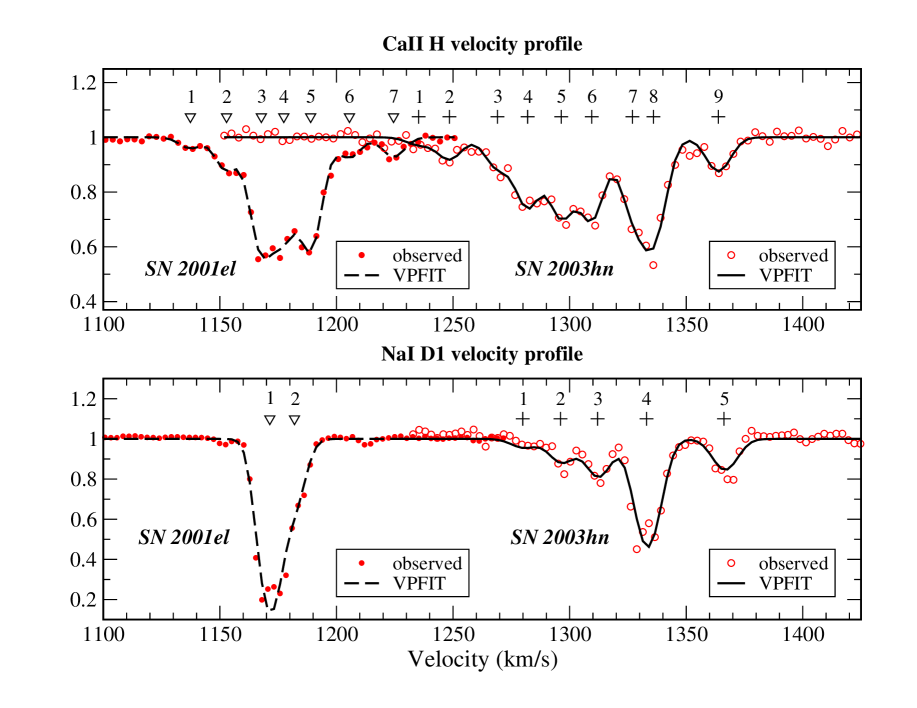
For the NGC 1448 components of Ca II H&K, the differences between the two lines of sight are apparent. Towards SN 2001el, the strongest components are redshifted by 1170 km s-1, while the strongest components towards SN 2003hn have a redshift of 1340 km s-1 (Fig. 3; Table 3). This is consistent with the measured heliocentric velocity of 1168 km s-1, with the difference between the two positions in the galaxy reflecting the rotation velocity (193 km s-1; Mathewson & Ford (1996)).
To further analyze these line profiles we have used the program VPFIT333By R. Carswell on www.ast.cam.ac.uk/rfc/vpfit.html which fits multiple Voigt profiles to multiple line components. We constrained all the lines (of the same species and ionization state) to have the same width, where the theoretical line is convolved with the instrument resolution (6 km s-1) before doing the fitting. The program adds components in an iterative way until an acceptable fit is found. This initial guess can then be adjusted interactively. The program uses a least-square fitting method to obtain the best fit, and in the end VPFIT provides velocities, widths and column densities for each line component of the ions. The obtained results are given in Table 3, and some fits performed by VPFIT are shown in Fig. 3.
3.2 Diffuse Interstellar Bands
A very interesting feature of our spectra is the abundance of extragalactic DIBs. We detect more than a dozen of bands throughout the spectra of SN 2001el. A list of detected lines, identifications, observed central wavelengths (), velocities (vDIB), equivalent widths (EW) and Full Width Half Maxima (FWHM) is given in Table 4.
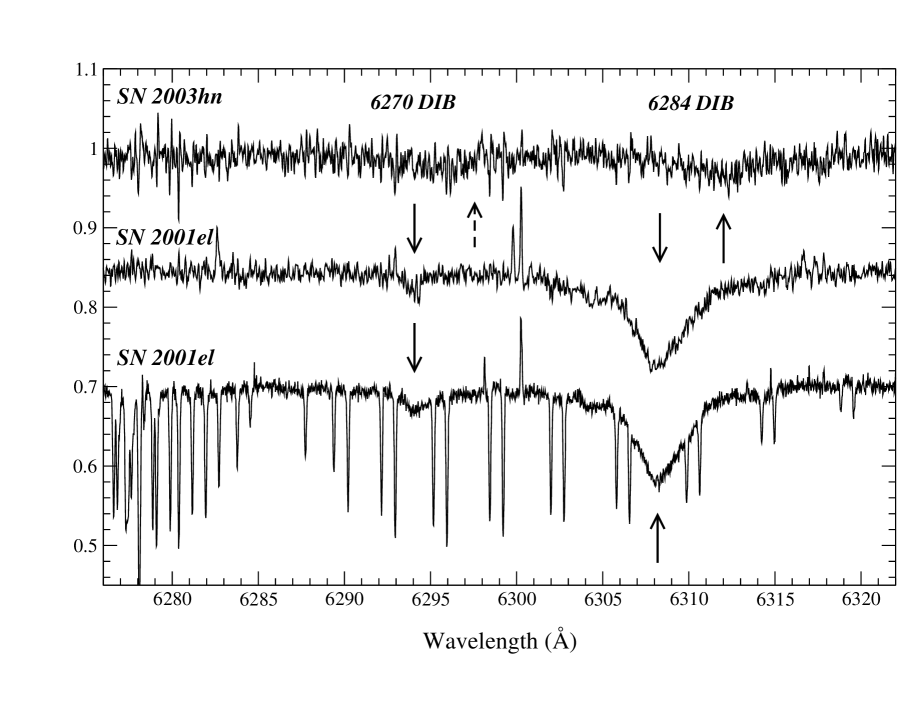
There are many advantages in searching for DIBs in an extragalactic supernova spectrum. All wavelengths are conveniently redshifted to avoid confusion with any MW components. In our spectra, we detect no DIBs from the MW. The strong DIB at 6284 is often blended with a telluric O2 complex in the MW. Here the DIB feature is redshifted to 6308 Å, and the high resolution clearly separates the narrow telluric lines (Fig. 4). There is also no contamination from intrinsic narrow lines that needs to be modeled in the supernova spectrum, as opposed to using stars as background sources. However, the supernova spectrum is made up of a superposition of numerous broad lines. This is well suited as a quasi-continuum against which to detect narrow DIBs, but very broad DIBs are not so easy to disentangle. We have therefore not been able to clearly identify DIBs with FWHM broader than 10 Å. For example, the usually very strong DIB at 4428 can not be securely identified. We emphasize that this is not to be interpreted as evidence for absence of such broad DIBs (see e.g., Ehrenfreund et al. (1997)).
The sample of lines listed in Table 4 were searched among the DIBs tabulated by Herbig (1995). From this table, we have searched and detected all the strong (EW200 mÅ) lines with FWHM7 Å between 4000 and 8000 Å. The line at 7724 only became obvious after division with a standard star to cancel out the telluric lines. All these 9 lines have a central depth (Ac) 0.07, as defined by Herbig (1995). We therefore searched also for all the other tabulated DIBs that meet this criterion.
Apart from the broad, shallow 4428 feature, as discussed above, we detect also the other 4 DIBs ( 6196, 6379, 6661 and 6993) with Ac0.07 in the wavelength range given above. This includes the narrow line at 6196, which is clearly detected. After applying the telluric correction we also detect the weak 6661 and 6993 DIBs. Six conspicious DIBs towards SN 2001el are displayed in Fig. 5. Longwards of 8000 Å, there are 3 potentially strong DIBs ( 8621, 9577 and 9632) according to the list of Herbig (1995), but we were unable to detect any of these lines. This region was only observed during our first epoch of observations. In this study we will use the clear detections to compare our observations with DIB observations in the MW and in other galaxies.
3.3 Extinction
There are many ways to estimate the amount of extinction towards an astronomical object. In supernova research, estimates are often made from the equivalent widths of the interstellar Na I D lines - even from low resolution spectroscopy (e.g., Turatto et al. 2003 and references therein). In this work we have high quality high resolution spectra and are able to deduce the actual column densities for these lines. Moreover, for Type Ia supernovae, an estimate of the reddening can be directly obtained from the supernova colors. Therefore, this dataset allows a comparison between the different methods.
3.3.1 Equivalent Width and Column densities
The use of the Na I D EW to estimate the amount of reddening (e.g., Barbon et al. (1990); Turatto et al. (2003)) often assumes that the effects of saturation are negligible. However, this is not valid for our observations. Table 5 shows our measurements of the EW and column densities towards the two SNe.
In this table we have first assumed an optically thin line for which the column density is directly proportional to the equivalent width (e.g., Spitzer (1978)). In the lower part of this table we also show the results from the so called doublet ratio (DR) technique (e.g., Somerville (1988)), as well as the total column densities derived with VPFIT. It is clear that the optically thin approximation is not valid for the saturated doublet lines towards NGC 1448. Taking the saturation into account via either the DR method or the component fitting procedure (VPFIT) gives column densities that are mutually consistent. A simple Na I D EW approach to estimate the amount of reddening towards a supernova can thus give substantial errors (see also discussions by e.g., Munari & Zwitter (1997), Fassia et al. (2000) and Smartt et al. (2002)). We will use the column densities derived by VPFIT to estimate the amount of reddening below.
3.3.2 Estimate of
Adopting the relation from Hobbs (1974) we can use our measured sodium column densities to directly derive the reddenings towards the supernovae. This gives and 0.12 mags for SN 2001el and SN 2003hn, respectively. The values for the MW components are and 0.017 mags, respectively. For the MW components we can directly compare this to the value derived by Schlegel et al. (1998), mag.
Alternatively (following e.g., Fassia et al. (2000)), one can convert the sodium column density to hydrogen column density (Ferlet et al. (1985)) assuming a MW gas-to-dust ratio, and then derive the color excess (Bohlin et al. (1978)). This gives mag towards SN 2001el.
Another way to measure the reddening towards SN 2001el is from the supernova light curve itself. It has been established that Type Ia supernovae display a uniform intrinsic color evolution from 30 to 90 days past maximum (Lira (1995); Phillips et al. (1999)). The light curve of SN 2001el has been very well monitored by Krisciunas et al. (2003). They obtained various estimates of the color excess using the intrinsic color of the supernova. Using the light curve tail, a value of mag is reported, whereas an average of all the six different methods used by Krisciunas et al. gives mag. Here the error is a combination of the propagated errors of the different estimates and the standard deviation in the estimates themselves. When we compare this with the total reddening towards SN 2001el derived from the sodium lines, we find a good agreement within the errors. Below we will use mag for SN 2001el. This value encapsulates most of the estimates given in this section.
4 Discussion
4.1 Line profiles
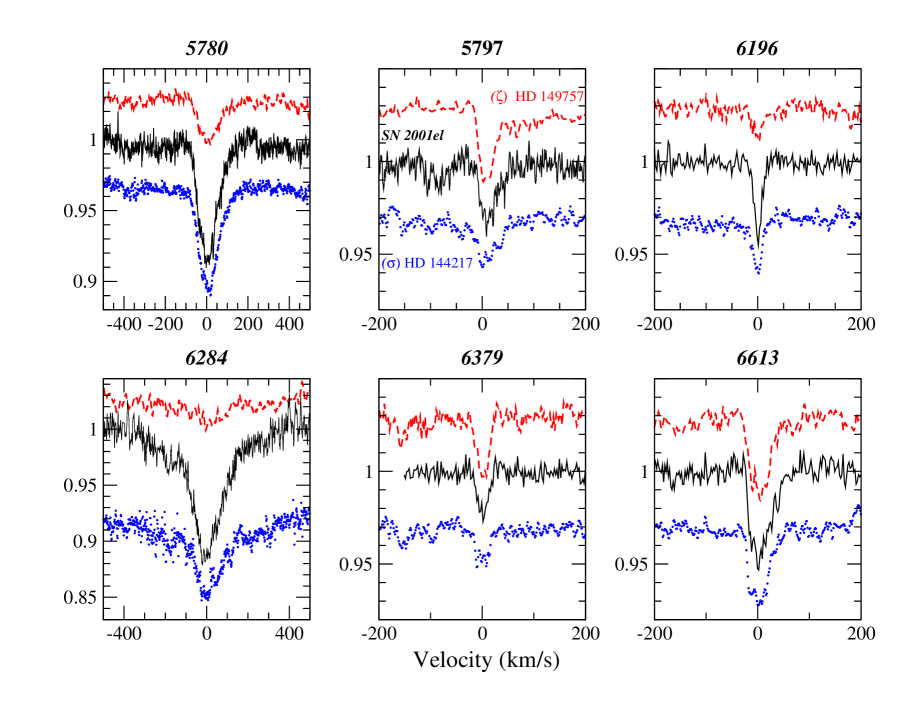
In Fig. 5 we show the line profiles of several conspicuous DIBs in NGC 1448. The spectra are shown in velocity scale in kilometers per second with respect to the central wavelength indicated in the figure.
The 6613 line exhibits a much steeper blue side of the profile, and this can also be perceived, for example, in the 5797 line. The 6284 and 5780 DIBs have quite similar line profiles, and are clearly not simple Gaussians. The observed profiles actually show a strong resemblance to those seen towards galactic single cloud lines of sight. To illustrate this we also show two typical galactic lines of sight that represent the so called (HD 144217) and (HD 149757) type diffuse clouds (see e.g., Krelowski & Sneden (1995)). These galactic spectra were obtained with the FEROS instrument by one of us (LK). These lines of sight have of 0.20 mag and 0.32 mag, respectively. Note that the SN 2001el DIBs show the same asymmetries in the profiles as the MW DIBs.
4.2 DIB velocities
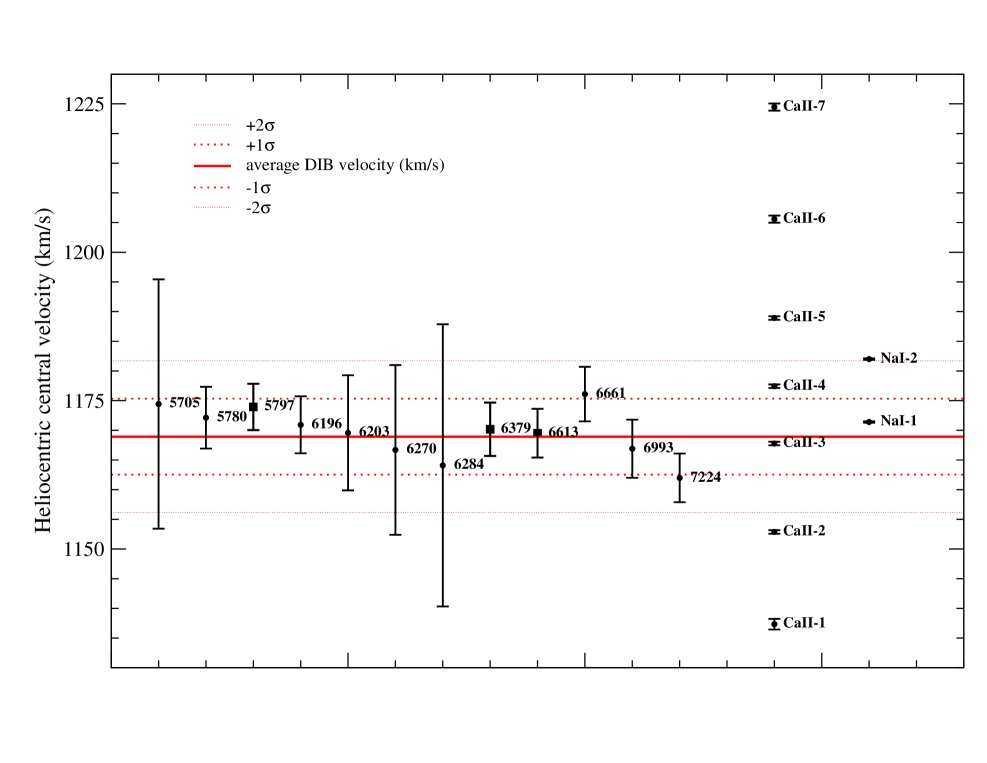
In Fig. 6 we explore the link between DIB velocities and atomic line velocities. It is clear that the DIB carriers (of the narrow DIBs) are, in velocity, closely related to the strongest Ca II and Na I line components. The four narrowest DIBs ( 6379, 6613, 6661 and 6993) have well determined central velocities that can be assigned, within the errors, to components 3 and 1 of the Ca II and Na I profiles, respectively. This velocity coincidence indicates that the carriers of these DIBs are physically associated, and probably located within the same cloud in NGC 1448.
Since we also observe no broadening of the profiles with respect to the single cloud DIBs towards HD 144217 and HD 149757 (Fig. 5) we conclude that the DIBs towards SN 2001el primarily form in a single gas-rich layer, indicated by these strong absorption components of ionized Ca and neutral Na.
4.3 DIB ratios
Two potentially important DIBs for the determination of the ionization balance are the ones at 5797 and 5780. According to Cami et al. (1997) the 5780 DIB has a higher ionization potential than the 5797 DIB, and thus reaches its maximum only with a stronger UV field. For SN 2001el the 5780 DIB is very strong compared to the 5797 DIB. This behavior is indicative of a so called type cloud like environment (Fig. 5). In such a cloud Ca I and simple interstellar molecules (CH, CN) are very weak or undetectable. This is also true for our observations, where the upper limits on CH, CN are 7 and 10 mÅ , respectively.
From Table 4 we can compare the 5797/5780 ratio for different galactic and extragalactic targets. The denser single cloud towards HD 149757 has a relatively high ratio (), while for NGC 1448, the LMC and HD 144217 we see ratios of about 0.15, which within the interpretation of Cami et al. (1997), indicate a somewhat higher UV field.
4.4 Extragalactic DIBs
As mentioned in the introduction, extragalactic DIBs have only been observed in a few cases. In this study the quality of the data allows a detailed comparison with the DIBs in the Milky Way.
For SN 2001el we compare all the DIBs with an ’average cloud’ in the MW as given in Table 4. Although the DIBs against SN 2001el appear relatively strong, this could just be due to the uncertainty in the determination of the reddening. The DIB strengths would be similar to those of the average cloud for an mag, which is still within the error budget.
In fact, as illustrated in Fig. 5 and given in Table 4, we find that the properties of the DIBs in NGC 1448 closely mimic those observed towards HD 144217. Both the line profiles and the relative strengths are similar for these lines of sight, illustrating the potential for studying how DIB carriers behave in different extragalactic environments. It could also indicate that very similar local environmental conditions pretain in those different lines of sight.
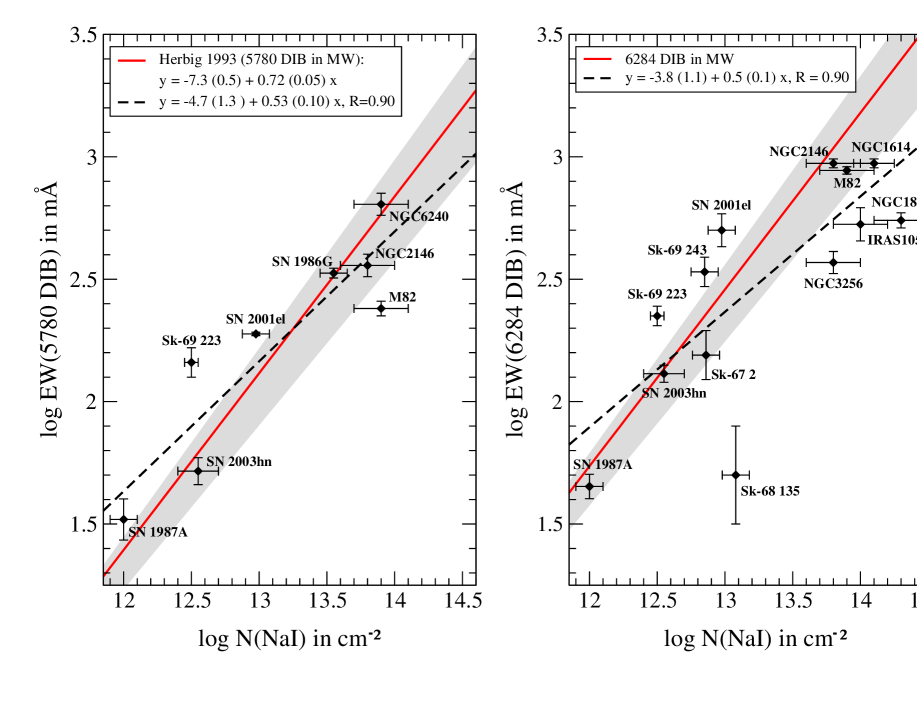
We have also compiled a sample of extragalactic DIBs to compare with the properties of the MW DIBs. In Fig. 7 we extend the exercise of Heckman & Lehnert (2000) and plot the EW of the 5780 and 6284 DIBs versus the total sodium column density. The extra galactic sight lines show, for their respective reddenings, similar EWs compared to the galactic average. In the left panel we have not included the detections classified as tentative by Heckman & Lehnert (2000). These would appear significantly below the fitted line.
Herbig (1995) summarized that extragalactic DIBs did not show conclusive evidence for any variation of DIB strengths versus color excess, partly due to the large scatter in the Galactic data. This seems to hold also for the data presented here.
4.5 Location of the absorbing gas
The information we have gathered could potentially provide some clues on the location and origin of the material in which the DIBs are produced. It may even be of interest to investigate to which extent this material is physically connected to the local supernova environment.
Jenkins et al. (1984) noted for SN 1983N that the presence of neutral sodium and singly ionized calcium argue against absorbing gas close to the supernova location. Since towards SN 2001el these ISM lines are correlated with the DIBs (Fig. 6) the same argument would imply that the DIBs are not directly located in the supernova environment. Also, we measure no variability in the DIBs between the two epochs (e.g., the EW for the 6613 DIB is stable to about 6%). This does not favor a scenario were the DIBs are produced in gas closely associated with the supernova itself, and is consistent with conclusions from supernovae Type Ia investigations arguing that the dust dimming the supernovae is generally interstellar rather than circumstellar (e.g., Riess et al. (1996)).
The ToO programme behind these data has also observed a few other supernovae of various types; SNe 2000cx (Type Ia), 2001ig (IIb), 2003bg (II). None of these showed any signatures () of the strongest DIBs ( 5780, 6284). SNe 2000cx and 2001ig would have revealed bands similar in strength to those seen towards SN 2003hn. In the noisier spectrum of SN 2003bg we would only have detected () bands as strong as those seen towards SN 2001el.
For the other supernovae where DIBs have been seen (SNe 1986G, 1987A, 1989M) there is also no clear correlation between the DIB strengths and the supernova type.
To truly compare the different supernova sight lines would require a more thorough investigation of the host galaxies, including for example their metallicities. This is beyond the scope of this investigation - where the main aim was instead to demonstrate the potential of probing DIBs in external galaxies using supernovae as transitory luminous probes for high resolution spectroscopy.
5 Conclusions
Using high resolution spectroscopy of two emerging supernovae in NGC 1448 we have detected a number of extragalactic atomic interstellar lines. Towards SN 2001el we also detected a large number of Diffuse Interstellar Bands.
We have compared the properties of the DIBs in NGC 1448 with those of the DIBs observed both in our own Galaxy and in other galaxies. These observations probe the most distant system where a larger number of DIBs has been analyzed in such a detail. These DIBs show many similarities with DIBs within the Milky Way, especially with those seen towards the -type cloud HD 144217. This shows the potential for modern telescopes to investigate how DIB carriers follow common chemical and physical pathways throughout the universe.
We have shown that the DIBs towards SN 2001el are associated in velocity space with specific components of the atomic interstellar lines. We observe no DIB strength time variability on time scales shorter than a week, nor do we see any direct connection between DIB properties and supernova type.
We have also probed the extinction towards the supernovae in several
different ways.
Taking the saturation of the interstellar sodium lines
into account in our high-resolution data gives a reddening
estimate consistent with color excess measurements from the Type Ia
SN 2001el itself.
Acknowledgements. These observations were obtained in ToO service mode at the VLT. We wish to thank the Paranal staff for all the help. We also thank J. Fynbo for comments on the manuscript. C. Fransson, E. Baron and K. Nomoto were helpful in writing the original UVES proposals. NC acknowledges NOVA for financial support and SM acknowledges financial support from the “Physics of Type Ia SNe” RTN.
References
- Barbon et al. (1990) Barbon, R., Benetti, S., Rosino, L., Cappellaro, E., & Turatto, M. 1990, A&A, 237, 79
- Bohlin et al. (1978) Bohlin, R. C., Savage, B. D., & Drake, J. F. 1978, ApJ, 224, 132
- Cami et al. (1997) Cami, J., Sonnentrucker, P., Ehrenfreund, P., & Foing, B. H. 1997, A&A, 326, 822
- D’Odorico et al. (1989) D’Odorico, S., di Serego Alighieri, S., Pettini, M., et al. 1989, A&A, 215, 21
- Ehrenfreund et al. (1997) Ehrenfreund, P., Cami, J., Dartois, E., & Foing, B. H. 1997, A&A, 317, L28
- Ehrenfreund et al. (2002) Ehrenfreund, P., Cami, J., Jim nez-Vicente, J., et al. 2002, ApJ, 576, 117
- Evans (2003) Evans, R. 2003, IAUC, 8186
- Fassia et al. (2000) Fassia, A., Meikle, W. P. S., Vacca, W. D., et al. 2000, MNRAS, 318, 1093
- Ferlet et al. (1985) Ferlet, R., Vidal-Madjar, A., & Gry, C. 1985, ApJ, 298, 838
- Galazutdinov et al. (2000) Galazutdinov, G. A., Musaev, F. A., Krełowski, J. & Walker, G. A. H. 2000, PASP, 112, 648
- Heckman & Lehnert (2000) Heckman, T. M., & Lehnert, M. D. 2000, ApJ, 537, 690
- Herbig (1995) Herbig, G. H. 1995, ARA&A, 33, 19
- Hobbs (1974) Hobbs, L. M. 1974, ApJ, 191, 381
- Jenkins et al. (1984) Jenkins, E. B., Rodgers, A. W., Harding, P., Morton, D. C., & York, D. G. 1984, ApJ, 281, 585
- Jenniskens & Desert (1994) Jenniskens, P., & Desert, F.-X. 1994, A&AS, 106, 39
- Kaufer et al. (2002) Kaufer, A., D’Odorico, S., & Kaper L. 2002, UVES manual
- Krelowski & Sneden (1995) Krełowski, J., & Sneden, C. 1995, in ”Diffuse Interstellar Bands”, eds. Tielens & Snow, Kluwer Academic Publisher, p. 13
- Krisciunas et al. (2003) Krisciunas, K., Suntzeff, N. B., Candia, P., et al. 2003, AJ, 125, 166
- Lira (1995) Lira, P. 1995, Masters thesis, Univ. Chile
- Lundqvist et al. (2004) Lundqvist, P., Mattila, S., Sollerman, J., et al. 2004, To appear in Proceedings ”Supernovae”, IAU Colloquium 192, eds. J. M. Marcaide & K. W. Weiler, (astro-ph/0309006)
- Mathewson & Ford (1996) Mathewson, D. S., & Ford, V. L. 1996, ApJS, 107, 97
- Monard (2001) Monard, A. G. 2001, IAUC, 7721
- Morgan (1987) Morgan, D. H. 1987, QJRAS, 28, 328
- Munari & Zwitter (1997) Munari, U., & Zwitter, T. 1997, A&A, 318, 269
- Nugent et al. (2002) Nugent, P., Kim, A., & Perlmutter, S. 2002, PASP, 114, 803 592
- Phillips et al. (1999) Phillips, M. M., Lira, P., Suntzeff, N. B., Schommer, R. A., Hamuy, M., & Maza, J. 1999, AJ, 118, 1766
- Rich (1987) Rich, M. R. 1987, AJ, 94, 651
- Riess et al. (1996) Riess, A. G., Press, W. H., & Kirshner, R. P. 1996, ApJ, 473, 588
- Salvo et al. (2003) Salvo, M., Bessel, M., & Schmidt, B. 2003, IAUC 8187
- Schlegel et al. (1998) Schlegel, D. J., Finkbeiner, D. P., & Davis, M. 1998, ApJ, 500, 525
- Smartt et al. (2002) Smartt, S., Gilmore, G. F., Tout, C. A., & Hodgkin, S. T. 2002, ApJ, 565, 1089
- Sollerman et al. (2001) Sollerman, J., Leibundgut, B., & Lundqvist, P. 2001, IAUC, 7723
- Somerville (1988) Somerville, W. B. 1988, The Observatory, 108, 44
- Spitzer (1978) Spitzer, L. 1978, Physical processes in the interstellar medium (Interscience: New York Wiley)
- Steidel et al. (1990) Steidel, C. C., Rich, R. M., & McCarthy, J. K. 1990, AJ, 99, 1476
- Turatto et al. (2003) Turatto, M., Benetti, S., & Cappellaro, E. 2003, in From Twilight to Highlight - The Physics of Supernovae, Eds. W. Hillebrandt & B. Leibundgut, p. 200 (astro-ph 0211219)
- Vidal-Majar et al. (1987) Vidal-Madjar, A., Andreani, P., Cristiani, S., et al. 1987, A&A, 177, 17
- Vladilo et al. (1987) Vladilo, G., Crivellari, L., Molaro, P., & Beckman, J. E. 1987, A&A, 182, 59
- Voung & Foing (2000) Voung, M. H., & Foing, B. H. 2000, A&A, 363, 5
| Date | MJD | Exp. | Airmass | Seeinga | Set-up | Slit width |
|---|---|---|---|---|---|---|
| (01 09) | (52000+) | (s) | (arcsec) | (arcsec) | ||
| 21 | 173.22 | 2400 | 1.30 | 0.82 | 390+564b | 0.8 |
| 21 | 173.25 | 2400 | 1.19 | 0.79 | 390+564 | 0.8 |
| 21 | 173.28 | 2400 | 1.12 | 0.65 | 437+860c | 0.8 |
| 21 | 173.31 | 2400 | 1.08 | 0.85 | 437+860 | 0.8 |
| 26 | 178.36 | 1200 | 1.10 | 1.43 | 346+580d | 0.7 |
| 26 | 178.39 | 1200 | 1.12 | 1.43 | 346+580 | 0.7 |
| 28 | 180.22 | 3000 | 1.20 | 1.05 | 390+564 | 0.8 |
| 28 | 180.26 | 3000 | 1.11 | 1.08 | 390+564 | 0.8 |
| 28 | 180.29 | 3000 | 1.07 | 1.12 | 390+564 | 0.8 |
| a Seeing from the DIMM-monitor. |
| b Setting 390+564 covers wavelength ranges 3260-4450, 4580-6680 Å. |
| c 437+860 covers wavelength ranges 3730-4990, 6600-10600. |
| d 346+580 covers wavelength ranges 3030-3880, 4760-6840. |
| Date | MJD | Exp. | Airmass | Seeinga | Set-up | Slit width |
|---|---|---|---|---|---|---|
| (03 08) | (52000+) | (s) | (arcsec) | (arcsec) | ||
| 31 | 882.26 | 1400 | 1.42 | 0.57 | 390+564b | 0.8 |
| 31 | 882.28 | 1400 | 1.32 | 0.61 | 390+564 | 0.8 |
| 31 | 882.30 | 1400 | 1.25 | 0.52 | 390+564 | 0.8 |
| 31 | 882.33 | 1400 | 1.15 | 0.51 | 437+860c | 0.8 |
| 31 | 882.34 | 1400 | 1.11 | 0.55 | 437+860 | 0.8 |
| 31 | 882.36 | 1400 | 1.09 | 0.53 | 437+860 | 0.8 |
| a Seeing from the DIMM-monitor. |
| b Setting 390+564 covers wavelength ranges 3260-4450, 4580-6680 Å. |
| c 437+860 covers wavelength ranges 3730-4990, 6600-10600. |
| Linea | Component | b | log | total log | ||
|---|---|---|---|---|---|---|
| (km s-1) | (km s-1) | (cm-2) | (cm-2) | |||
| MW components: | ||||||
| SN 2001el | Ca ii | 1 | 23.3 0.3 | 7.6 0.3 | 11.57 0.03 | } 12.12 0.03 |
| Ca ii | 2 | 12.2 0.3 | 11.86 0.02 | |||
| Ca ii | 3 | -9.2 0.6 | 11.28 0.02 | |||
| Ca ii | 4 | 158.4 1.2 | 1.7 4.1 | 10.60 0.08 | } 10.60 0.08 | |
| Ti ii | 1 | 11.2 12.0 | 9.7 7.3 | 11.59 0.63 | } 11.83 0.50 | |
| Ti ii | 2 | 21.4 8.1 | 11.45 0.82 | |||
| Na i | 1 | 17.2 0.6 | 10.1 1.0 | 11.21 0.03 | } 11.21 0.03 | |
| SN 2003hn | Ca ii | 1 | 20.74 1.2 | 8.0 1.3 | 11.75 0.09 | } 12.12 0.06 |
| Ca ii | 2 | 10.0 1.8 | 11.73 0.09 | |||
| Ca ii | 3 | -10.7 1.8 | 11.32 0.07 | |||
| Na i | 1 | 19.3 1.2 | 5.9 1.9 | 11.04 0.08 | } 11.04 0.08 | |
| NGC 1448 components: | ||||||
| SN 2001el | Ca ii | 1 | 1137.3 0.9 | 5.3 0.2 | 11.08 0.06 | } 12.79 0.01 |
| Ca ii | 2 | 1152.9 0.3 | 11.64 0.02 | |||
| Ca ii | 3 | 1167.8 0.3 | 12.26 0.02 | |||
| Ca ii | 4 | 1177.4 0.3 | 12.17 0.02 | |||
| Ca ii | 5 | 1188.9 0.3 | 12.26 0.01 | |||
| Ca ii | 6 | 1205.6 0.6 | 11.38 0.03 | |||
| Ca ii | 7 | 1224.5 0.6 | 11.33 0.03 | |||
| Na i | 1 | 1171.4 0.1 | 5.0 0.2 | 12.68 0.03 | } 12.76 0.03 | |
| Na i | 2 | 1182.0 0.1 | 11.96 0.03 | |||
| Ti ii | 1 | 1148.0 3.6 | 12.9 3.4 | 11.78 0.11 | } 12.69 1.40 | |
| Ti ii | 2 | 1174.7 25.5 | 12.40 1.98 | |||
| Ti ii | 3 | 1181.6 18.6 | 12.15 3.42 | |||
| Ti ii | 4 | 1203.1 6.9 | 11.64 0.32 | |||
| K i | 1 | 1166.6 0.6 | 1.4 0.9 | 11.02 0.07 | } 11.29 0.05 | |
| K i | 2 | 1175.6 0.6 | 10.96 0.06 | |||
| SN 2003hn: | Ca ii | 1 | 1235.3 3.6 | 6.9 0.5 | 11.08 0.16 | } 12.89 0.03 |
| Ca ii | 2 | 1248.5 1.5 | 11.42 0.08 | |||
| Ca ii | 3 | 1269.0 1.5 | 11.70 0.07 | |||
| Ca ii | 4 | 1282.0 0.9 | 12.03 0.04 | |||
| Ca ii | 5 | 1296.4 0.9 | 12.14 0.03 | |||
| Ca ii | 6 | 1309.5 0.6 | 12.14 0.03 | |||
| Ca ii | 7 | 1326.9 1.5 | 12.17 0.11 | |||
| Ca ii | 8 | 1335.9 0.9 | 12.06 0.12 | |||
| Ca ii | 9 | 1363.8 0.6 | 11.64 0.04 | |||
| Na i | 1 | 1279.9 1.5 | 6.4 0.2 | 11.08 0.08 | } 12.55 0.01 | |
| Na i | 2 | 1296.1 0.6 | 11.53 0.03 | |||
| Na i | 3 | 1312.0 0.3 | 11.75 0.02 | |||
| Na i | 4 | 1333.0 0.3 | 12.32 0.01 | |||
| Na i | 5 | 1366.2 0.3 | 11.65 0.02 | |||
| Ti ii | 1 | 1281.7 0.9 | 6.8 0.8 | 12.17 0.06 | } 12.64 0.04 | |
| Ti ii | 2 | 1293.4 1.5 | 11.84 0.11 | |||
| Ti ii | 3 | 1324.6 1.2 | 12.01 0.07 | |||
| Ti ii | 4 | 1337.5 0.9 | 12.07 0.06 | |||
| a | We use the doublet lines of Ca ii, Na i and K i to constrain the least square fitting routine employed by VPFIT. |
|---|---|
| b | The doppler parameter, , has for each atomic line been set equal for all components. |
| DIB | NGC1448 | Average c | HD 144217d | HD 149757d | LMC e | SN 1986G f | |||
| a | vDIB | EW | FWHM | EWscaled | EW | EW | EW | EW | |
| (Å) | (Å) | (km s-1) | (mÅ) | (Å) | (mÅ) | (mÅ) | (mÅ) | (mÅ) | (mÅ) |
| SN 2001el: | |||||||||
| 5705.20 | 5727.55 | 1174.4 21.0 | 37 5 | 2.23 | 17 | 93 | – | 20 9 | 79 5 |
| 5780.37 | 5802.97 | 1172.1 5.2 | 189 3 | 2.04 | 104 | 160 | 66 | 145 21 | 335 5 |
| 5796.97 | 5819.67 | 1173.9 3.9 | 26 2 | 0.75 | 24 | 22 | 27 | 28 6 | 151 5 |
| 6195.97 | 6220.17 | 1170.9 4.8 | 15 2 | 0.37 | 11 | 20 | 10 | 10 3 | 30 15 |
| 6203.08b | 6227.28 | 1169.6 9.7 | 26 3 | 1.35 | 19 | } 66 | 11 | 50 20 | 191 5 |
| 6204.66b | 6228.50 | 1151.9 9.7 | 76 4 | 4.6 | 34 | 18 | included in 6203 | ||
| 6269.75 | 6294.15 | 1166.7 14.3 | 35 8 | 1.65 | 14 | 23 | 10 | 4 8 | – |
| 6283.85g | 6308.25 | 1164.1 23.8 | 500 80 | 2.5 | 111 | 390 | 111 | 225 21 | – |
| 6379.29 | 6404.19 | 1170.2 4.5 | 12 3 | 0.48 | 14 | 14 | 24 | 55 14 | 75 8 |
| 6613.56 | 6639.36 | 1169.5 4.1 | 52 3 | 1.00 | 42 | 40 | 43 | 19 6 | – |
| 6660.64 | 6686.77 | 1176.1 4.6 | 13 5 | 0.70 | 9 | – | – | – | – |
| 6993.18 | 7020.58 | 1166.9 4.9 | 23 7 | 0.79 | 21 | – | – | – | – |
| 7223.96 | 7251.96 | 1162.0 4.1 | 74 5 | 0.90 | 47 | – | – | – | – |
| SN 2003hn: | |||||||||
| 5780.37 | 5805.3 | 1293.0 40 | 52 7 | 2.4 | |||||
| 6283.85 | 6311.9 | 1338.2 52 | 130 11 | 5.0 | |||||
| a | Included are DIBs with A from the table of Herbig (1995). Rest wavelengths from the Galazutdinov et al. (2000) survey. |
|---|---|
| b | The 6203.10 and 6204.27 DIBs are two partly overlapping DIBs, which are sometimes taken to be a single DIB feature. |
| c | DIB equivalent width for the MW “average diffuse cloud” (Jenniskens & Desert 1994) scaled to mag, i.e. that within the host galaxy towards SN 2001el. |
| d | Galactic lines of sight with 0.20 and 0.32 mag for HD 144217 and HD 149757, respectively. Data from FEROS program 64.H-0224 obtained by one of us (LK). |
| e | Values for Sk-69 223, mag, from Cox et al. (in preparation). |
| f | From D’Odorico et al. (1989), Note revised mag (Nugent et al. (2002)). The equivalent width given for 6203 includes also the 6204 DIB, and the 6379 DIB equivalent width includes the 6376 DIB. |
| g | The FWHM applies to the strong “narrow” component of the 6284 Å DIB. The EW includes the broader underlying component. |
| Supernovae in NGC 1448: Interstellar Atomic Lines | |||||
|---|---|---|---|---|---|
| SN 2001el | SN 2003hn | ||||
| Line | EW | log | EW | log | |
| (mÅ) | (cm-2) | (mÅ) | (cm-2) | ||
| Ca ii K | MW | 104(1) | 12.04 | 104(4) | 12.04 |
| NGC | 366(2) | 12.59 | 525(6) | 12.75 | |
| Ca ii H | MW | 54(1) | 12.06 | 60(6) | 12.10 |
| NGC | 220(1) | 12.67 | 320(7) | 12.83 | |
| Na i D2 | MW | 37(1) | 11.27 | 35(4) | 11.25 |
| NGC | 367(2) | 12.27 | 503(5) | 12.41 | |
| Na i D1 | MW | – | – | – | – |
| NGC | 302(2) | 12.49 | 289(7) | 12.47 | |
| column density log (cm-2) | |||||
| Line | DR | VPFIT | DR | VPFIT | |
| Ca ii | MW | 12.07 | 12.12 0.05 | 12.17 | 12.12 0.14 |
| NGC | 12.76 | 12.79 0.08 | 12.93 | 12.89 0.20 | |
| Na i | NGC | 12.88 | 12.76 0.04 | 12.52 | 12.55 0.09 |