Hard X-ray emitting Active Galactic Nuclei selected by the Multi-wavelength Project
Abstract
We present X-ray and optical analysis of 188 AGN identified from 497 hard X-ray (f erg cm-2 s-1 ) sources in 20 fields (1.5 deg2) forming part of the Multi-wavelength Project. These medium depth X-ray observations enable us to detect a representative subset of those sources responsible for the bulk of the 2–8 keV Cosmic X-ray Background. Brighter than our optical spectroscopic limit, we achieve a reasonable degree of completeness (77% of X-ray sources with counter-parts 22.5 have been classified): broad emission line AGN (62%), narrow emission line galaxies (24%), absorption line galaxies (7%), stars (5%) or clusters (2%). We find that most X-ray unabsorbed AGN ( cm-2) have optical properties characterized by broad emission lines and blue colors, similiar to optically-selected quasars from the Sloan Digital Sky Survey but with a slighly broader color distribution. However, we also find a significant population of redder (–) AGN with broad optical emission lines. Most of the X-ray absorbed AGN (10 cm-2) are associated with narrow emission line galaxies, with red optical colors characteristically dominated by luminous, early type galaxy hosts rather than from dust reddening of an AGN. We also find a number of atypical AGN; for instance, several luminous AGN show both strong X-ray absorption ( cm-2) and broad emission lines. Overall, we find that 81% of X-ray selected AGN can be easily interpreted in the context of current AGN unification models. Most of the deviations seem to be due to an optical contribution from the host galaxies of the low luminosity AGN.
Subject headings:
X-rays: galaxies — galaxies: active — quasars: general — surveys1. Introduction
In the era of and , X-ray surveys of the extragalactic universe are for the first time able to probe the demographics and evolution of the AGN population irrespective of any moderate obscuration. Current deep surveys such as the CDF-N (Barger et al., 2002), CDF-S (Tozzi et al., 2001) and the Lockman Hole (Mainieri et al., 2002) are unveiling both bright quasars and lower luminosity Seyfert galaxies with significant absorbing gas columns. This obscuration can be large enough to effectively hide any optical signature of an active nucleus. With the unprecedented sensitivity and resolving power of these current observatories, we are able to probe large volumes to determine the prevalence of X-ray emitting AGN and their evolution.
The study of AGN enshrouded by dust and gas is not new. Obscured AGN (e.g., narrow line radio galaxies, Seyfert 2s, IRAS sources) have been under investigation for many years, though a complete census of the population has been out of reach. The spectrum of the Cosmic X-ray Background (CXRB) has provided evidence of the preponderance of the hidden AGN population. While has shown that unabsorbed AGN dominate the soft (0.1–2 keV) CXRB (Hasinger et al., 1998), its high energy spectrum (2–30 keV) is harder than that of known AGN. Models based on the CXRB spectrum and the X-ray luminosity function have predicted the existence of large numbers of heavily obscured AGN that have been missed in past surveys (Comastri et al., 1995; Gilli et al., 2001).
How do these sources fit into the AGN unification scheme (e.g., Antonucci 1993; Antonucci & Miller 1985)? Many of the absorbed X-ray sources lack optical AGN signatures (e.g. Barger et al. 2003). Is this a result of host dilution (Moran, Filippenko & Chornock, 2002) or some other geometry/structure that prevents us from viewing the emission line gas? While optical extinction and X-ray absorption are statistically correlated (Smith & Done, 1996; Turner et al., 1997), there are a number of counter examples. X-ray observations of Seyfert 2 galaxies do not always provide evidence for a large intrinsic obscuring column (Panessa & Bassani 2002; Georgantopoulos & Zezas 2003). Equally compelling, a number of X-ray selected type 1 AGN (Mainieri et al., 2002; Akylas et al., 2003) have significant intrinsic absorption in the X-ray band ( cm-2). Wilkes et al. (2002) find that a large fraction of the IR selected AGN found in the Two-Micron All Sky Survey (2MASS) have broad optical emission lines and a wide range of X-ray absorption. Given the complex environment of some of these AGN, one line of sight might not always exemplify the overall geometry.
While the and deep fields do cover a large volume, wide field surveys are needed to compile a significant sample of sources with 2–8 keV flux levels around erg cm-2 s-1 . Such sources comprise most of the flux of the 2–8 keV CXRB (Moretti et al., 2003; Cowie et al., 2002). The deep fields provide relatively few sources at these flux levels to characterize the absorbed AGN population. Many ongoing surveys at intermediate flux levels are currently contributing to our understanding of the X-ray emitting AGN. For example, the HELLAS2XMM (Fiore et al., 2003) and XMM/SSC (Barcons et al., 2003) take advantage of the large field of view and high collecting area of . The SEXSI (Harrison et al., 2003) survey joins the Multi-wavelength Project in utilizing ’s small PSF and low background to detect the faint AGN and unambiguously find optical counter-parts. With large samples of all AGN types, we can characterize the dominant population contributing to the CXRB and determine the relative importance and nature of interesting AGN that defy a simple unification model.
2. The Multi-wavelength Project (ChaMP)
The ChaMP (Kim et al. 2004a; Kim et al. 2004b; Green et al. 2004) is providing a medium-depth, wide-area survey of serendipitous X-ray sources from archival fields covering deg2. The broadband sensitivity between 0.3–8.0 keV enables the selection to be far less affected by absorption than previous optical, UV, or soft X-ray surveys. ’s small point spread function (1 resolution on-axis) and low background allow sources to be detected to fainter flux levels, while the X-ray astrometry greatly facilitates unambiguous optical identification of X-ray counter-parts. The project effectively bridges the gap between flux limits achieved with the deep field observations and those of past and surveys. A total of about 8000 serendipitous extragalactic X-ray sources are expected when the project is complete. A primary aim of the ChaMP is to measure the luminosity function of quasars and lower luminosity AGN out to with the inclusion of the obscured population (J.D. Silverman et al. 2004, in preparation).
We present results from the ChaMP using a subsample ( erg cm-2 s-1 and ) of 497 X-ray sources detected in the hard band (2.5–8.0 keV) in 20 fields. This work is an extension of the 6 fields analyzed by Green et al. (2004), here limited to the hard X-ray band. From this subsample, we classify 188 as AGN based on their X-ray luminosity (L erg s-1). Our motivation is to determine the demographics of the hard X-ray emitting AGN, measure the range of intrinsic obscuration, and determine the extent to which obscuration of X-rays translates to extinction in the optical. After briefly discussing the X-ray and optical data acquisition, reduction and analysis (§3 & §4), we describe the characteristics of the hard X-ray sources (§5) and the AGN properties (§6) including selection and completeness . In section §7, we present the results. Throughout this paper, we assume H∘=70 km s-1 Mpc-1, =0.7, and =0.3.
3. X-ray observations
We have chosen 20 fields (Table 1) for which we have acquired extensive followup optical imaging and spectroscopy. These fields have been selected from the first two years of archival data. Only ACIS observations at high galactic latitude () with no special observing modes (e.g., gratings) are used. The deepest observations have exposure times that are sensitive to sources with erg cm-2 s-1. At this flux limit, we resolve of the 2–8 keV CXRB (Moretti et al. 2003; Figure 5). The target of each observation has been excluded to avoid any bias towards specific objects such as AGNs associated with clusters.
A full description of the ChaMP image reduction and analysis pipeline XPIPE can be found in Kim et al. (2004a). In short, we have an automated reduction routine that filters out high background intervals, bad events such as cosmic rays and hot pixels to produce a clean and robust X-ray source catalog. Source extraction is performed using a wavelet detection algorithm (CIAO/wavdetect; Freeman et al. 2002) in three energy bands (Broad (B): 0.3–8.0 keV, Soft (S): 0.3–2.5 keV, Hard (H): 2.5–8.0 keV).
For the following analysis, we require a S/N 2 in the 2.5–8.0 keV band to generate a hard X-ray selected sample which minimizes any inherent bias against the absorption of soft X-rays. We restrict the off-axis angle of the detections to less than since the sensitivity beyond this is significantly reduced. We do not use chip S4 (ccd_id=8) since this CCD is severely affected by a flaw in the serial readout, causing a significant amount of charge to be randomly deposited along pixel rows as they are read out. Each detection has a unique effective exposure time which includes vignetting. The conversion from X-ray count rate to flux units (erg cm-2 s-1 ) is determined from simulated detections on each CCD of a source with a powerlaw spectrum (;111The ChaMP XPIPE (Kim et al. 2004a) provides energy conversion factors (ECF) for two models with and . We chose the former since the photon index more closely resembles the majority of the hard source detections.) and galactic absorption (Dickey & Lockman, 1990). The effect of varying the photon index () from 1.7 to 1.9 results in a difference in flux for both ACIS-I and ACIS-S. We calculate the flux in the conventional 2.0–8.0 keV band for comparison with other surveys.
With ’s broad band sensitivity (0.3–8.0 keV), we are able to investigate the spectral properties of the sample, though we are limited by the small number of source counts in most cases (90% of sources have in the 2.0–8.0 keV band). The hardness ratio (HR=H–S/H+S) can be used as a crude assessment of the spectral characteristics. Since the response of varies as a function of energy and off-axis angle with the additional complication of mixing frontside and backside illuminated CCDs, we have converted the raw HR to an effective, on-axis, ACIS-I value by multiplying the count rate in each band by the ratio of the ECF (off-axis CCD) to the on-axis ECF which ranges between 0.6–2.0.
3.1. X-ray spectral fits
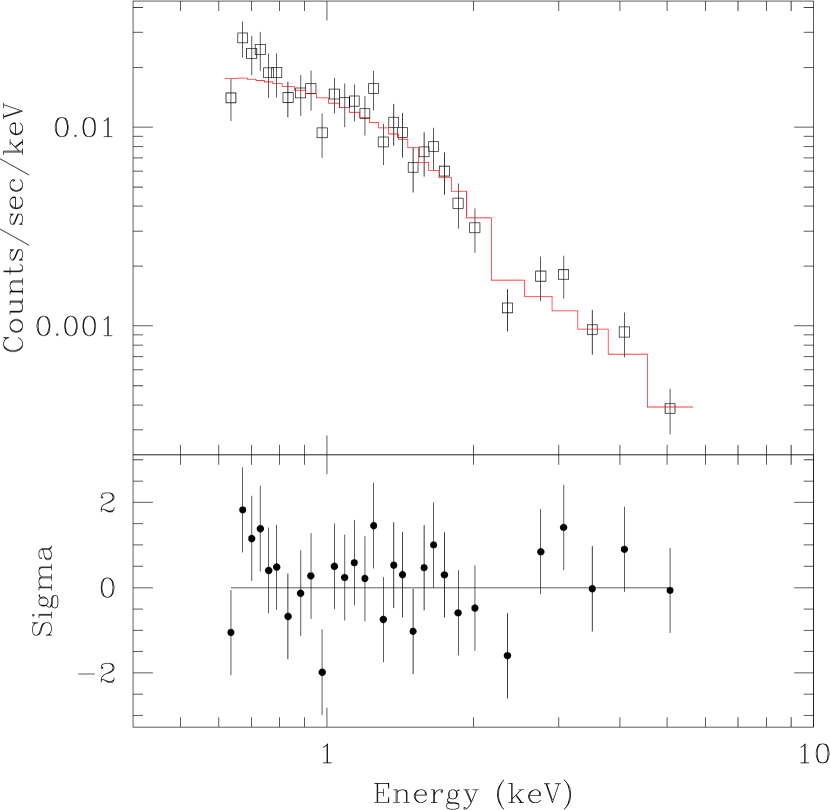
X-ray spectral modeling provides a robust way of characterizing the spectral properties of our sample, independent of observation and instrument details. With a measured redshift, we can more accurately determine the intrinsic absorbing column than that based solely on hardness ratios. Some objects that look soft in HR may have significant absorption especially at higher redshifts. For each X-ray source in our hard-selected sample, we use an automated procedure to extract the spectrum and fit a model to the data. Due to a lack of counts, we cannot usefully fit a spectral powerlaw model, leaving both spectral index and intrinsic absorbing column free for all objects.
All processing is done using CIAO 3.0.2222http://cxc.harvard.edu/ciao and CALDB 2.26333http://cxc.harvard.edu/caldb. The detailed steps to prepare the PHA (Pulse-Height Analysis) spectrum follow. First, we define a circular region centered on the X-ray source sized to contain 95% of 1.5 keV photons at the given off-axis angle. The background region is annular with a width of centered on the source. We exclude any nearby sources from both the source and background regions. We then use CIAO tool psextract to create a PHA spectrum covering the energy range 0.4–8 keV. We generate both an ungrouped spectrum and one which is grouped to a minimum of 10 counts per channel. The time-dependent quantum efficiency degradation of ACIS is accounted for when the ARF is generated by the mkarf tool.
Spectral fitting is done using the CIAO Sherpa444http://cxc.harvard.edu/sherpa tool. For all sources, we fit an absorbed powerlaw containing an intrinsic absorber with neutral column at the source redshift. Our choice of photon index (Frozen at ) is based on previous studies of unabsorbed AGN. Reeves & Turner (2000) have measured the spectral index for radio quiet AGN using observations to be . Piconcelli et al. (2003) have measured a mean photon index 1.8–1.9 with which shows no variation over the redshift range . This fit provides a robust one-parameter characterization of the intrinsic spectral shape for as few as 10 counts. We verified by an extensive Monte-Carlo simulation that the parameter uncertainties calculated with projection of confidence contours in Sherpa are reliable. Note that the spectral model contains a fixed Galactic neutral absorber appropriate for each object. Spectra with at least 60 counts are fit using the grouped spectrum with the hybrid Monte-Carlo Levenberg-Marquardt minimization method, while the low count spectra are fit using the ungrouped data with Cash statistics and the Powell method. Spectra with over 200 counts are also fit with a two-parameter absorbed powerlaw leaving both and the intrinsic at the source redshift free to vary. The results from the two-parameter fitting are included in this paper for a couple of sources discussed in Section 7.2. The full analysis will be presented in an upcoming ChaMP paper (T.L. Aldcroft et al. 2004, in preparation).
4. Optical followup
4.1. Imaging
We have acquired optical imaging for each field to identify counter-parts to X-ray sources. We use the NOAO Blanco and Mayall 4m telescopes and their MOSAIC cameras to image the full field-of-view of our survey fields. The exposure times are scaled from the minimum X-ray flux for a detection per field to identify of AGN (Yuan et al., 1998). Three filters (, , ) using the Sloan Digital Sky Survey (SDSS) photometric system (Fukugita et al., 1996) are implemented to measure broad band colors for preliminary source classification. Table 2 provides some details of the imaging for the fourteen fields not included in Green et al. (2004).
A full description of the optical followup program including strategy, image reduction, source detection and photometric calibration can be found in (Green et al., 2004). Briefly, optical image reduction on the MOSAIC data is performed with the mscred (Valdes, 2002) package within the IRAF555IRAF is distributed by the National Optical Astronomy Observatory, which is operated by the Association of Universities for Research in Astronomy, Inc., under cooperative agreement with the National Science Foundation. environment. We use the SExtractor (Bertin & Arnouts, 1996) algorithm to detect sources, and measure their positions and brightness. Since the X-ray source positions are only accurate to within , the optical astrometric solution is required to achieve the rms accuracy necessary for spectroscopic followup. We require an accuracy of the photometric solution to less than a tenth of a magnitude. The majority of the AGN sample (88%) presented in this paper has magnitude errors less than 0.05 as a result of the bright optical magnitude selection. In addition, we find a mean color offset of 0.05 magnitudes to the red between our color and the SDSS using sources detected in both surveys.
4.2. X-ray to optical source matching
We implement an automated routine to match each X-ray source with potential optical counter-parts (see Green et al. 2004). The search radius is increased for X-ray detections at large off-axis angles. Each match is visually inspected and a confidence level is determined. For X-ray sources with multiple optical counter-parts, the optical source closest to the X-ray centroid is usually given a higher confidence. We have found 415 optical counter-parts to 497 X-ray sources (84%; Figure 1). We have not included 36 sources because the X-ray detection fell on a chip edge or there were multiple optical counter-parts for which no single optical source could confidently be assigned. We note that 81% of the matches have an X-ray to optical offset .
4.3. Spectroscopy
Optical spectroscopy is crucial for determining the source type and redshift. We acquired the majority of our optical spectra with the WIYN/3.5m and CTIO/4m with the HYDRA multi-fiber spectrographs, which have a field of view () that fully covers the field. To extend spectroscopic classifications beyond , the limit of the 4m class telescopes with HYDRA, we have obtained spectra from Magellan and the MMT. The field of view of Magellan with LDSS-2, a multi-slit spectrograph, is 5′, so it takes 5–6 pointings to cover the full field. We have been using the FLWO 1.5m to acquire spectra of the optically bright () counter-parts. In addition, a number of people, mentioned in the acknowledgements, have graciously acquired long slit spectra of a few ChaMP sources during their own observing time. All redshifts have an accuracy of . Table 3 gives a summary of the spectroscopic facilities used by the ChaMP project.
We implement a classification scheme of optical spectra similar to the Einstein Observatory Extended Medium-Sensitivity Survey (Stocke et al. 1991). Objects with strong emission lines (W ) are classified as either Broad Line AGN (BLAGN; FWHM 1000 km s-1) or Narrow Emission Line Galaxy (NELG; FWHM 1000 km s-1). Counter-parts with weak emission line or pure absorption line spectra are classified as Absorption Line Galaxy (ALG). We note that there is a combination of redshift range and spectral bandpass for which we may lose important AGN optical diagnostic features. In some cases, the host galaxy contribution can prevent H from being a useful AGN indicator. Given the low signal-to-noise of our spectra, some NELG may have weak, broad emission lines. Ho et al. (1997) found that broad H can often be found in low luminosity “dwarf” Seyferts with high S/N spectra and proper subtraction of the stellar continuum. This type of analysis is not possible given the quality of our spectra. Any stellar source is labelled as a STAR. For the ALG, we measure the Ca II break “CONTRAST” (Stocke et al. 1991) to look for a powerlaw AGN component to the continuum to note potential BL LAC candidates. If the associated X-ray emission is extended the object is further labelled as a possible cluster member.
5. Characteristics of the hard X-ray sample
5.1. X-ray and optical flux
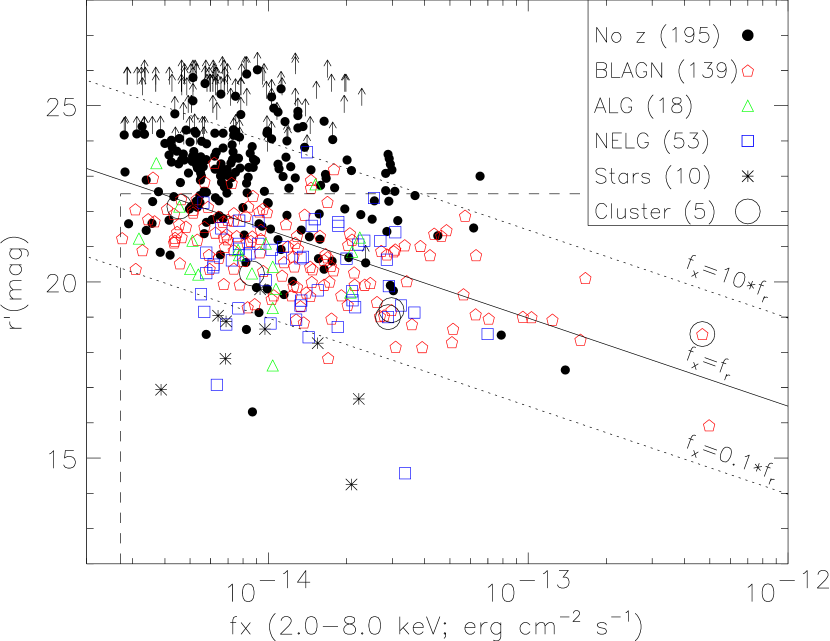
We show the optical magnitude () as a function of X-ray flux (2.0–8.0 keV) for the 497 sources detected in 20 fields (Figure 1). Lines of constant /f are determined as follows.
| (1) |
This relation has been derived using an assumed powerlaw () with spectral index and . The characteristics of the filter are taken from Fukugita et al. (1996). Most objects have . There exists a significant number of X-ray bright, optically faint sources (f), many of which are not detected in our optical imaging. Due to their optical faintness, we have only identified one such source, an NELG.
Based on the 210 spectroscopically identified objects with 22.5, we find that 62% of the hard X-ray sources are classified as BLAGN. As shown in Green et al. (2004), these AGN tend to follow the relation over a wide range of optical and X-ray flux. The NELG, which comprise 24% of the identifications, have flux ratios similar to the BLAGN. We find a number of counter-parts (7% ALG) that have no evidence for an emitting line region. These galaxies are primarily identified at bright optical magnitudes () due to the difficulty of classifying sources without strong emission lines at high redshift (). In addition, a few hard X-ray detected sources are associated with optically bright stars (5%) and galaxy clusters (2%) with extended X-ray emission.
5.2. X-ray spectral properties
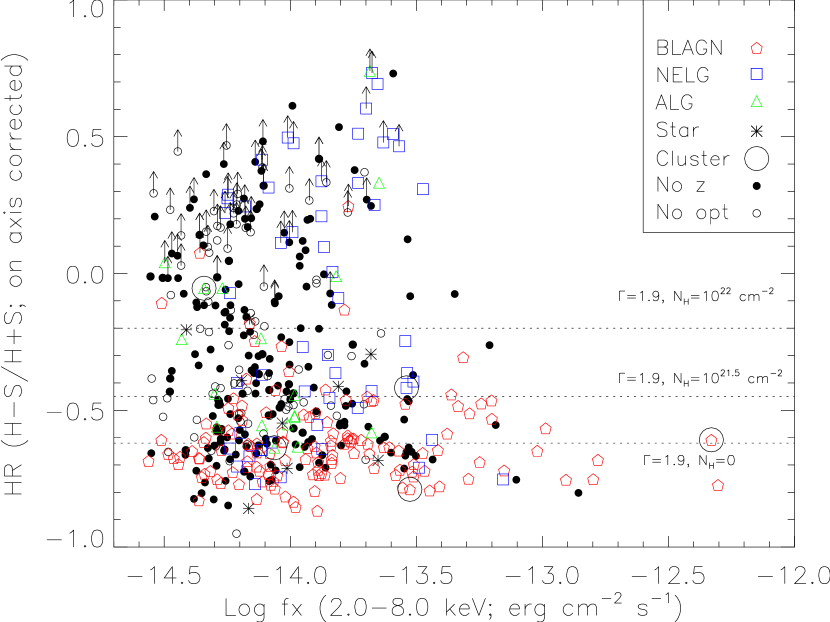
The X-ray hardness ratio provides a crude measure of the spectral properties and classification of the hard X-ray sources. In Figure 2, we plot the corrected hardness ratio (Section 3) as a function of X-ray flux. The flux range shown includes all sources with the exception of the extremely bright cataclysmic variable TX Col (Schlegel & Salinas, 2004). The horizontal lines mark the hardness ratio which corresponds to an X-ray source with a powerlaw continuum (photon index ) absorbed by a column of gas at . Some of the derived detections may be higher (see Section 3.1) using an absorber intrinsic to the source. According to Moretti et al. (2003), we are resolving of the full 2–8 keV CXRB at our chosen flux limit. With a flux weighted mean HR for the ChaMP sources of –0.39, the X-ray spectrum of the ensemble is similar to the spectral characteristic of the integrated CXRB (=1.4) which corresponds to a hardness ratio of –0.42.
As described in many studies with (e.g., Mushotzky et al. 2000) and (e.g., Hasinger et al. 2001), the X-ray source population becomes relatively harder at fainter flux levels. As evident in Figure 2, the hardest (HR0) X-ray sources in these ChaMP fields are predominately at log10() –13.6. At fainter flux levels, the sources have a more even distribution over all hardness ratios. This spectral variation has been attributed to intrinsic absorption rather than changes in the intrinsic spectral energy distribution (Mainieri et al. 2003; Kim et al. 2004b). This will be further investigated in an upcoming ChaMP paper on the X-ray spectral properties of the AGN sample.
6. Hard AGN sample
6.1. Selection and completeness
In these medium depth fields, we are sensitive to X-ray sources with a 2.0–8.0 keV flux greater than erg cm-2 s-1. The addition of a spectroscopic limit of , yields a sample of X-ray sources which is 77% identified. This optical magnitude limit does bias the sample against optically faint counter-parts at the lower X-ray flux levels.
To construct a pure AGN sample, we require the rest frame 2.0–8.0 keV luminosity (uncorrected for intrinsic absorption) to exceed 1042 erg s-1 thereby excluding any sources that may contain a significant stellar or hot ISM component. The most luminous known star-forming (Zezas et al., 2003; Lira et al., 2002) or elliptical (O’Sullivan, Forbes & Ponman, 2001) galaxies attain at most erg s-1. Since many of the traditional optical AGN signatures are not present in obscured sources, high X-ray luminosity becomes our single discriminant for supermassive black hole accretion. We believe that almost all of the NELG and ALG harbor accreting SMBHs based on their X-ray luminosity. We find that 90% of the identified ChaMP sources have luminosities above this threshold. These selection criteria yield a sample of 188 AGN from 20 fields with erg cm-2 s-1, and erg s-1. We have removed 5 objects identified as clusters based on their extended X-ray emission. A truncated version of the AGN catalog is presented in Table 5 and a full version is available in electronic form. This sample is composed of 69% BLAGN, 24% NELG and 7% ALG (Table 4).
6.2. Redshift and luminosity distribution
As shown in Figure 3, detects hard BLAGN out to 4 in these medium depth observations. In contrast, we have only identified non-BLAGN with . The steep drop in the number of NELG and ALG above this redshift is primarily due to an optical selection bias. The NELG and ALG lack prominent broad emission lines and may be resolved, having a magnitude fainter than our =22.5 limit within our spectroscopic aperture. Even a luminous host galaxy (10L⋆) at is fainter than this limit. However, the Deep field surveys are finding a peak in the number distribution at with a sharp dropoff beyond (Cowie et al., 2003). Therefore, the peak in our distribution for NELG and ALG is unlikely to change drastically with the identification of the optically faint sources.
6.3. Low luminosity AGN and composite systems
Even though we have mitigated bias against obscured AGN by carrying out a hard X-ray survey, we still need to incorporate the optical properties of these AGN to determine their nature and how they fit into the unification scheme. Many of the newly detected and sources in the deep fields show no evidence for an AGN in the optical.
Optical emission from these low luminosity AGN can include a significant contribution from the host galaxy (Fiore et al. 2003; Green et al. 2004). This tends to be the case for AGN with erg s-1. We plot in Figure 4 the monochromatic, rest frame optical (2500 ) versus X-ray (2 keV) luminosity density for our hard AGN sample with erg cm-2 s-1 and . We measure the optical luminosity density at 2500 from the magnitude as in Fukugita et al. (1996), assuming a powerlaw spectrum with . The monochromatic X-ray luminosity is derived from the hard band flux using a powerlaw spectrum with . The additional X-ray flux limit is imposed to include BLAGN across the full range of (). If we included BLAGN with fainter X-ray fluxes, we would be biasing the sample too strongly towards optically bright objects based on our optical magnitude limit. The BLAGN above log share a similar X-ray to optical ratio () while the lower luminosity AGN depart from this relation.
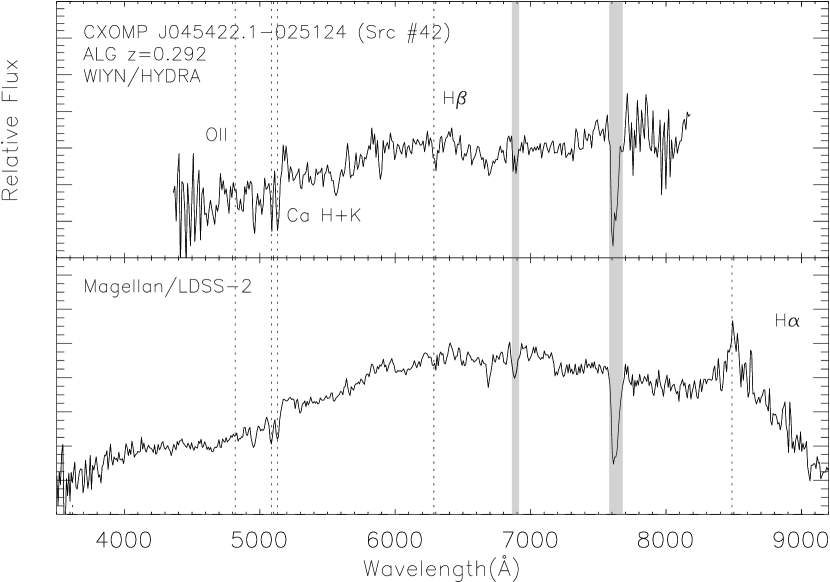
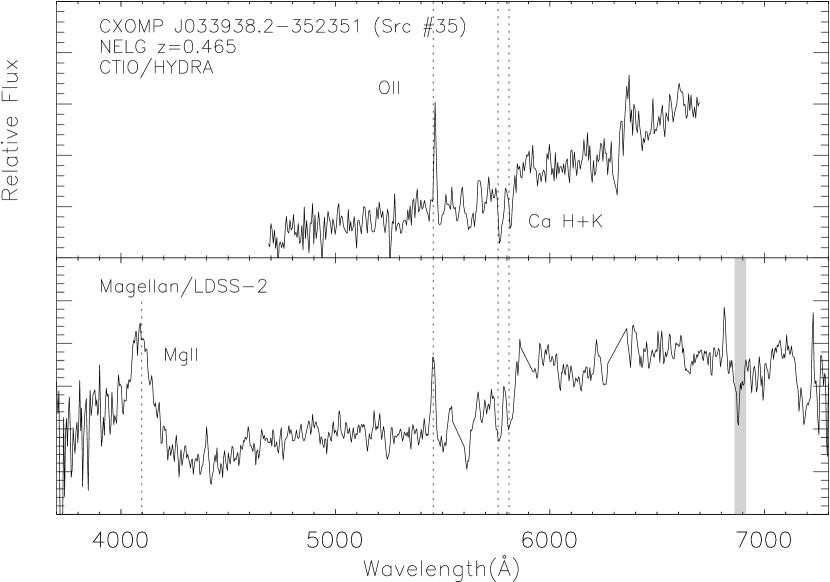
Most studies of X-ray selected AGN rely on optical spectroscopy for further classification. This can be misleading since it is difficult to isolate the nuclear region at these distances (Moran, Filippenko & Chornock 2002) with a aperture. While most of the optical counter-parts of ChaMP sources have emission lines similar to quasars and lower luminosity Seyfert galaxies, limited wavelength coverage can cause some confusion with source classification as described by Page et al. (2003). For example, we display in Figure 5 two sources each with optical spectra spanning different wavelength ranges. Depending on the observed wavelength coverage, the classification can change drastically with the detection of broad emission lines either at the blue end of the spectrum (Src # 35; Mg II) or the red end (Src #42; H). However, the inclusion of these AGN in our sample highlight the power of X-ray selection to reveal supermassive black hole accretion even under a veil of obscuration or host contamination.
6.4. Comparison with the optically selected samples (SDSS)
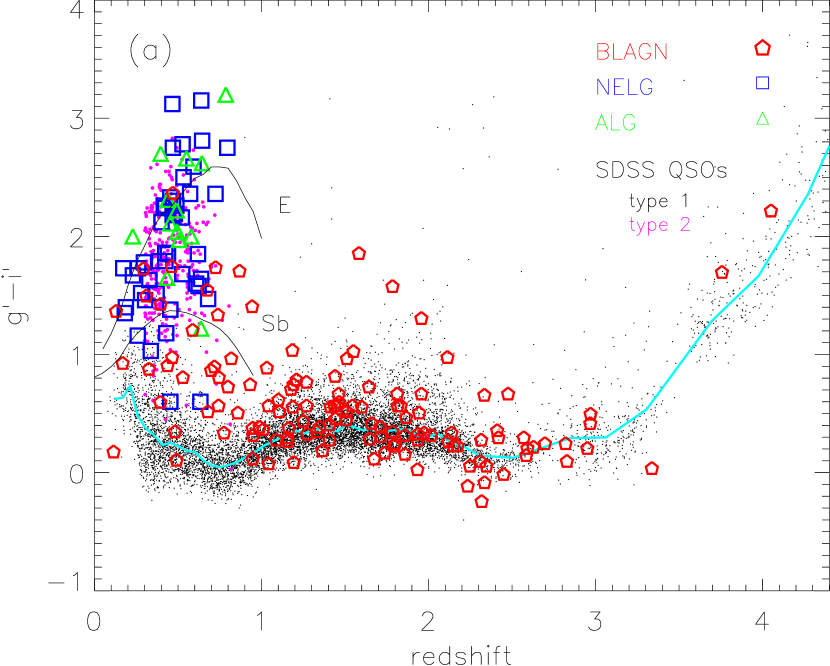
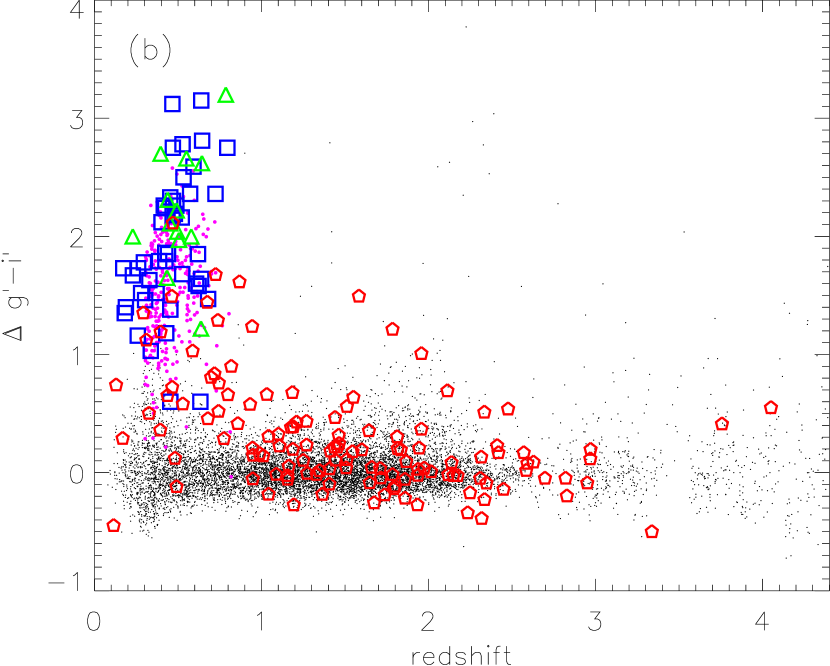
With optical imaging in three SDSS bands (, , ), the SDSS becomes the easiest and largest sample of AGN to which we can compare our ChaMP AGN. The second edition of the SDSS quasar catalog (Schneider et al., 2003) contains 16,713 objects with –22 out to from the first public data release. We have selected 10,736 of these which were targeted as quasars solely based on their optical colors (BEST spectroscopic flag=1 for either low-z and high-z quasars). In Figure 6a, we have plotted the optical color (–) of the ChaMP AGN and the quasars from the SDSS as a function of redshift. Following Richards et al. (2001), we have measured the color offset (Figure 6b) from the median color of type 1 quasars from the SDSS.
The ChaMP BLAGN follow the color locus of SDSS quasars (Figure 6) for . The ChaMP BLAGN are slightly redder with a color excess of 0.1 magnitudes compared to the median SDSS quasar colors (Figure 7). Given the photometric accuracy (0.1 mag) of ChaMP, we cannot with strong confidence report a difference of the mean between the two samples, though we probably achieve a higher precision with our sample of 95 ChaMP BLAGN. We do find a 0.03% likelihood that the color distribution of the ChaMP BLAGN (; –22) can be drawn from the SDSS quasar population using a Kolmogorov-Smirnov test (Press et al. 1992). In Figure 7, we see that the ChaMP BLAGN have a wider color distribution (=0.41) than the SDSS quasars (=0.26). Besides the width of the distribution, we can compare the symmetry about the mean by measuring the skewness of the distribution, defined in Equation 2.
| (2) |
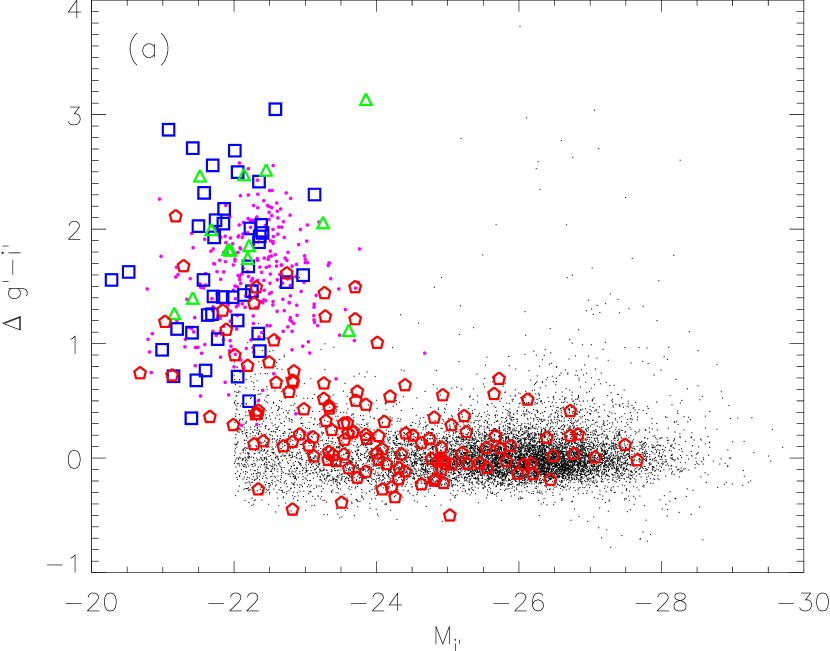
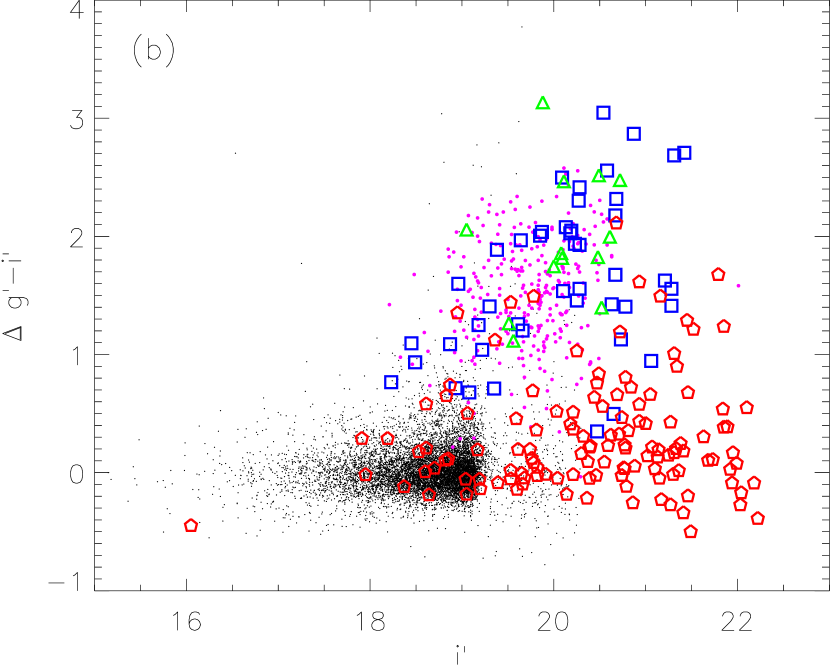
We find that the distribution of ChaMP BLAGN has a red wing (skewness=–1.7) which causes the mean to shift further to the red than the SDSS quasars (skewness=7.1). We calculate that 26% of our ChaMP AGN sample has above that expected from the SDSS distribution. Therefore, an X-ray selected sample can reveal a population of luminous, red AGN underrepresented in optically selected samples. At (Figure 6), we see a population of red BLAGN that would not be detected in the SDSS. As shown in Figure 8a, these red BLAGN tend to have low optical luminosities () and are probably missed in the SDSS due to their continuum color, which can be influenced by their host galaxy. In Figure 8b, we see that many of the red BLAGN are below the flux limit of the SDSS. A larger sample of optically bright ChaMP AGN is required to definitively identify a population missed by the optical surveys.
Most ChaMP NELG and ALG are red and fall off the color range for optically selected type 1 quasars. We would not expect these types of AGN to be included in the SDSS quasar catalog due to their narrow or nonexistent emission lines and most have –22. These objects appear to have colors dominated by their host galaxy. To illustrate, we plot in Figure 6a the expected colors of an elliptical (E0) and a spiral (Sb) galaxy using the Hyper_z (Bolzonella, Miralles, & Pell 2000) photometric code. We have assumed a Bruzual-Charlot spectral energy distribution, galactic extinction (=0.05) using the Calzetti (1999) reddening law and no intrinsic dust reddening. Most NELG and ALG have colors between these two tracks. We also plot the type 2 SDSS QSO candidates from Zakamska et al. (2003). The absolute magnitude () is calculated from the i∗ magnitude with a correction for Galactic extinction (=0.05) and no -correction. The ChaMP NELG and SDSS type 2 QSOs potentially represent the same population. The extraordinary advantage of an X-ray selected survey is seen with the detection of AGN with no optical emission lines at all (ALG).
7. X-ray absorption and optical extinction
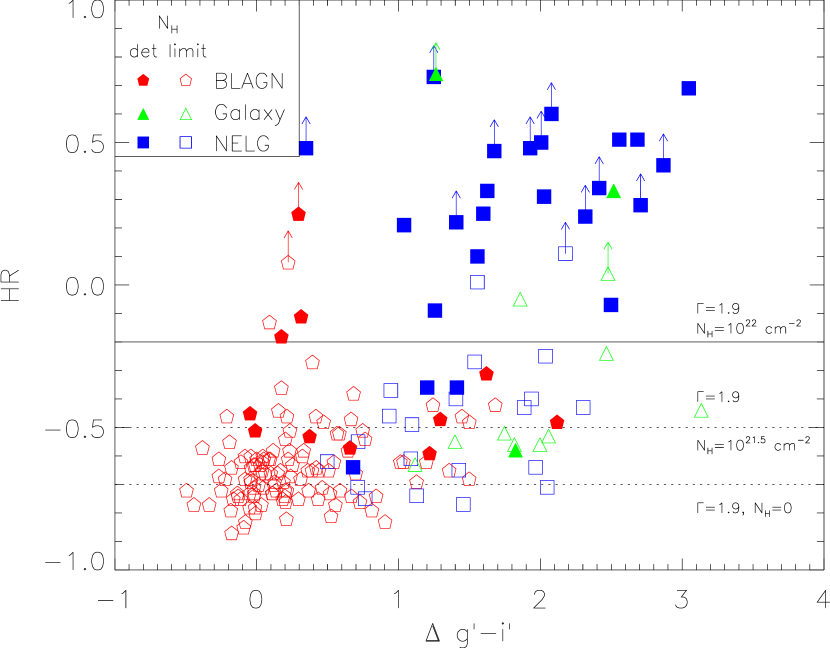
We present evidence of a direct relationship between the absorption of X-rays and optical extinction for the majority of the hard AGN, as expected if unification models (Antonucci, 1993) extend to the X-ray regime. We attempt to reconcile the variety of AGN types from an X-ray perspective. We use the term absorbed for any AGN with X-ray cm-2 and unabsorbed for those with columns below this value. As justified in Section 7.4, this value represents the amount of absorbing neutral gas needed to hide the broad emission line region (BLR), assuming a Milky Way gas-to-dust ratio and for each AGN, in a 5L⋆ host galaxy. As discussed below, most AGN with unabsorbed X-ray emission show signs of optical emission from the BLR. Alternatively, judging by the lack of broad emission lines, most X-ray absorbed AGN have significant optical extinction. However, there is a small though significant fraction that do not fall into the simple obscured or unobscured scenario. The various classes illustrating the permutations of X-ray absorption and optical extinction are delineated in the following sections.
7.1. Unabsorbed AGN with Broad Emission Lines
We find that the majority of AGN with unabsorbed ( cm-2) X-ray emission have no apparent extinction of their optical light. First, the optical spectra of 80% of the unabsorbed AGN (HR –0.2; Figure 2) are characterized by the presence of broad emission lines (e.g., Ly, CIV, CIII], MgII). In Figure 9, we plot the X-ray hardness ratio as a function of optical color for our AGN sample. These BLAGN have blue optical colors and are grouped in a region (HR–0.4 and –) characteristic of unobscured AGN. As mentioned previously, our BLAGN sample at has colors similar to the optically-selected SDSS quasars (Figure 6a) but with a slightly broader and skewed distribution (Figure 7). We conclude that no significant obscuring material is preventing us from observing the broad line region in these unabsorbed AGN.
We find that 10% of ChaMP BLAGN have red optical colors with – (Figure 9), offset from the locus of SDSS quasars (Figure 6a). We suspect that host galaxy emission is contributing to their red optical color since these ChaMP BLAGN, mostly at , represent the lower luminosity fraction of our sample ( erg s-1; Figure 3). To further illustrate, Figure 6b shows that the absolute magnitudes () and colors of these red BLAGN are intermediate between the non-BLAGN and the more luminous () AGN. We present in Figure 5, optical spectra of two such objects with composite (AGN+host) spectra. Both of these AGN have broad optical emission lines but their red optical continuum is dominated by the host galaxy. Extinction due to dust might contribute to both their low luminosity and optical color. Dust extinction is probably responsible for the red colors of three luminous ( erg s-1) BLAGN seen in Figure 6a with . The ChaMP BLAGN might be a fainter version of the 2MASS selected, red and X-ray unabsorbed BLAGNs (Wilkes et al., 2002).
7.2. Unabsorbed AGN Lacking Broad Emission Lines
Surprisingly, a number of unabsorbed AGN show no broad optical emission lines. These objects are clearly seen in Figure 9 with HR–0.2 and –1.0. The nature of these sources is the least understood. Their red optical colors are characteristic of their host galaxy but the classification might be due to the fact that at certain redshifts, we lose the AGN diagnostic emission lines (e.g. H, Mg II) within the observed optical spectroscopic window for sources with comparable host galaxy and AGN optical emisssion as discussed in Section 6.3. Usually H is the only line available, which can suffer from both extinction and contamination due to the host galaxy. We are pursuing spectroscopy further to the red for some of these objects to detect H for emission line diagnostics to securely identify the ioinizing source as either an AGN or starburst. Many of these AGN are at with H at , making this type of analysis difficult for optically faint AGN.
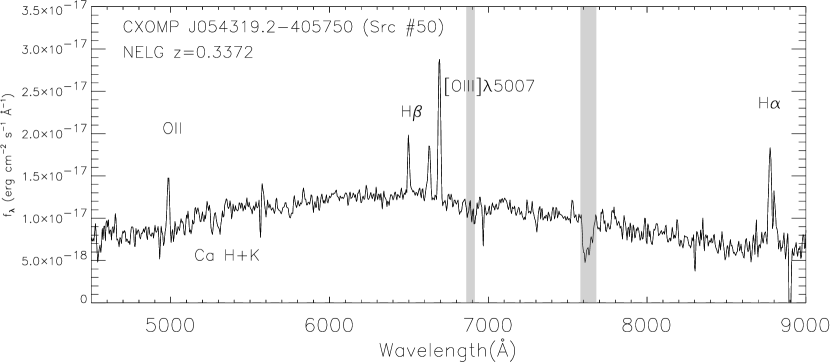
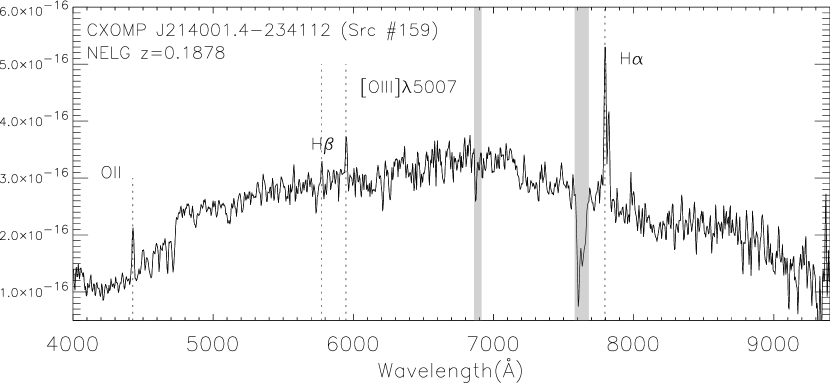
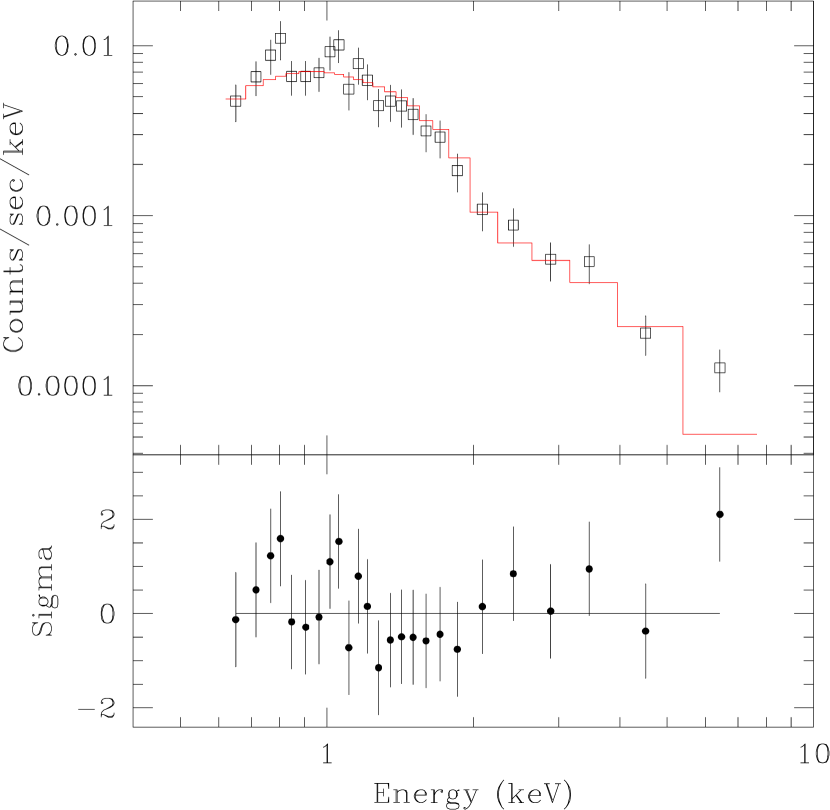
Two bright NELG may provide insight into the nature of this class of unabsorbed AGN ( cm-2). These objects might be similar to the rare unabsorbed Seyfert 2 galaxies seen by other groups in nearby objects (Georgantopoulos & Zezas 2003; Panessa & Bassani 2002). With over 400 counts in both sources [CXOMP J054319.2-405750 (#50; log L; ), CXOMP J214001.4-234112 (#159; log L; )], we are able to constrain their X-ray spectral properties. We fit the data using a spectral model with the photon index and the intrinsic absorption as free parameters (see Section 3.1). Figure 10 shows the X-ray and optical spectra. Source #50 is very soft with and cm-2. There could possibly be a soft excess below 2 keV. Source #159 has a photon index with cm-2. These AGN show no signs of X-ray absorption while their optical spectra show a strong galaxy continuum with overlying narrow emission lines. The width of H is 323 km s-1 in source #50 and the width of H is 669 km s-1 in #159. Surprisingly, their low ionization emission line ratios are not typical of an AGN, but resemble those of a star forming galaxy. We can explain the X-ray and optical properties with any of the following scenarios: (1) severe dilution of the AGN emission by a host undergoing prodigious star formation, (2) a Compton thick obscuring medium in which we observe the indirect, reflected component of the X-ray emission and the optical light is purely from the host galaxy due to severe dust extinction, (3) a high dust to neutral gas ratio which allows only the X-rays to penetrate or (4) beamed emission from a BL Lac. To properly discriminate between these models, a sample of nearby AGN for which we can resolve the nuclear region and properly subtract the host emission would be ideal. For the Compton thick case, the true LX may be much higher. In addition, we may find a large LIR from reprocessed emission.
We are finding a population of optically ‘dull’ galaxies (Severgnini et al. 2003; Silverman et al. 1998; Tananbaum et al. 1997; Elvis et al. 1981), recently coined XBONGS (Comastri et al., 2002). These are galaxies with X-ray bright nuclei that have weak or nonexistent emission lines. All but a couple of the 13 ALG identified in this study are not heavily absorbed (Figure 9). Similar X-ray properties have been noted in recent studies of other examples (e.g., Severgnini et al. 2003). As shown in Figure 5, we may be able to detect AGN optical signatures in some of these ALG using expanded wavelength coverage to include H, which is less susceptible to dust extinction and stellar absorption features. Using the definition of Dressler & Shechtman (1987), only two are possible BL Lac candidates based upon their 4000 break contrast.
7.3. Absorbed AGN
We find that most X-ray absorbed ( cm-2) AGN suffer from optical extinction. Almost all of the AGN (84%) with HR –0.2, lack broad optical emission lines (Figure 9). These absorbed AGN tend to have narrow emission lines in their optical spectra. At these redshifts (), the optical spectra rarely include a detection of all the emission lines (H, NII, [OIII], H) needed to solidify the optical classification as an AGN as opposed to a star forming galaxy. Given their high X-ray luminosity ( erg s-1), we are confident that the X-ray emission is due to supermassive black hole accretion.
In Figure 9, we show that these absorbed AGN (HR –0.2) have red optical colors (– 1.5) characteristic of their host galaxy and not the AGN itself (Green et al., 2004; Fiore et al., 2003). Most of these AGN have colors offset from the locus of optically-selected QSOs and fall along the track of an early type galaxy as shown in Figure 6a. These results agree with studies which conclude that AGN are predominantly found in massive, early type galaxies (Kauffmann et al. 2003). For the most part, AGN which suffer from absorption in the X-rays have significant optical extinction that hides emission from the BLR.
7.4. Intrinsic NH
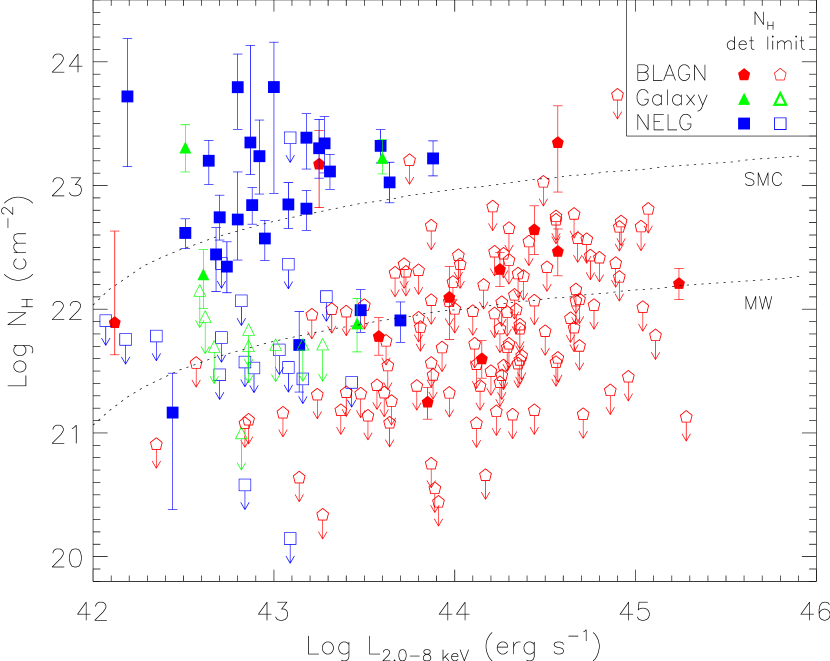
We have measured the amount of intrinsic absorption towards each AGN by fitting the X-ray count distribution with a fixed powerlaw model as described in Section 3.1. In Figure 11, we plot the best fit intrinsic as a function of rest frame X-ray luminosity. Measurements with errors (1.6) are plotted as filled symbols. Upper limits are marked as hollow symbols placed at the 1.6 upper limit with a downward arrow.
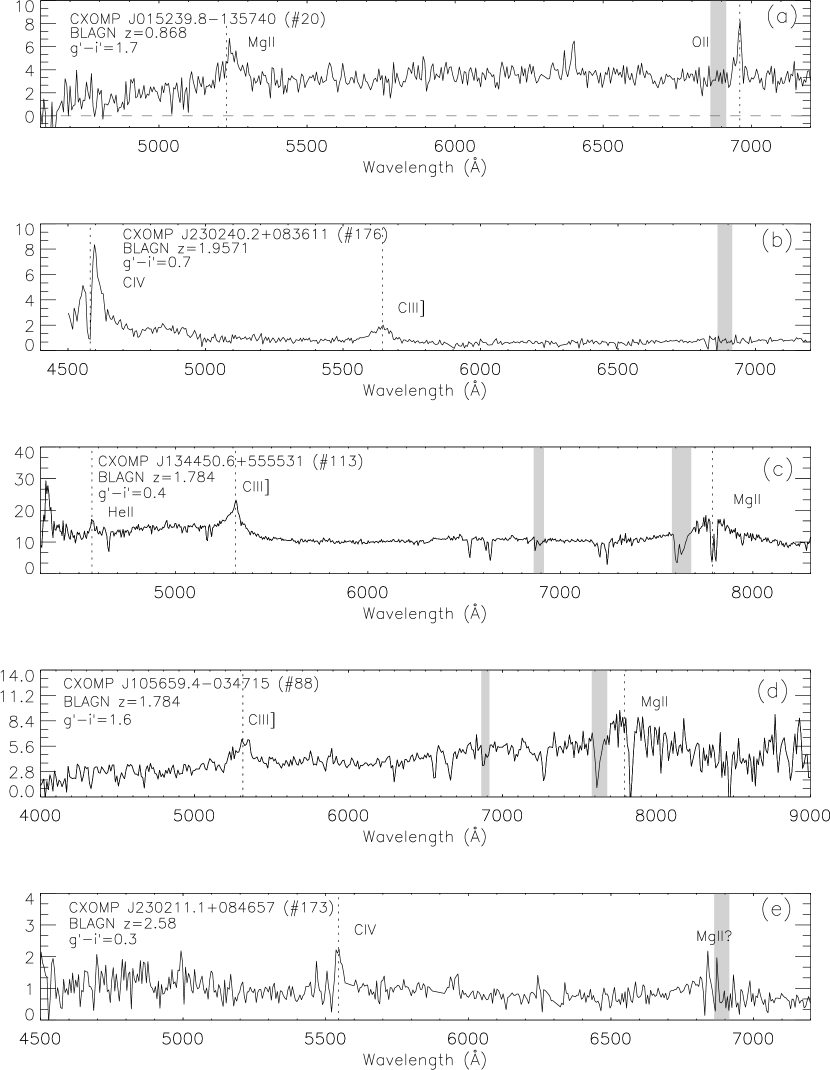
The absorbed AGN have columns in the range of cm-2. The majority of these are optically classified as NELG. We have uncovered 5 luminous AGN with erg s-1 which are heavily absorbed with well-constrained columns ( cm-2). These quasars would not be singled out as having high absorption based on their hardness ratios since they are mostly at , where the observed X-ray counts are less affected by absorption. (In Figure 9, the BLAGN with well constrained values of (filled symbols) do not necessarily have HR .) While these quasars have broad emission lines in their optical spectra (Figure 12), they all show signs of either absorption or extinction in the optical. Two sources (12a,d) have a reddened optical continuum possibly attributed to dust extinction and similar to the red quasar 3C 212 (Elvis et al. 1994). Their colors are substantially offset from the SDSS quasar locus in Figure 6. Three (12b,c,d) have narrow absorption lines that might be related to the X-ray absorption. Source CXOMP J230240.2+083611 (#176 in 12b) has an absorption line blue-shifted from the emission line center. This is evidence for ionized intrinsic outflows which are known to have high absorbing gas columns ( cm-2) in BALQSOs (Green et al. 2001). Even in non-BALQSOs, (Laor & Brandt, 2002) found an association in quasars between (soft) X-ray weakness and CIV absorption equivalent width. While the spectrum of source CXOMP J230211.1+084657 (#173, Figure 12e) has a poor S/N ratio, absorption might be seen blueward of the CIV emission line. The object CXOMP J134450.6+555531 (#113 in 12c) has narrow absorption lines detached from the emission lines. Either these absorption lines are extremely fast outflows intrinsic to the AGN or a more probable explanation is an intervening absorber. Based on these 5 absorbed quasars, we find that 6% (5/79) of luminous ( erg s-1) X-ray-selected BLAGN have cm-2 (2% of all AGNs). This is consistent with the value of 10% found by Perola et al. (2004) and Page et al. (2003).
As expected, the unabsorbed (N cm-2; Figure 11) AGN population is dominated by BLAGN. Almost all of the measurements are poorly constrained (upper limits) with a low probability of significant absorption. The apparent trend of increasing with luminosity for the BLAGN is probably due to our decreasing sensitivity to the absorbing column at higher redshifts, rest frame soft X-rays, most susceptible to absorption, are redshifted out of the bandpass. There are a fair number of NELG and ALG with no measurable absorbing column. As described in the previous section, we suspect that host dilution is confusing the spectroscopic characterization of these sources.
We crudely estimate the needed to hide the optical emission from an embedded AGN of a given X-ray luminosity. From the rest frame and =1.48 (the mean X-ray to optical flux ratio for the X-ray selected BLAGN; Section 6.3), we calculate the expected unabsorbed (2500 ). We then compare the 2500 monochromatic luminosity to that of a host galaxy, assuming . This luminosity corresponds to the average host absolute magnitude () found by Jahnke & Wisotzki (2003) for a sample of bright QSOs. Using the gas-to-dust ratio of the Milky Way ( mag-1 cm-2) and Small Magellanic Cloud ( mag-1 cm-2) from Pei (1992), we determine the amount of dust extinction and hence the column density required to diminish the AGN optical light to a tenth of the assumed host optical luminosity. The dashed lines in Figure 11 shows the results from this rather simplified calculation for both gas-to-dust ratios. Based on the gas-to-dust ratio of the Milky Way, the column densities needed to hide an AGN are cm-2 which marks our division between absorbed and unabsorbed AGN. The column densities could potentially be higher (Fig 11; top, dashed line), given that luminous quasars found in the SDSS have dust extinction more typical of the Small Magellanic Cloud (Hopkins et al., 2004).
7.5. Optically faint X-ray sources and type 2 quasars
As evident from Figure 1, there are many unidentified X-ray sources with 22. We believe that a significant fraction of these sources may be the elusive type 2 quasars.
A number of ongoing X-ray surveys (e.g., CDF-N and CDF-S) have acquired spectroscopic redshifts fainter than the current ChaMP sample and have identified a few as luminous narrow line AGN. The HELLAS2XMM (Fiore et al. 2003) survey has spectroscopically identified 8 type 2 QSOs from a sample of 13 over 0.9 deg2 with 10. The redshift range of these quasars () as described previously has been inaccessible to ChaMP (Figure 3) due to our bright spectroscopic limit.
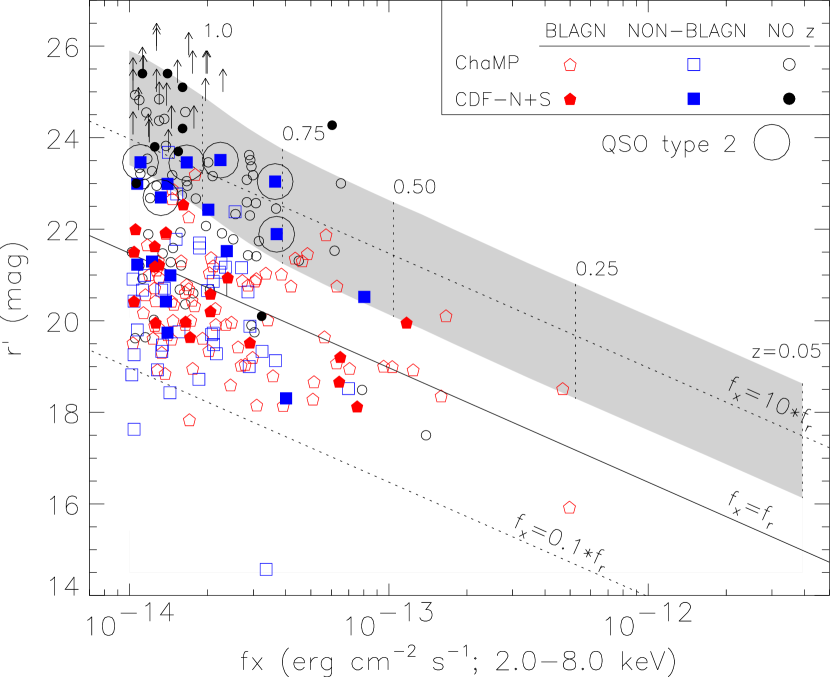
To investigate the lack of obscured, highly luminous quasars in our sample, we illustrate their expected location in – space (Figure 13). We plot only the X-ray bright ( erg cm-2 s-1) extragalactic sources (with the exclusion of clusters) and the unidentified objects. We have shaded the region for a hypothetical quasar with erg s-1 and optical emission purely from a host elliptical galaxy () using Hyper_z (Bolzonella, Miralles, & Pell 2000). We have labelled the redshifts () in this region with dashed vertical lines. We infer that most obscured quasars probably fall within the region with based on our X-ray sensitivity and area coverage.
To test this hypothesis, we have included data from the CDF-N and CDF-S which have detected 6 type 2 quasars with erg cm-2 s-1, erg s-1 and no evidence for any broad optical emission lines. The optical magnitudes of these sources have been converted to the SDSS photometric system using the transformations in Fukugita (1996). For the CDF-S data, we use average colors for each object class from the CDF-N sources to convert the R band magnitude (Szokoly et al. 2003). It is apparent from the six possible type 2 quasars in the deep fields that there is potentially a significant number of obscured quasars yet to be identified at faint optical magnitudes.
The optically undetected, X-ray bright objects must await infrared followup to learn more about their source properties. However, we can look at the X-ray hardness ratios to infer their host optical properties. From Figure 2, we see that the optically undetected sources have a wide range of hardness ratio with many extreme cases (HR 0). Since these X-ray sources have a HR distribution most similar to the NELG at erg cm-2 s-1, it seems likely that many of these optically undetected sources are the narrow emission line objects at higher redshift possibly comprising a significant fraction of the highly luminous and obscured quasar population.
8. Conclusions
We have presented an analysis of the X-ray and optical properties of 188 hard X-ray selected AGN in 20 medium depth ChaMP fields. These AGN have been classified by optical spectroscopy to be comprised of BLAGN (69%), NELG (24%) or ALG (7%). Overall, we find that 81% of the AGN agree with simple AGN unification models (Antonucci, 1993). The two main points of evidence are as follows:
-
•
80% of unabsorbed AGN ( cm-2) have optical properties characterized by broad emission lines. The optical colors of ChaMP BLAGN are predominately blue () and similar to optically-selected quasars from the SDSS but with a slighly wider distribution. A significant red (–) BLAGN population exists with optical properties influenced by their host galaxy. These objects represent 10% of the full AGN sample.
-
•
84% of absorbed AGN ( cm-2) lack broad optical emission lines. Most are associated with NELG with column densities in the range 10 cm-2. Their optical colors () are characteristic of a luminous, early type galaxy.
We also find a number of atypical AGN (19%) whose X-ray and optical properties can be explained without any need to alter the AGN unification models.
-
•
The lack of broad optical emission lines in X-ray unabsorbed, NELG and ALG can be attributed to a strong host galaxy contribution in 17% of the total AGN sample.
-
•
The large amount of X-ray absorption ( cm-2) in a few BLAGN (2% of all AGNs) may be related to signatures of absorption in their optical spectra. A future ChaMP study will determine if the X-ray absorption is associated with warm (ionized) intrinsic outflowing gas similar to that seen in Broad Absorption Line quasars.
References
- Akylas et al. (2003) Akylas, A., Georgantopoulas, I., & Barcons, X. 2003, A&A, 403, 869
- Antonucci & Miller (1985) Antonucci, R.R.J., & Miller, J.S. 1985, ApJ, 297, 621
- Antonucci (1993) Antonucci, R.R.J. 1993, ARA&A, 31, 473
- Barcons et al. (2003) Barcons, X., Carrera, F. J., Ceballos, M.T., Mateos, S., Page, M.J., P rez-Fournon, I., & Watson, M.G., The XMM-Newton Survey Science Centre 2003, AN, 324, 44
- Barger et al. (2002) Barger, A.J., Cowie, L.L., Brandt, W.N., Capak, P., Garmire, G.P., Hornschemeier, A.E., Steffen, A.T., & Wehner, E.H. 2002, AJ, 124, 1839
- Barger et al. (2003) Barger, A.J., Cowie, L.L, Capak, P., Alexander, D.M., Bauer, F.E., Fernandez, E., Brandt, W.N., & Garmire, G.P. AJ, 126, 632
- Bertin & Arnouts (1996) Bertin, E., & Arnouts, S. 1996 A&AS 117, 393
- Bolzonella et al. (2000) Bolzonella, M., Miralles, J.-M., & Pell , R. 2000, A&A 363, 476
- Comastri et al. (1995) Comastri, A., Setti, G., Zamorani, G., & Hasinger, G. 1995, A&A, 296, 1
- Comastri et al. (2002) Comastri, A. et al. 2002, ApJ, 571, 771
- Cowie et al. (2002) Cowie, L.L., Garmire, G.P., Bautz, M.W., Barger, A.J., Brandt, W.N., & Hornschemeier, A.E. 2002, ApJ, 566, L5
- Cowie et al. (2003) Cowie, L.L., Barger, A.J., Bautz, M.W., Brandt, W.N., & Garmire, G.P. 2003 ApJ, 584, L57
- Dickey & Lockman (1990) Dickey, J.M., & Lockman, F.J. 1990, ARA&A, 28, 215
- Dressler & Shechtman (1987) Dressler, A., & Shechtman, S. 1987, AJ, 94, 899
- Elvis et al. (1981) Elvis, M., Schreier, E.J., Tonry, J., Davis, M., & Huchra, J.P. 1981, ApJ, 246, 20
- Elvis et al. (1994) Elvis, M., Fabrizio, F., Mathur, S., & Wilkes, B.J. 1994, ApJ, 425, 103
- Fiore et al. (2003) Fiore, F. et al. 2003, A&A, 409, 79
- Fukugita et al. (1996) Fukugita, M., Ichikawa, T., Gunn, J.E., Doi, M., Shimasaku, K., & Schneider, D.P. 1996, AJ, 111, 1748
- Georgantopoulos & Zezas (2003) Georgantopoulos, I., & Zezas, A. 2003, ApJ, 594, 704
- Gilli et al. (2001) Gilli, R., Salvati, M., & Hasinger, G. 2001, A&A, 366, 407
- Green et al. (2001) Green, P.J., Aldcroft, T.L., Mathur, S., Wilkes, B., & Elvis, M. 2001, ApJ, 558, 109
- Green et al. (2004) Green et al. 2004, ApJS, 150, 43
- Hasinger et al. (1998) Hasinger, G., Burg, R., Giacconi, R., Schmidt, M., Trumper, J., & Zamorani, G. 1998, A&A, 329, 482
- Hasinger et al. (2001) Hasinger, G. et al. 2001, A&A, 365, 45
- Harrison et al. (2003) Harrison, F.A.,Eckart, M.E., Mao, P. H.,Helfand, D.J., & Stern, D. 2003, ApJ, 596, 944
- Ho et al. (1997) Ho, L.C., Filippenko, A.V., Sargent, W.L., Peng, C.Y. 1997, ApJS, 112, 391
- Hopkins et al. (2004) Hopkins, P.F. et al. 2004, astro-ph/0406293
- Jahnke & Wisotzki (2003) Jahnke, K., & Wisotzki, L. 2003, MNRAS, 346, 304
- Kauffmann et al. (2003) Kauffmann, G. et al. 2003, MNRAS, 346, 1055
- Kim et al. (2004a) Kim, D.-W. et al. 2004a, ApJS, 150, 19
- Kim et al. (2004b) Kim, D.-W. et al. 2004b, AJ, 600, 59
- Laor & Brandt (2002) Laor, A., & Brandt, W. N. 2002, ApJ, 569, L641
- Lira et al. (2002) Lira, P., Ward, M., Zezas, A., Alonso-Herrero, A., & Ueno, S. 2002, MNRAS, 330, 259
- Mainieri et al. (2002) Mainieri, V., Bergeron, J., Hasinger, G., Lehmann, I., Rosati, P., Schmidt, M., Szokoly, G., & Della Ceca, R. 2002, A&A, 393, 425
- Moran, Filippenko & Chornock (2002) Moran, E.C., Filippenko, A.V., & Chornock, R. 2002, AJ, 579, L71
- Moretti et al. (2003) Moretti, A., Campana, S., Lazzati, D., & Tagliaferri, G. 2003, ApJ, 588, 696
- Mukai (1993) Mukai, K. 1993, HEASARC Newsletter, (Legacy) 3, 21
- Mushotzky et al. (2000) Mushotzsky, R.F., Cowie, L.L., Barger, A.J., & Arnaud, K.A. 2000, Nature, 404, 459
- O’Sullivan, Forbes & Ponman (2001) O’Sullivan, E., Forbes, D.A., & Ponman, T.J. 2001, MNRAS, 328, 461
- Page et al. (2003) Page, M.J. et al. 2003, AN, 324, 101
- Panessa & Bassani (2002) Panessa, F., & Bassani, L. 2002, A&A, 394, 435
- Pei (1992) Pei, Y.C. 1992, ApJ, 395, 130
- Perola et al. (2004) Perola, G.C. et al. 2004, astro-ph/0404044
- Piconcelli et al. (2003) Piconcelli, E., Cappi, M., Bassani, L., Di Cocco, G., & Dadina, M. 2003, A&A, 412, 689
- Reeves & Turner (2000) Reeves, J.N., & Turner, M.J.L. 2000, MNRAS, 316, 234
- Richards et al. (2001) Richards, G.T. et al. 2001, AJ, 121, 2308
- Schlegel & Salinas (2004) Schlegel, E. M., & Salinas, A. 2004, in Magnetic Cataclysmic Variables, ed. M. Cropper & S. Vrielmann, (San Francisco: ASP Conference Series), in press
- Schneider et al. (2003) Schneider, D.P. et al. 2003, AJ, 126, 2579
- Severgnini et al. (2003) Severgnini, P. et al. 2003, A&A, 406, 483
- Silverman et al. (1998) Silverman, J.D., Harris, D.E., & Junor, W. 1998, A&A, 335, 443
- Smith & Done (1996) Smith, D.A., & Done, C. 1996, MNRAS, 280, 355
- Stocke et al. (1991) Stocke, J.T, Morris, S.L., Gioia,I.M., Maccacaro, T., Schild, R., Wolter, A., Fleming, T.A., & Henry, J.P. 1991, ApJS, 76, 813
- Szokoly et al. (2003) Szokoly, G.P. et al. 2003, astro-ph/0312324
- Tananbaum et al. (1997) Tananbaum, H., Tucker, W., Prestwich, A., & Remillard, R. 1997, ApJ, 476, 83
- Tozzi et al. (2001) Tozzi, P. et al. 2001, ApJ, 562, 42
- Turner et al. (1997) Turner, T.J., George, I.M., Nandra, K., & Mushotzky, R.F. 1997, ApJ, 488, 164
- Valdes (2002) Valdes, F. G. 2002, in Automated Data Analysis in Astronomy, eds Ranjan Gupta, Harinder P. Singh, and Coryn A. L. Bailer-Jones, Narosa Publishing House, New Delhi, p. 309.
- Wilkes et al. (2002) Wilkes, B.J., Schmidt, G.D., Cutri, R.M., Ghosh, H., Hines, D., Nelson, B., & Smith, P.S. 2002, ApJ, 564, L65
- Yuan et al. (1998) Yuan, W., Brinkmann, W., Siebert, J., & Voges, W. 1998, A&A, 330, 108
- Zakamska et al. (2003) Zakamska, N.L. et al. 2003, AJ, 126, 2125
- Zezas et al. (2003) Zezas, A., Ward, M.J., & Murray, S.S. 2003, 594, 31
| ObsID | PI Target | ExposureaaEffective screened exposure time for the on-axis chip. | ACIS CCDsbbThe ACIS CCD chips used in the observation with the aimpoint chip underlined. CCD 8 has been excluded (see text). | RA | DEC | UT Date | Galactic NH ddGalactic column density taken from Dickey & Lockman (1990). |
|---|---|---|---|---|---|---|---|
| (ksec) | J2000ccNominal target position, not including any Chandra pointing offsets. | (cm-2) | |||||
| 520 | MS0015.9+1609 | 61.0 | 0123 | 00:18:33.4 | +16:26:34.8 | 2000 Aug 18 | 4.06 |
| 913 | CLJ0152.7-1357 | 34.6 | 012367 | 01:52:43.0 | 13:57:30.0 | 2000 Sep 08 | 1.61 |
| 796 | SBS 0335052 | 47.0 | 0123 | 03:37:44.0 | 05:02:39.0 | 2000 Sep 07 | 4.98 |
| 624 | LP94420 | 40.9 | 2367 | 03:39:34.7 | 35:25:50.0 | 1999 Dec 15 | 1.44 |
| 902 | MS0451.60305 | 41.5 | 2367 | 04:54:10.9 | 03:01:07.2 | 2000 Oct 08 | 5.18 |
| 914 | CLJ05424100 | 48.7 | 0123 | 05:42:50.2 | 41:00:06.9 | 2000 Jul 26 | 3.59 |
| 1602 | Q0615+820 | 43.1 | 2367 | 06:26:02.9 | +82:02:25.5 | 2001 Oct 18 | 5.27 |
| 377 | B2 0738+313 | 26.9 | 367 | 07:41:10.7 | +31:12:00.4 | 2000 Oct 10 | 4.18 |
| 2130 | 3C207 | 30.0 | 2367 | 08:40:48.0 | +13:12:23.0 | 2000 Nov 04 | 4.14 |
| 512 | EMSS1054.5-0321 | 75.6 | 2367 | 10:57:00 | 03:37:00.0 | 2000 Apr 21 | 3.67 |
| 536 | MS1137.5+6625 | 114.6 | 0123 | 11:40:23.3 | +66:08:42.0 | 1999 Sep 30 | 1.18 |
| 809 | MRK 273X | 40.9 | 2367 | 13:44:47.5 | +55:54:10.0 | 2000 Apr 19 | 1.09 |
| 541 | V14164446 | 29.8 | 0123 | 14:16:28.8 | +44:46:40.8 | 1999 Dec 02 | 1.24 |
| 548 | RXJ1716.9+6708 | 50.3 | 0123 | 17:16:52.3 | +67:08:31.2 | 2000 Feb 27 | 3.71 |
| 830 | Jet of 3C390.3 | 23.6 | 2367 | 18:41:48.1 | +79:47:43.0 | 2000 Apr 17 | 4.16 |
| 551 | MS2053.70449 | 42.3 | 01236 | 20:56:22.2 | 04:37:44.4 | 2000 May 13 | 4.96 |
| 928 | MS21372340 | 29.1 | 2367 | 21:40:12.7 | 23:39:27.0 | 1999 Nov 18 | 3.57 |
| 431 | Einstein Cross | 21.9 | 2367 | 22:40:30.4 | +03:21:31.0 | 2000 Sep 06 | 5.34 |
| 918 | CLJ2302.8+0844 | 106.1 | 0123 | 23:02:48.1 | +08:44:00.0 | 2000 Aug 05 | 5.50 |
| 861 | Q2345007 | 65.0 | 267 | 23:48:19.6 | +00:57:21.1 | 2000 Jun 27 | 3.81 |
| ObsID | UT Date | Filter | Dithers | Exposure | Airmass | FWHMbbFWHM of point sources in final stacked images. | mTOccTurnover magnitude limit at completeness, using 0.25 mag bins before extinction correction, as described in the text. | m5σddMagnitude limit for a detection. | |
|---|---|---|---|---|---|---|---|---|---|
| (total sec) | (Mean) | (″) | Limit | Limit | |||||
| 377 | 21 Feb 2001 | 3 | 1800 | 1.00 | 1.1 | 25.4 | 26.5 | ||
| 3 | 1500 | 1.01 | 1.0 | 24.9 | 26.0 | ||||
| 3 | 1500 | 1.04 | 1.1 | 24.1 | 25.2 | ||||
| 431 | 11 Jun 2000 | 2 | 1000 | 1.36 | 1.6 | 24.1 | 25.4 | ||
| 1 | 500 | 1.28 | 1.6 | 23.4 | 24.7 | ||||
| 1 | 360 | 1.25 | 1.2 | 22.9 | 24.1 | ||||
| 512 | 21-22 Feb 2001 | 5 | 4500 | 1.29 | 1.3 | 24.9 | 26.3 | ||
| 3 | 2400 | 1.23 | 1.1 | 24.4 | 25.8 | ||||
| 5 | 2000 | 1.29 | 1.3 | 23.6 | 24.8 | ||||
| 520 | 25 Oct 2001 | 3 | 1950 | 1.24 | 1.2 | 24.1 | 25.2 | ||
| 3 | 1200 | 1.34 | 1.2 | 23.9 | 24.9 | ||||
| 3 | 900 | 1.46 | 1.4 | 22.6 | 24.0 | ||||
| 548 | 10 Jun 2000 | 2 | 1800 | 1.28 | 1.2 | 24.8 | 26.2 | ||
| 2 | 1200 | 1.24 | 1.3 | 24.1 | 25.4 | ||||
| 2 | 1200 | 1.22 | 1.7 | 23.4 | 24.6 | ||||
| 551 | 10,12 Jun 2000 | 3 | 2100 | 1.28 | 1.7 | 24.4 | 25.6 | ||
| 4 | 1200 | 1.25 | 1.8 | 23.9 | 25.0 | ||||
| 2 | 600 | 1.24 | 1.4 | 22.9 | 24.5 | ||||
| 796 | 24 Oct 2001 | 3 | 2700 | 1.33 | 1.1 | 25.1 | 26.4 | ||
| 3 | 2400 | 1.52 | 1.2 | 24.6 | 25.7 | ||||
| 3 | 1200 | 1.28 | 1.1 | 23.6 | 24.8 | ||||
| 809 | 11 June 2000 | 3 | 2100 | 1.19 | 1.8 | 23.1 | 24.4 | ||
| 3 | 1500 | 1.14 | 1.7 | 23.4 | 24.6 | ||||
| 3 | 1500 | 1.10 | 1.8 | 23.1 | 24.4 | ||||
| 830 | 11 June 2000 | 3 | 1800 | 1.49 | 1.6 | 24.1 | 25.6 | ||
| 2 | 1000 | 1.49 | 1.6 | 23.4 | 24.8 | ||||
| 1 | 600 | 1.49 | 1.6 | 22.9 | 24.2 | ||||
| 902 | 23 Oct 201 | 3 | 1800 | 1.24 | 1.0 | 24.9 | 26.2 | ||
| 3 | 1800 | 1.22 | 1.1 | 24.4 | 25.6 | ||||
| 3 | 1200 | 1.24 | 1.0 | 23.6 | 24.9 | ||||
| 913 | 23 Oct 2001 | 5 | 3500 | 1.46 | 1.1 | 25.1 | 26.4 | ||
| 5 | 3000 | 1.44 | 1.0 | 24.6 | 25.9 | ||||
| 5 | 2000 | 1.52 | 1.1 | 23.6 | 24.8 | ||||
| 918 | 23 Oct 2001 | 5 | 4500 | 1.20 | 1.2 | 24.9 | 26.0 | ||
| 5 | 3000 | 1.09 | 1.3 | 24.1 | 25.6 | ||||
| 5 | 1500 | 1.12 | 1.2 | 23.1 | 24.8 | ||||
| 1602 | 14 Dec 2001 | 1 | 520 | 1.56 | 2.4 | 23.3 | 24.8 | ||
| 3 | 1800 | 1.56 | 2.1 | 23.1 | 24.8 | ||||
| 3 | 1800 | 1.56 | 2.5 | 22.6 | 24.7 | ||||
| 2130 | 22 Feb 2001 | 3 | 3000 | 1.16 | 1.4 | 25.1 | 26.5 | ||
| 3 | 2700 | 1.08 | 1.3 | 24.9 | 25.9 | ||||
| 5 | 2500 | 1.06 | 0.9 | 24.6 | 25.8 |
| Telescope | Instrument | Grating/Grism | range | R | Spectral | Number |
|---|---|---|---|---|---|---|
| (Å) | () | Resolution (Å) | of spectra | |||
| WIYN11The WIYN Observatory is a joint facility of the University of Wisconsin Madison, Indiana University, Yale University, and the National Optical Astronomy Observatory. | HYDRA | 316@7.0 | 4500-9000 | 950 | 7.8 | 91 |
| CTIO/4m | HYDRA | KPGL3 | 4600-7400 | 1300 | 4.6 | 48 |
| Magellan | LDSS-2 | med red & blue | 3600-850022Spectral coverage can vary as a function of slit position in the mask. | 520 | 13.5 | 41 |
| Magellan | B&C | 300 l/mm | 3700-8700 | 384 | 13.0 | 7 |
| MMT | Blue Channnel | 300 l/mm | 3500-8300 | 800 | 8.8 | 15 |
| Keck I | LRIS | 300/5000 | 4000-9000 | 484 | 13 | 5 |
| FLWO 1.5m | FAST | 300 l/mm | 3600-7500 | 850 | 5.9 | 2 |
| Class | Allaaf erg cm-2 s-1 | ||
|---|---|---|---|
| L erg s-1 | |||
| BLAGN | 139 | 132 | 130 |
| NELG | 53 | 52 | 45 |
| ALG | 18 | 16 | 13 |
| STAR | 10 | 10 | |
| Cluster | 5 | 5 | |
| No zbbOptical counter-parts with no identification | 195 | 63 | |
| No optccNo optical counter-part in either , , or . | 82 | ||
| Total | 497ddNot including clusters are counted under BLAGN, NELG or ALG. | 273 | 188 |
| Src | ChaMP Name | RA | Dec | Hardbbobserved frame; 2.5-8.0 keV; background subtracted | log fxccgalactic absorption-corrected; observed frame; 2.0-8.0 keV; units of erg cm-2 s-1 | HR | z | log Lxddrest frame; 2.0-8.0 keV; units of erg s-1 | - | - | Class | log NH | |
|---|---|---|---|---|---|---|---|---|---|---|---|---|---|
| # | (J2000) | (J2000) | counts | (cm-2) | |||||||||
| 1 | CXOMP J001845.7+163346 | 00:18:45.74 | +16:33:46.6 | 89.010.7 | –13.51 | –0.40 | 0.624 | 43.70 | 21.41 | 1.58 | 0.66 | NELG | 21.89 |
| 2 | CXOMP J001837.3+163447 | 00:18:37.38 | +16:34:47.1 | 18.4 5.8 | –14.17 | –0.71 | 2.149 | 44.37 | 19.94 | 0.23 | 0.15 | BLAGN | 21.61 |
| 3 | CXOMP J001833.4+163154 | 00:18:33.47 | +16:31:54.4 | 38.0 7.3 | –13.90 | –0.65 | 1.643 | 44.36 | 21.11 | 0.73 | 0.39 | BLAGN | 21.58 |
| 4 | CXOMP J001837.4+163757 | 00:18:37.48 | +16:37:57.7 | 19.5 7.3 | –14.13 | –0.71 | 1.506 | 44.03 | 20.90 | 0.45 | 0.16 | BLAGN | 22.35 |
| 5 | CXOMP J001828.6+163418 | 00:18:28.68 | +16:34:18.2 | 9.0 4.4 | –14.48 | –0.66 | 1.163 | 43.40 | 20.90 | 0.38 | 0.04 | BLAGN | 21.97 |
| 6 | CXOMP J001842.0+163425 | 00:18:42.09 | +16:34:25.0 | 9.3 4.6 | –14.50 | 0.04 | 0.550 | 42.59 | 21.23 | 2.66 | 0.82 | ALG | 22.14 |
| 7 | CXOMP J001825.0+163653 | 00:18:25.01 | +16:36:53.0 | 15.6 6.1 | –14.25 | –0.49 | 1.198 | 43.67 | 21.56 | –2.07 | –2.47 | BLAGN | 22.28 |
| 8 | CXOMP J001850.1+162756 | 00:18:50.14 | +16:27:56.4 | 20.5 5.9 | –14.16 | –0.63 | 1.330 | 43.87 | 21.21 | 0.35 | –0.06 | BLAGN | 22.06 |
| 9 | CXOMP J001859.8+162649 | 00:18:59.83 | +16:26:49.3 | 67.010.0 | –13.63 | –0.64 | 1.714 | 44.67 | 19.92 | 0.31 | 0.27 | BLAGN | 22.15 |
| 10 | CXOMP J001854.9+162952 | 00:18:54.92 | +16:29:52.8 | 10.1 4.9 | –14.46 | –0.68 | 2.950 | 44.41 | 21.78 | 0.21 | –0.14 | BLAGN | 22.54 |
| 11 | CXOMP J001810.2+163223 | 00:18:10.24 | +16:32:23.9 | 54.2 8.8 | –13.72 | –0.61 | 1.273 | 44.26 | 19.62 | 0.33 | 0.01 | BLAGN | 21.46 |
| 12 | CXOMP J001801.7+163426 | 00:18:01.72 | +16:34:26.0 | 42.6 9.3 | –13.81 | –0.09 | 0.329 | 42.74 | 19.76 | 1.63 | 0.34 | NELG | 22.33 |
| 13 | CXOMP J001827.0+162900 | 00:18:27.08 | +16:29:00.1 | 13.1 4.8 | –14.33 | –0.55 | 2.828 | 44.49 | 21.27 | 0.10 | –0.16 | BLAGN | 23.02 |
| 14 | CXOMP J015327.3–135223 | 01:53:27.30 | –13:52:23.8 | 123.713.3 | –13.02 | –0.65 | 0.326 | 43.52 | 19.01 | 0.88 | 0.19 | BLAGN | 21.13 |
| 15 | CXOMP J015311.1–135104 | 01:53:11.14 | –13:51:04.3 | 64.9 9.7 | –13.36 | –0.44 | 0.949 | 44.30 | 21.37 | 0.32 | 0.19 | BLAGN | 21.71 |
| 16 | CXOMP J015312.3–135723 | 01:53:12.39 | –13:57:23.5 | 27.2 6.7 | –13.76 | –0.61 | 1.454 | 44.36 | 20.45 | 0.57 | 0.14 | BLAGN | 21.87 |
| 17 | CXOMP J015308.0–135801 | 01:53:08.06 | –13:58:01.0 | 13.1 5.0 | –14.05 | –0.74 | 1.793 | 44.29 | 19.37 | 0.23 | 0.21 | BLAGN | 21.68 |
| 18 | CXOMP J015234.7–134735 | 01:52:34.70 | –13:47:35.8 | 23.9 7.9 | –13.77 | 0.25 | 0.168 | 42.12 | 17.84 | 0.93 | 0.36 | BLAGN | 21.88 |
| 19 | CXOMP J015243.8–135900 | 01:52:43.83 | –13:59:00.7 | 42.7 7.6 | –13.57 | –0.72 | 1.674 | 44.71 | 20.88 | 0.12 | 0.08 | BLAGN | 21.14 |
| 20 | CXOMP J015239.8–135740 | 01:52:39.88 | –13:57:40.3 | 75.9 9.8 | –13.31 | –0.31 | 0.868 | 44.25 | 21.47 | 1.71 | 0.68 | BLAGN | 22.31 |
| 21 | CXOMP J015234.8–140205 | 01:52:34.87 | –14:02:05.3 | 14.0 5.5 | –14.02 | –0.68 | 1.812 | 44.34 | 22.08 | 0.67 | 0.45 | BLAGN | 21.99 |
| 22 | CXOMP J015234.7–135929 | 01:52:34.76 | –13:59:29.1 | 9.8 4.4 | –14.19 | –0.54 | 0.744 | 43.21 | 20.69 | 0.81 | 0.43 | BLAGN | 21.94 |
| 23 | CXOMP J015235.4–140336 | 01:52:35.45 | –14:03:36.2 | 14.2 6.2 | –14.01 | –0.36 | 2.418 | 44.66 | 21.98 | 0.30 | 0.07 | BLAGN | 22.76 |
| 24 | CXOMP J033752.4–045549 | 03:37:52.44 | –04:55:49.0 | 57.2 9.1 | –13.54 | –0.36 | 0.371 | 43.14 | 19.88 | 1.52 | 0.56 | NELG | 21.70 |
| 25 | CXOMP J033812.3–050252 | 03:38:12.39 | –05:02:52.3 | 13.7 6.0 | –14.16 | –0.63 | 1.464 | 43.97 | 21.76 | 0.60 | 0.39 | BLAGN | 22.05 |
| 26 | CXOMP J033804.2–050312 | 03:38:04.20 | –05:03:12.5 | 32.4 7.0 | –13.79 | –0.62 | 0.587 | 43.37 | 20.62 | 1.21 | 0.74 | BLAGN | 21.17 |
| 27 | CXOMP J033800.4–050811 | 03:38:00.43 | –05:08:11.4 | 19.9 6.5 | –14.01 | –0.55 | 0.434 | 42.82 | 21.09 | 1.65 | 0.71 | ALG | 20.99 |
| 28 | CXOMP J033723.1–045602 | 03:37:23.12 | –04:56:02.4 | 23.8 7.4 | –13.86 | –0.42 | 0.944 | 43.80 | 21.91 | 1.41 | 0.72 | BLAGN | 22.30 |
| 29 | CXOMP J033731.4–050502 | 03:37:31.44 | –05:05:02.2 | 11.3 4.7 | –14.26 | 0.22 | 0.295 | 42.19 | 19.65 | 1.78 | 0.64 | NELG | 23.70 |
| 30 | CXOMP J033717.0–050455 | 03:37:17.05 | –05:04:55.4 | 31.8 7.8 | –13.78 | –0.46 | 1.859 | 44.60 | 20.79 | 0.16 | 0.46 | BLAGN | 22.34 |
| 31 | CXOMP J034015.4–352848 | 03:40:15.43 | –35:28:48.6 | 57.6 9.8 | –13.45 | –0.79 | 1.737 | 44.86 | 18.80 | 0.17 | 0.20 | BLAGN | 21.33 |
| 32 | CXOMP J033940.2–353040 | 03:39:40.20 | –35:30:40.3 | 16.7 5.5 | –14.04 | –0.74 | 0.454 | 42.84 | 21.08 | 1.38 | 0.51 | NELG | 21.56 |
| 33 | CXOMP J034019.2–353124 | 03:40:19.21 | –35:31:24.8 | 29.4 9.4 | –13.69 | –0.66 | 1.348 | 44.35 | 21.38 | 0.39 | 0.06 | BLAGN | 22.28 |
| 34 | CXOMP J033942.8–352409 | 03:39:42.89 | –35:24:09.6 | 25.7 6.3 | –13.89 | –0.87 | 1.042 | 43.87 | 18.93 | 0.08 | –0.07 | BLAGN | 20.74 |
| 35 | CXOMP J033938.2–352351 | 03:39:38.23 | –35:23:51.9 | 16.8 5.3 | –14.07 | –0.76 | 0.465 | 42.84 | 21.16 | 0.98 | 0.38 | BLAGN | 21.07 |
| 36 | CXOMP J033912.1–352811 | 03:39:12.13 | –35:28:11.4 | 158.513.8 | –12.78 | –0.68 | 0.463 | 44.12 | 20.11 | 1.75 | 0.62 | BLAGN | 21.54 |
| 37 | CXOMP J033949.7–352348 | 03:39:49.77 | –35:23:48.8 | 12.2 4.8 | –14.21 | –0.40 | 0.522 | 42.82 | 20.41 | 2.16 | 0.66 | NELG | 22.05 |
| 38 | CXOMP J033934.1–352349 | 03:39:34.19 | –35:23:49.3 | 13.1 4.8 | –14.18 | 0.24 | 0.533 | 42.87 | 21.52 | 2.50 | 0.95 | NELG | 23.33 |
| 39 | CXOMP J033909.6–352707 | 03:39:09.67 | –35:27:07.3 | 13.3 5.9 | –14.14 | –0.77 | 0.525 | 42.89 | 20.61 | 1.68 | 0.61 | NELG | 21.51 |
| 40 | CXOMP J045452.6–025511 | 04:54:52.68 | –02:55:11.8 | 45.310.5 | –13.57 | 0.47 | 0.619 | 43.64 | 21.16 | 1.85 | 0.77 | NELG | 23.01 |
| 41 | CXOMP J045407.1–025400 | 04:54:07.10 | –02:54:00.9 | 17.8 5.6 | –14.03 | –0.61 | 1.193 | 43.88 | 21.48 | 0.09 | –0.41 | BLAGN | 21.46 |
| 42 | CXOMP J045422.1–025124 | 04:54:22.11 | –02:51:24.6 | 49.8 9.1 | –13.57 | –0.65 | 0.292 | 42.86 | 19.03 | 1.73 | 0.51 | BLAGN | 21.10 |
| 43 | CXOMP J045415.4–025429 | 04:54:15.40 | –02:54:29.2 | 10.2 4.6 | –14.29 | –0.56 | 0.491 | 42.67 | 21.17 | 2.22 | 0.76 | ALG | 21.68 |
| 44 | CXOMP J045424.7–025849 | 04:54:24.78 | –02:58:49.1 | 22.9 6.0 | –13.94 | –0.43 | 0.724 | 43.43 | 20.99 | 2.36 | 1.06 | NELG | 21.39 |
| 45 | CXOMP J045422.6–030034 | 04:54:22.62 | –03:00:34.6 | 12.0 4.7 | –14.23 | –0.73 | 1.936 | 44.20 | 20.77 | 0.28 | 0.34 | BLAGN | 21.49 |
| 46 | CXOMP J045419.6–030419 | 04:54:19.66 | –03:04:19.9 | 100.511.5 | –13.29 | –0.75 | 0.775 | 44.15 | 18.29 | 0.34 | 0.16 | BLAGN | 20.03 |
| 47 | CXOMP J045356.3–025837 | 04:53:56.36 | –02:58:37.0 | 95.910.9 | –13.29 | –0.51 | 0.129 | 42.35 | 18.67 | 1.37 | 0.44 | BLAGN | 20.90 |
| 48 | CXOMP J045356.7–030225 | 04:53:56.79 | –03:02:25.6 | 20.2 6.1 | –14.01 | 0.50 | 0.423 | 42.80 | 20.05 | 2.24 | 0.60 | NELG | 22.71 |
| 49 | CXOMP J054240.8–405626 | 05:42:40.81 | –40:56:26.3 | 46.5 7.9 | –13.65 | +0.69 | 0.639 | 43.59 | 21.06 | 3.15 | 1.06 | NELG | 23.30 |
| 50 | CXOMP J054319.2–405750 | 05:43:19.25 | –40:57:50.5 | 69.4 9.7 | –13.49 | –0.71 | 0.337 | 43.09 | 19.33 | 1.03 | 0.25 | NELG | 20.13 |
| 51 | CXOMP J054328.1–405648 | 05:43:28.12 | –40:56:48.1 | 13.4 6.1 | –14.17 | –0.38 | 1.185 | 43.73 | 21.71 | 1.04 | 0.31 | BLAGN | 22.29 |
| 52 | CXOMP J054330.4–405746 | 05:43:30.47 | –40:57:46.9 | 38.4 8.2 | –13.73 | +0.33 | 0.423 | 43.08 | 21.70 | 1.86 | 0.53 | NELG | 22.83 |
| 53 | CXOMP J054320.6–405619 | 05:43:20.63 | –40:56:19.9 | 29.0 7.1 | –13.87 | +0.10 | 0.424 | 42.95 | 20.71 | 1.79 | 0.55 | NELG | 22.56 |
| 54 | CXOMP J054242.5–405834 | 05:42:42.51 | –40:58:34.0 | 27.4 6.4 | –13.86 | –0.73 | 1.442 | 44.25 | 18.85 | 0.46 | 0.08 | BLAGN | 21.40 |
| 55 | CXOMP J054234.1–405836 | 05:42:34.11 | –40:58:36.7 | 39.6 7.4 | –13.69 | –0.45 | 0.948 | 43.97 | 19.35 | 0.12 | –0.14 | BLAGN | 22.08 |
| 56 | CXOMP J054225.9–405846 | 05:42:25.94 | –40:58:46.5 | 33.5 7.0 | –13.77 | –0.60 | 1.462 | 44.36 | 20.70 | 0.67 | 0.16 | BLAGN | 21.83 |
| 57 | CXOMP J054232.8–405627 | 05:42:32.88 | –40:56:27.7 | 18.6 5.6 | –14.03 | –0.27 | 1.191 | 43.87 | 22.00 | 0.75 | 0.11 | BLAGN | 22.66 |
| 58 | CXOMP J054255.0–405956 | 05:42:55.07 | –40:59:56.7 | 32.3 6.9 | –13.84 | –0.61 | 2.628 | 44.91 | 20.43 | 0.22 | –0.06 | BLAGN | 22.25 |
| 59 | CXOMP J054255.0–405922 | 05:42:55.01 | –40:59:22.7 | 10.4 4.4 | –14.25 | 0.28 | 0.644 | 43.00 | 22.25 | 2.81 | 0.90 | NELG | 23.78 |
| 60 | CXOMP J054251.4–410205 | 05:42:51.46 | –41:02:05.2 | 23.2 6.0 | –13.97 | –0.63 | 0.637 | 43.27 | 19.80 | 1.22 | 0.60 | ALG | 21.70 |
| 61 | CXOMP J054248.2–410140 | 05:42:48.28 | –41:01:40.3 | 18.5 5.5 | –14.07 | –0.62 | 0.634 | 43.16 | 20.81 | 0.60 | 0.31 | NELG | 21.42 |
| 62 | CXOMP J054259.5–410241 | 05:42:59.55 | –41:02:41.4 | 23.1 6.1 | –13.95 | –0.27 | 0.638 | 43.29 | 20.67 | 1.64 | 0.67 | NELG | 22.09 |
| 63 | CXOMP J054245.6–410607 | 05:42:45.62 | –41:06:07.0 | 17.0 6.3 | –14.06 | –0.42 | 0.725 | 43.32 | 22.44 | 1.74 | 0.82 | BLAGN | 21.99 |
| 64 | CXOMP J054230.5–410405 | 05:42:30.58 | –41:04:05.0 | 13.1 5.6 | –14.19 | –0.48 | 1.583 | 44.02 | 21.85 | 1.86 | 0.70 | BLAGN | 22.43 |
| 65 | CXOMP J062917.6+820534 | 06:29:17.66 | +82:05:34.2 | 77.410.6 | –13.38 | –0.58 | 1.101 | 44.44 | 20.76 | 0.62 | 0.05 | BLAGN | 22.06 |
| 66 | CXOMP J063020.5+815938 | 06:30:20.50 | +81:59:38.0 | 17.6 8.2 | –14.02 | –0.81 | 0.742 | 43.38 | 20.31 | 0.57 | 0.41 | BLAGN | 21.18 |
| 67 | CXOMP J062423.8+820938 | 06:24:23.86 | +82:09:38.2 | 28.9 7.5 | –13.84 | –0.63 | 2.585 | 44.89 | 19.60 | 0.15 | 0.09 | BLAGN | 22.36 |
| 68 | CXOMP J062741.2+820406 | 06:27:41.22 | +82:04:06.9 | 27.3 6.5 | –13.87 | –0.64 | 0.259 | 42.44 | 19.47 | 1.16 | 0.43 | NELG | 21.15 |
| 69 | CXOMP J062652.8+820441 | 06:26:52.81 | +82:04:41.2 | 9.6 4.4 | –14.34 | –0.73 | 2.334 | 44.29 | 20.53 | 0.66 | 0.40 | BLAGN | 21.97 |
| 70 | CXOMP J062648.6+815932 | 06:26:48.64 | +81:59:32.6 | 10.1 4.6 | –14.34 | –0.60 | 2.346 | 44.30 | 22.35 | 0.06 | 0.16 | BLAGN | 22.39 |
| 71 | CXOMP J074100.8+311853 | 07:41:00.81 | +31:18:53.0 | 13.5 5.2 | –13.92 | –0.52 | 0.932 | 43.72 | 21.01 | 0.75 | 0.11 | BLAGN | 22.35 |
| 72 | CXOMP J074056.1+311208 | 07:40:56.14 | +31:12:08.6 | 9.1 4.3 | –14.17 | –0.62 | 0.396 | 42.57 | 21.00 | 1.43 | 0.39 | BLAGN | 21.55 |
| 73 | CXOMP J084127.2+131411 | 08:41:27.21 | +13:14:11.5 | 164.414.9 | –12.91 | –0.75 | 1.545 | 45.28 | 18.93 | 0.57 | 0.54 | BLAGN | 21.12 |
| 74 | CXOMP J084128.2+131106 | 08:41:28.21 | +13:11:06.8 | 40.9 9.4 | –13.48 | –0.66 | 1.866 | 44.91 | 21.04 | 0.47 | 0.74 | BLAGN | 22.65 |
| 75 | CXOMP J084120.2+130721 | 08:41:20.25 | +13:07:21.8 | 46.9 9.5 | –13.44 | –0.61 | 0.303 | 43.03 | 19.13 | 1.46 | 0.67 | NELG | 21.66 |
| 76 | CXOMP J084054.3+131456 | 08:40:54.30 | +13:14:56.6 | 82.510.2 | –13.25 | –0.69 | 0.310 | 43.24 | 19.65 | 1.50 | 0.67 | BLAGN | 21.30 |
| 77 | CXOMP J084040.8+131726 | 08:40:40.82 | +13:17:26.6 | 24.5 6.3 | –13.75 | –0.60 | 2.820 | 45.07 | 20.33 | 0.25 | 0.37 | BLAGN | 22.80 |
| 78 | CXOMP J084102.9+131716 | 08:41:02.96 | +13:17:16.5 | 33.0 7.2 | –13.63 | 0.48 | 0.454 | 43.25 | 21.17 | 0.60 | 0.76 | NELG | 23.29 |
| 79 | CXOMP J084052.1+131822 | 08:40:52.12 | +13:18:22.9 | 39.1 7.6 | –13.54 | –0.25 | 0.490 | 43.42 | 20.63 | 2.26 | 1.03 | NELG | 22.38 |
| 80 | CXOMP J084045.2+131617 | 08:40:45.28 | +13:16:17.4 | 13.3 4.8 | –14.04 | 0.11 | 0.573 | 43.09 | 21.72 | 2.36 | 1.19 | NELG | 23.37 |
| 81 | CXOMP J084102.5+131313 | 08:41:02.58 | +13:13:13.4 | 9.2 4.3 | –14.08 | –0.70 | 2.968 | 44.80 | 19.28 | 0.42 | 0.52 | BLAGN | 22.41 |
| 82 | CXOMP J105623.1–034315 | 10:56:23.12 | –03:43:15.5 | 22.7 9.0 | –14.11 | –0.37 | 0.429 | 42.71 | 20.94 | 1.18 | 0.30 | NELG | 22.35 |
| 83 | CXOMP J105618.1–034240 | 10:56:18.10 | –03:42:40.5 | 43.411.7 | –13.89 | –0.55 | 0.181 | 42.07 | 18.93 | 1.35 | 0.43 | NELG | 21.89 |
| 84 | CXOMP J105626.7–033721 | 10:56:26.77 | –03:37:21.3 | 78.911.5 | –13.65 | +0.33 | 0.643 | 43.60 | 21.26 | 2.62 | 1.04 | ALG | 23.21 |
| 85 | CXOMP J105612.3–033501 | 10:56:12.37 | –03:35:01.5 | 41.615.2 | –13.89 | –0.72 | 2.315 | 44.73 | 21.31 | 0.28 | 0.22 | BLAGN | 22.56 |
| 86 | CXOMP J105643.1–034042 | 10:56:43.11 | –03:40:42.2 | 127.512.4 | –13.41 | –0.78 | 2.118 | 45.11 | 18.15 | 0.27 | 0.27 | BLAGN | 21.78 |
| 87 | CXOMP J105655.1–034322 | 10:56:55.10 | –03:43:22.4 | 19.5 5.8 | –14.28 | –0.77 | 4.050 | 44.92 | 22.35 | 2.22 | 0.32 | BLAGN | 22.70 |
| 88 | CXOMP J105659.4–034716 | 10:56:59.43 | –03:47:15.5 | 59.810.6 | –13.77 | –0.59 | 1.784 | 44.57 | 22.27 | 1.58 | 0.80 | BLAGN | 22.46 |
| 89 | CXOMP J105646.5–034707 | 10:56:46.38 | –03:47:08.4 | 17.6 8.6 | –14.29 | –0.75 | 2.248 | 44.30 | 22.05 | 0.06 | 0.09 | BLAGN | 22.64 |
| 90 | CXOMP J105655.5–034030 | 10:56:55.59 | –03:40:30.1 | 33.0 7.0 | –14.06 | –0.79 | 0.698 | 43.27 | 21.29 | 0.87 | 0.58 | BLAGN | 21.20 |
| 91 | CXOMP J105646.4–033905 | 10:56:46.47 | –03:39:05.5 | 30.3 6.7 | –14.09 | –0.73 | 1.250 | 43.87 | 21.87 | 0.44 | 0.20 | BLAGN | 21.56 |
| 92 | CXOMP J105700.0–033445 | 10:57:00.06 | –03:34:45.6 | 14.9 5.9 | –14.39 | –0.65 | 1.177 | 43.50 | 22.07 | 0.71 | 0.24 | BLAGN | 22.02 |
| 93 | CXOMP J105650.6–033508 | 10:56:50.63 | –03:35:08.2 | 16.4 5.9 | –14.36 | –0.83 | 0.818 | 43.14 | 21.93 | 0.97 | 0.67 | BLAGN | 20.63 |
| 94 | CXOMP J105641.2–033853 | 10:56:41.29 | –03:38:53.2 | 9.9 4.7 | –14.56 | –0.69 | 2.697 | 44.21 | 21.24 | 0.25 | 0.12 | BLAGN | 22.82 |
| 95 | CXOMP J114215.1+660548 | 11:42:15.19 | +66:05:48.4 | 38.211.3 | –14.09 | +0.31 | 0.414 | 42.70 | 20.75 | 2.26 | 0.67 | NELG | 22.73 |
| 96 | CXOMP J114044.3+660311 | 11:40:44.31 | +66:03:11.8 | 59.3 9.1 | –13.94 | –0.68 | 2.310 | 44.67 | 20.56 | 0.10 | 0.16 | BLAGN | 22.06 |
| 97 | CXOMP J114028.0+660320 | 11:40:28.01 | +66:03:20.1 | 22.6 6.4 | –14.34 | –0.62 | 1.957 | 44.10 | 21.64 | 1.31 | 0.34 | BLAGN | 21.97 |
| 98 | CXOMP J114021.9+660428 | 11:40:21.99 | +66:04:28.8 | 35.0 7.3 | –14.17 | –0.69 | 1.413 | 43.92 | 21.27 | 0.56 | –0.12 | BLAGN | 21.09 |
| 99 | CXOMP J114024.6+660215 | 11:40:24.60 | +66:02:15.8 | 47.4 8.8 | –14.03 | –0.62 | 1.710 | 44.26 | 21.22 | 0.39 | 0.54 | BLAGN | 22.05 |
| 100 | CXOMP J114022.0+660028 | 11:40:22.00 | +66:00:28.4 | 37.4 9.4 | –14.12 | –0.72 | 1.834 | 44.25 | 21.30 | 0.57 | 0.20 | BLAGN | 21.83 |
| 101 | CXOMP J114018.5+660111 | 11:40:18.55 | +66:01:11.1 | 21.7 7.9 | –14.36 | –0.67 | 1.270 | 43.61 | 21.12 | 0.57 | 0.36 | BLAGN | 21.32 |
| 102 | CXOMP J113950.1+660025 | 11:39:50.17 | +66:00:25.0 | 55.812.9 | –13.93 | –0.64 | 0.858 | 43.62 | 21.64 | 0.51 | 0.64 | BLAGN | 21.73 |
| 103 | CXOMP J114124.3+660921 | 11:41:24.39 | +66:09:21.5 | 61.8 9.2 | –13.90 | –0.80 | 1.088 | 43.91 | 19.89 | 0.28 | 0.00 | BLAGN | 20.43 |
| 104 | CXOMP J114046.4+660913 | 11:40:46.45 | +66:09:13.0 | 16.3 5.3 | –14.44 | –0.67 | 1.933 | 43.99 | 21.72 | 0.03 | 0.42 | BLAGN | 22.21 |
| 105 | CXOMP J114031.1+660858 | 11:40:31.15 | +66:08:58.2 | 198.115.2 | –13.41 | –0.65 | 1.269 | 44.56 | 21.02 | 0.77 | 0.21 | BLAGN | 21.56 |
| 106 | CXOMP J114001.9+660642 | 11:40:01.95 | +66:06:42.3 | 29.2 7.3 | –14.24 | –0.64 | 0.481 | 42.70 | 20.25 | 2.19 | 0.77 | NELG | 21.46 |
| 107 | CXOMP J114036.2+661317 | 11:40:36.22 | +66:13:17.4 | 22.7 7.7 | –14.32 | –0.72 | 3.337 | 44.68 | 21.57 | 0.04 | 0.10 | BLAGN | 22.56 |
| 108 | CXOMP J113944.5+661137 | 11:39:44.58 | +66:11:37.1 | 66.411.7 | –13.83 | –0.66 | 2.113 | 44.69 | 20.00 | 0.98 | 0.26 | BLAGN | 21.69 |
| 109 | CXOMP J113941.2+661319 | 11:39:41.29 | +66:13:19.6 | 34.712.4 | –14.11 | –0.56 | 0.495 | 42.86 | 20.76 | 2.04 | 0.71 | ALG | 21.82 |
| 110 | CXOMP J114022.0+660816 | 11:40:22.00 | +66:08:16.3 | 24.8 7.2 | –14.30 | –0.44 | 0.786 | 43.16 | 20.37 | 3.20 | 1.42 | ALG | 21.70 |
| 111 | CXOMP J134411.0+555353 | 13:44:11.06 | +55:53:53.0 | 12.1 4.8 | –14.21 | –0.71 | 0.470 | 42.71 | 20.49 | 2.30 | 0.51 | NELG | 21.76 |
| 112 | CXOMP J134359.1+555259 | 13:43:59.14 | +55:52:59.6 | 24.1 6.6 | –13.88 | 0.34 | 0.593 | 43.28 | 20.67 | 2.59 | 0.60 | NELG | 23.32 |
| 113 | CXOMP J134450.6+555531 | 13:44:50.62 | +55:55:31.9 | 25.7 6.3 | –13.90 | –0.51 | 1.784 | 44.44 | 20.44 | 0.35 | 0.25 | BLAGN | 22.63 |
| 114 | CXOMP J134440.2+555648 | 13:44:40.21 | +55:56:48.4 | 56.0 8.6 | –13.55 | –0.78 | 1.156 | 44.32 | 19.05 | 0.27 | 0.04 | BLAGN | 21.14 |
| 115 | CXOMP J134508.0+555058 | 13:45:08.06 | +55:50:58.6 | 15.9 5.6 | –14.11 | –0.65 | 0.608 | 43.08 | 21.08 | 1.60 | 0.55 | NELG | 21.51 |
| 116 | CXOMP J141656.1+444720 | 14:16:56.18 | +44:47:20.3 | 63.1 9.1 | –13.33 | –0.48 | 0.469 | 43.58 | 21.31 | 2.37 | 0.74 | BLAGN | 21.77 |
| 117 | CXOMP J141747.4+444544 | 14:17:47.48 | +44:45:44.9 | 18.8 9.4 | –13.79 | –0.13 | 2.138 | 44.75 | 19.92 | 0.34 | 0.15 | BLAGN | 22.42 |
| 118 | CXOMP J141703.7+443851 | 14:17:03.74 | +44:38:51.1 | 26.0 8.8 | –13.58 | –0.74 | 1.600 | 44.64 | 19.43 | 0.56 | 0.26 | BLAGN | 21.92 |
| 119 | CXOMP J141624.9+444045 | 14:16:24.74 | +44:40:45.2 | 35.6 8.4 | –13.54 | –0.48 | 1.440 | 44.57 | 20.78 | 0.82 | 0.10 | BLAGN | 21.60 |
| 120 | CXOMP J141700.7+445606 | 14:17:00.77 | +44:56:06.9 | 575.525.4 | –12.30 | –0.77 | 0.114 | 43.22 | 15.93 | 0.18 | 0.15 | BLAGN | 18.99 |
| 121 | CXOMP J141656.3+445340 | 14:16:56.34 | +44:53:40.2 | 26.5 6.6 | –13.67 | +0.25 | 0.440 | 43.18 | 19.28 | 1.85 | 0.50 | NELG | 22.80 |
| 122 | CXOMP J141655.6+445453 | 14:16:55.62 | +44:54:53.1 | 25.6 6.8 | –13.68 | –0.58 | 0.579 | 43.46 | 20.86 | 2.00 | 0.53 | ALG | 21.87 |
| 123 | CXOMP J141715.0+445316 | 14:17:15.08 | +44:53:17.1 | 15.1 5.9 | –13.91 | –0.73 | 2.449 | 44.77 | 19.62 | –0.01 | 0.03 | BLAGN | 22.02 |
| 124 | CXOMP J141637.0+444645 | 14:16:37.08 | +44:46:45.6 | 46.6 7.9 | –13.47 | –0.72 | 0.394 | 43.27 | 20.02 | 0.60 | 0.23 | BLAGN | 20.33 |
| 125 | CXOMP J141624.5+445156 | 14:16:24.52 | +44:51:56.7 | 37.7 7.4 | –13.51 | –0.70 | 2.015 | 44.96 | 18.16 | 0.32 | –0.23 | BLAGN | 21.44 |
| 126 | CXOMP J141626.6+445240 | 14:16:26.69 | +44:52:40.2 | 26.9 6.6 | –13.67 | –0.46 | 0.675 | 43.63 | 20.27 | 1.55 | 0.76 | BLAGN | 21.53 |
| 127 | CXOMP J141558.7+445009 | 14:15:58.79 | +44:50:09.4 | 29.9 7.9 | –13.61 | –0.64 | 1.364 | 44.44 | 19.97 | 0.19 | –0.16 | BLAGN | 21.17 |
| 128 | CXOMP J171758.4+671203 | 17:17:58.47 | +67:12:03.1 | 45.2 8.2 | –13.69 | –0.62 | 1.800 | 44.66 | 21.05 | 0.25 | 0.26 | BLAGN | 21.84 |
| 129 | CXOMP J171740.6+671147 | 17:17:40.63 | +67:11:47.2 | 12.3 4.8 | –14.29 | –0.57 | 2.318 | 44.33 | 21.97 | –0.24 | –0.23 | BLAGN | 22.11 |
| 130 | CXOMP J171837.7+671351 | 17:18:37.76 | +67:13:51.4 | 20.0 9.3 | –14.03 | –0.58 | 1.550 | 44.16 | 20.84 | 1.03 | 0.40 | BLAGN | 22.19 |
| 131 | CXOMP J171748.3+670544 | 17:17:48.31 | +67:05:44.9 | 27.7 7.6 | –13.89 | –0.69 | 0.482 | 43.05 | 19.86 | 0.35 | 0.12 | BLAGN | 21.15 |
| 132 | CXOMP J171635.5+671626 | 17:16:35.56 | +67:16:26.0 | 21.7 6.1 | –13.98 | –0.52 | 0.505 | 43.01 | 20.43 | 1.97 | 0.48 | ALG | 21.70 |
| 133 | CXOMP J171636.9+670829 | 17:16:36.90 | +67:08:29.7 | 56.2 8.7 | –13.59 | +0.51 | 0.795 | 43.88 | 22.38 | 2.75 | 1.08 | NELG | 23.20 |
| 134 | CXOMP J171700.7+670519 | 17:17:00.70 | +67:05:19.7 | 27.1 7.0 | –13.90 | –0.63 | 1.155 | 43.97 | 20.72 | 0.30 | 0.01 | BLAGN | 21.31 |
| 135 | CXOMP J184514.8+795010 | 18:45:14.81 | +79:50:10.0 | 18.1 7.7 | –13.83 | –0.58 | 1.107 | 44.00 | 20.36 | 0.52 | –0.03 | BLAGN | 21.99 |
| 136 | CXOMP J205648.1–042937 | 20:56:48.11 | –04:29:37.9 | 34.4 9.0 | –13.73 | –0.49 | 0.172 | 42.18 | 18.72 | 1.73 | 0.57 | NELG | 21.74 |
| 137 | CXOMP J205624.8–042824 | 20:56:24.84 | –04:28:24.4 | 10.1 5.0 | –14.23 | –0.58 | 1.511 | 43.93 | 22.13 | 0.52 | 0.33 | BLAGN | 21.68 |
| 138 | CXOMP J205632.8–042650 | 20:56:32.83 | –04:26:50.4 | 21.0 7.5 | –13.95 | –0.52 | 1.511 | 44.22 | 20.18 | 0.97 | 0.50 | BLAGN | 21.95 |
| 139 | CXOMP J205638.1–043753 | 20:56:38.15 | –04:37:53.2 | 25.6 6.6 | –13.85 | –0.54 | 2.970 | 45.03 | 19.70 | 0.50 | 0.11 | BLAGN | 22.66 |
| 140 | CXOMP J205641.9–043300 | 20:56:41.98 | –04:33:00.7 | 19.4 6.1 | –13.99 | 0.48 | 0.467 | 42.92 | 20.91 | 2.18 | 0.69 | NELG | 23.22 |
| 141 | CXOMP J205620.5–043059 | 20:56:20.52 | –04:30:59.5 | 8.3 4.1 | –14.36 | –0.68 | 2.335 | 44.27 | 21.17 | –0.08 | 0.01 | BLAGN | 22.44 |
| 142 | CXOMP J205603.6–043118 | 20:56:03.61 | –04:31:18.0 | 14.8 5.2 | –14.08 | –0.66 | 1.010 | 43.65 | 21.12 | 0.37 | 0.11 | BLAGN | 21.25 |
| 143 | CXOMP J205629.1–043415 | 20:56:29.15 | –04:34:15.8 | 8.7 4.1 | –14.35 | –0.74 | 1.031 | 43.40 | 21.42 | 0.89 | 0.44 | BLAGN | 21.32 |
| 144 | CXOMP J205624.7–043533 | 20:56:24.77 | –04:35:33.8 | 41.4 7.5 | –13.68 | 0.73 | 0.261 | 42.64 | 19.48 | 1.73 | 0.56 | NELG | 23.18 |
| 145 | CXOMP J205618.6–043429 | 20:56:18.68 | –04:34:29.0 | 35.4 7.1 | –13.73 | +0.51 | 0.527 | 43.31 | 21.59 | 2.78 | 1.01 | NELG | 23.10 |
| 146 | CXOMP J205606.6–043725 | 20:56:06.64 | –04:37:25.1 | 14.5 5.1 | –14.11 | –0.76 | 1.188 | 43.79 | 19.93 | 0.56 | 0.23 | BLAGN | 21.37 |
| 147 | CXOMP J205609.3–043832 | 20:56:09.38 | –04:38:32.2 | 13.9 5.1 | –14.12 | –0.24 | 0.396 | 42.62 | 20.91 | 2.70 | 0.84 | ALG | 21.93 |
| 148 | CXOMP J205608.9–043538 | 20:56:08.93 | –04:35:38.6 | 8.4 4.1 | –14.36 | 0.08 | 1.436 | 43.75 | 21.25 | 0.57 | 0.18 | BLAGN | 23.19 |
| 149 | CXOMP J205605.4–044057 | 20:56:05.47 | –04:40:57.5 | 34.2 7.7 | –13.68 | –0.47 | 0.799 | 43.80 | 21.20 | 0.73 | 0.52 | BLAGN | 21.92 |
| 150 | CXOMP J205603.0–043613 | 20:56:03.03 | –04:36:13.4 | 10.8 4.7 | –14.24 | –0.07 | 0.469 | 42.68 | 20.83 | 2.75 | 0.94 | NELG | 22.43 |
| 151 | CXOMP J205614.8–044134 | 20:56:14.83 | –04:41:34.8 | 12.8 5.7 | –14.13 | –0.62 | 2.476 | 44.56 | 21.95 | 0.67 | 0.11 | BLAGN | 22.71 |
| 152 | CXOMP J205602.0–043644 | 20:56:02.00 | –04:36:44.8 | 14.3 5.2 | –14.11 | 0.42 | 0.466 | 42.80 | 21.74 | 3.12 | 0.98 | NELG | 23.78 |
| 153 | CXOMP J213924.9–234221 | 21:39:24.91 | –23:42:21.8 | 33.011.4 | –13.68 | –0.43 | 0.401 | 43.08 | 19.73 | 2.12 | 0.50 | NELG | 22.35 |
| 154 | CXOMP J214041.4–234719 | 21:40:41.47 | –23:47:19.9 | 255.317.9 | –12.80 | –0.75 | 0.491 | 44.17 | 18.36 | 0.11 | 0.12 | BLAGN | 20.65 |
| 155 | CXOMP J214018.0–234920 | 21:40:18.01 | –23:49:20.1 | 17.3 7.7 | –13.98 | –0.85 | 1.406 | 44.11 | 19.62 | 0.28 | –0.03 | BLAGN | 21.71 |
| 156 | CXOMP J214019.1–234837 | 21:40:19.10 | –23:48:37.7 | 24.9 7.6 | –13.83 | +0.01 | 0.387 | 42.88 | 21.59 | 1.79 | 0.43 | NELG | 22.83 |
| 157 | CXOMP J214018.3–234055 | 21:40:18.32 | –23:40:55.9 | 14.7 5.1 | –13.99 | –0.83 | 1.648 | 44.27 | 19.52 | 0.29 | 0.15 | BLAGN | 21.53 |
| 158 | CXOMP J214010.4–233905 | 21:40:10.49 | –23:39:05.1 | 27.8 6.5 | –13.70 | 0.60 | 0.453 | 43.18 | 20.66 | 2.33 | 0.58 | NELG | 23.37 |
| 159 | CXOMP J214001.4–234112 | 21:40:01.42 | –23:41:12.8 | 88.510.5 | –13.16 | –0.75 | 0.188 | 42.84 | 18.52 | 1.40 | 0.40 | NELG | 20.57 |
| 160 | CXOMP J224007.1+031813 | 22:40:07.11 | +03:18:13.3 | 84.910.4 | –13.15 | –0.72 | 0.528 | 43.89 | 18.96 | 0.81 | 0.48 | BLAGN | 20.54 |
| 161 | CXOMP J224022.8+032451 | 22:40:22.83 | +03:24:51.3 | 22.4 6.0 | –13.67 | –0.71 | 0.679 | 43.64 | 19.92 | 0.52 | 0.42 | BLAGN | 21.07 |
| 162 | CXOMP J230257.3+084834 | 23:02:57.37 | +08:48:34.8 | 82.010.3 | –13.76 | –0.60 | 1.974 | 44.69 | 18.96 | 0.34 | 0.33 | BLAGN | 22.07 |
| 163 | CXOMP J230252.2+084810 | 23:02:52.22 | +08:48:10.9 | 24.3 6.2 | –14.27 | –0.65 | 1.407 | 43.81 | 21.20 | 0.41 | 0.18 | BLAGN | 21.85 |
| 164 | CXOMP J230252.1+085520 | 23:02:52.17 | +08:55:20.9 | 24.611.6 | –14.23 | –0.46 | 3.757 | 44.90 | 20.37 | 1.70 | 0.25 | BLAGN | 23.72 |
| 165 | CXOMP J230250.9+085311 | 23:02:50.91 | +08:53:11.6 | 23.6 9.0 | –14.27 | –0.05 | 0.453 | 42.61 | 20.21 | 2.11 | 0.64 | ALG | 22.27 |
| 166 | CXOMP J230300.9+084659 | 23:03:00.98 | +08:46:59.6 | 261.617.3 | –13.24 | –0.47 | 0.738 | 44.15 | 21.88 | 1.34 | 0.66 | BLAGN | 21.59 |
| 167 | CXOMP J230314.5+084845 | 23:03:14.50 | +08:48:45.0 | 89.412.2 | –13.68 | 0.74 | 0.229 | 42.51 | 19.70 | 2.00 | 0.67 | ALG | 23.29 |
| 168 | CXOMP J230304.6+084130 | 23:03:04.60 | +08:41:30.4 | 12.7 5.7 | –14.51 | –0.61 | 2.592 | 44.22 | 22.06 | 0.21 | 0.10 | BLAGN | 22.45 |
| 169eeSource fell near the chip gap. No spectral fitting is performed. | CXOMP J230246.0+084523 | 23:02:46.05 | +08:45:23.8 | 109.311.5 | –13.20 | –0.46 | 1.944 | 45.23 | 19.08 | 0.51 | 0.55 | BLAGN | |
| 170 | CXOMP J230221.6+084653 | 23:02:21.66 | +08:46:53.0 | 63.1 9.9 | –13.82 | –0.36 | 0.680 | 43.48 | 21.78 | 1.47 | 0.66 | NELG | 21.98 |
| 171 | CXOMP J230218.0+084409 | 23:02:18.09 | +08:44:09.4 | 30.8 8.3 | –14.13 | –0.65 | 0.988 | 43.57 | 20.38 | 0.39 | 0.16 | BLAGN | 21.37 |
| 172 | CXOMP J230204.1+084654 | 23:02:04.18 | +08:46:54.8 | 54.813.7 | –13.84 | –0.46 | 0.230 | 42.35 | 18.43 | 1.67 | 0.62 | NELG | 21.77 |
| 173 | CXOMP J230211.1+084654 | 23:02:11.13 | +08:46:57.6 | 27.710.0 | –14.16 | –0.18 | 2.570 | 44.57 | 21.35 | 0.30 | 0.07 | BLAGN | 23.34 |
| 174 | CXOMP J230254.3+083904 | 23:02:54.38 | +08:39:04.9 | 462.922.9 | –12.99 | –0.57 | 0.437 | 43.85 | 19.00 | 0.91 | 0.46 | BLAGN | 21.24 |
| 175 | CXOMP J230243.0+083946 | 23:02:43.01 | +08:39:46.7 | 47.3 8.6 | –13.98 | –0.53 | 0.438 | 42.86 | 19.26 | 2.31 | 0.74 | ALG | 21.69 |
| 176 | CXOMP J230240.2+083611 | 23:02:40.21 | +08:36:11.1 | 265.019.0 | –13.20 | –0.53 | 1.957 | 45.24 | 20.76 | 0.67 | 0.60 | BLAGN | 22.20 |
| 177 | CXOMP J234849.7+010716 | 23:48:49.77 | +01:07:16.2 | 28.310.7 | –13.76 | –0.61 | 1.660 | 44.50 | 20.01 | 0.42 | 0.23 | BLAGN | 21.81 |
| 178 | CXOMP J234812.8+010022 | 23:48:12.89 | +01:00:22.3 | 29.6 6.5 | –13.89 | –0.74 | 0.718 | 43.48 | 20.95 | 0.90 | 0.50 | BLAGN | 21.31 |
| 179 | CXOMP J234826.2+010330 | 23:48:26.26 | +01:03:30.7 | 67.5 9.5 | –13.51 | –0.74 | 2.174 | 45.04 | 20.92 | 0.23 | 0.21 | BLAGN | 22.01 |
| 180 | CXOMP J234823.2+010357 | 23:48:23.26 | +01:03:57.8 | 13.9 5.3 | –14.20 | –0.77 | 2.234 | 44.38 | 21.40 | –0.11 | 0.02 | BLAGN | 22.26 |
| 181 | CXOMP J234810.5+010552 | 23:48:10.54 | +01:05:51.9 | 27.9 7.5 | –13.88 | –0.73 | 1.859 | 44.51 | 19.31 | 0.32 | 0.16 | BLAGN | 22.33 |
| 182 | CXOMP J234752.5+010306 | 23:47:52.55 | +01:03:06.8 | 15.0 6.5 | –14.10 | –0.51 | 2.411 | 44.56 | 20.60 | 0.36 | 0.05 | BLAGN | 22.74 |
| 183 | CXOMP J234835.3+005832 | 23:48:35.33 | +00:58:32.6 | 84.010.5 | –13.52 | –0.72 | 0.946 | 44.14 | 20.87 | 0.38 | 0.13 | BLAGN | 21.37 |
| 184 | CXOMP J234820.8+010024 | 23:48:20.82 | +01:00:24.2 | 51.0 8.3 | –13.80 | –0.75 | 1.210 | 44.12 | 21.31 | 0.79 | 0.09 | BLAGN | 21.07 |
| 185 | CXOMP J234818.9+005950 | 23:48:18.94 | +00:59:50.1 | 27.3 6.5 | –14.08 | –0.77 | 1.937 | 44.35 | 22.14 | 0.33 | 0.24 | BLAGN | 21.55 |
| 186 | CXOMP J234813.7+005640 | 23:48:13.76 | +00:56:40.0 | 10.0 4.6 | –14.51 | –0.11 | 1.042 | 43.25 | 20.37 | 0.57 | 0.09 | BLAGN | 23.16 |
| 187 | CXOMP J234811.5+005700 | 23:48:11.54 | +00:57:00.4 | 23.7 6.1 | –14.13 | –0.82 | 1.815 | 44.23 | 21.74 | 0.57 | 0.42 | BLAGN | 21.16 |
| 188 | CXOMP J234820.2+005437 | 23:48:20.21 | +00:54:37.3 | 44.0 8.1 | –13.88 | +0.21 | 0.279 | 42.51 | 19.33 | 1.52 | 0.46 | NELG | 22.60 |