Multiwavelength observations of the supernova remnant G349.7+0.2 interacting with a molecular cloud
Abstract
We present molecular-line observations at millimetre, centimetre and infrared wavelengths of the region containing OH(1720 MHz) masers in the supernova remnant (SNR) G349.7+0.2, using the Australia Telescope (AT) Mopra antenna, the Swedish-ESO Submillimeter Telescope, the AT Compact Array and the UNSW Infrared Fabry-Perot narrow-band filter installed on the Anglo Australian Telescope. Several molecular transitions were observed between 1.6 and 3 mm to constrain the physical parameters of the molecular cloud interacting with the SNR and to investigate the effects of the SNR shock on the gas chemistry. We detected shock-excited near-infrared H2 emission towards the centre of the SNR, revealing highly clumped molecular gas and a good correlation with published mid-infrared images from the Spitzer Space Telescope. An excellent correlation between the H2 clumps and OH(1720 MHz) maser positions supports the shock excitation of the OH(1720 MHz) maser emission. Furthermore, we detected OH absorption at 1665 and 1667 MHz which shows a good correlation with the shocked H2 emission and the masers. We found maser emission at 1665 MHz near the OH(1720 MHz) masers in this SNR, which is found to be associated with a GLIMPSE source SSTGLMC G349.7294+00.1747. We also detected 1665 and 1667 MHz OH masers, and weak 4.8 GHz H2CO absorption towards the ultra-compact H ii region IRAS 17147–3725 located to the southeast of the SNR. We found no 4.7- or 6-GHz excited-state OH masers or 6-GHz CH3OH maser towards either the SNR or the H ii region.
keywords:
supernova remnants – ISM: clouds, masers, shock waves – individual: G349.7+0.2, IRAS 17147–3725 – infrared: ISM1 Introduction
The young, massive stars which are progenitors of supernova remnants (SNRs) live only a relatively short time (a few million years) and do not move far from the molecular clouds from which they are born. Hence it is expected that SNRs formed from such massive stars should be found in close proximity to their parent molecular clouds. The shocks driven by SNRs into dense molecular clouds compress, accelerate and heat the gas. They can partially or completely disrupt the clouds and may initiate star formation by triggering further gravitational collapse following the cooling of the compressed gas. The shocks also provide energy which can potentially excite higher molecular transitions and activate chemical reactions forbidden in cold molecular clouds, changing the chemical abundances in the cloud. Thus, observations of molecular clouds which have interacted with a supernova blast wave can provide important information about the physical and chemical processes associated with the shocks.
For many years, the best unambiguous case of an SNR-molecular cloud interaction was the object IC 443, where broadened molecular lines (see DeNoyer, 1979; van Dishoeck, Jansen & Phillips, 1993, and references therein) and shocked molecular hydrogen (Burton et al., 1988) were detected. However, recent detections of OH(1720 MHz) maser emission near the boundary regions of of the Galactic SNRs (Frail, Goss & Slysh, 1994; Frail et al., 1996; Yusef-Zadeh et al., 1996; Green et al., 1997; Koralesky et al., 1998) have become signposts of the SNR interaction with molecular clouds. This maser emission, usually unaccompanied by maser emission in the other three ground-state transitions, is excited from OH collisions with H2 molecules in a gas with temperatures between 50–125 K, a density of cm-3 and an OH column density between and cm-2 (Elitzur, 1976; Lockett, Gauthier & Elitzur, 1999). These conditions can be found in cooling gas behind a non-dissociative C shock, irradiated by the X-ray flux from the SNR interior (Wardle, 1999). Hence, SNRs associated with this maser emission are good candidates for studies of shock phenomena in molecular clouds. Follow-up molecular-line observations of these SNRs have confirmed the presence of shocked molecular gas towards the OH(1720 MHz) maser locations (eg Frail & Mitchell, 1998; Reach & Rho, 1999, 2000; Lazendic et al., 2002; Reach et al., 2002, 2005; Lazendic et al., 2004; Reach et al., 2006). Furthermore, new observations with improved sensitivity raised the fraction of maser-emitting SNRs to 15%, implying that this fraction might become even higher with deeper searches for OH(1720 MHz) masers (Hewitt & Yusef-Zadeh, 2009).
One of the SNRs associated with OH(1720 MHz) maser emission is G349.7+0.2. This is the third brightest Galactic SNR at radio wavelengths, after Cas A and the Crab Nebula (Shaver et al., 1985). It is classified as a shell-type remnant from the radio continuum image, which has a circular shape ( arcmin in diameter) with a bright periphery, and a typical spectral index of . However, it has a southern enhancement that is different from the morphology of typical shell SNRs. Five OH(1720 MHz) masers have been detected along the bright emission ridge of the SNR (Frail et al., 1996) with radial LSR (local standard of rest) velocities ranging from 14.3 to 16.9 km s-1. Their properties are listed in Table 1. A magnetic field with a strength of mG has been measured towards the brightest of the masers (Brogan et al., 2000). The distance to the SNR is estimated to be 18.34.6 kpc from H i absorption measurements (Caswell et al., 1975), and the maser velocities are consistent with this value ( kpc; Frail et al., 1996). The SNR is predicted to be yrs old and its X-ray morphology is strikingly similar to the radio morphology (Lazendic et al., 2005), suggestive of expansion into a medium with a large density gradient, as has been observed in the 12CO 1–0 line by Reynoso & Mangum (2001), with a resolution of 54 arcsec. Dubner et al. (2004) observed 12CO1–0, 2–1 and 3–2 lines towards the central part of the SNR and the location of OH masers, and found the line ratios indicative of shocked molecular gas.
To investigate the effects of SNR shocks on interstellar molecular gas and to test the models for the generation of OH(1720 MHz) emission via shocks, we carried out molecular-line observations in both radio and infrared bands. We used observations of molecular hydrogen to trace recently shocked gas identified by the presence of the masers. Molecular lines at millimetre wavelengths were used to probe the structure, dynamics and composition of the molecular gas in which masers are created. OH line observations at centimetre wavelengths (1665 and 1667 MHz) were used to derive OH column densities and to test the model for OH(1720 MHz) maser production. We also searched for excited-state OH maser emission at 4.7 GHz and 6.0 GHz, CH3OH maser emission at 6 GHz, and H2CO absorption at 4.8 GHz. We summarize the observations in Section 2 and present the results in Section 3. The results are discussed in Section 4, and our conclusions are given in Section 5.
2 Observations
2.1 Molecular-line observations at mm wavelengths
To obtain the extent of the molecular cloud associated with G349.7+0.2 we used the 22 m Australia Telescope Mopra antenna during October 1998. Observations of the 3-mm 1–0 transition of 13CO were undertaken on a point grid centred at , , with a 30 arcsec grid and 60 second integration per position. For observations of other molecular species (12CO, CS, HCO+, HCN, H2CO, SiO and SO) we used the 15 m Swedish-ESO Submillimetre Telescope (SEST) telescope in February and June 1999. The observed transitions, their frequencies and corresponding beamwidths are given in Table 2. Most of the transitions were observed over a arcmin2 region centred at , , with a 24 arcsec grid spacing and 60 second integration per position. Due to the overall weak emission of the CS, H2CO, SO and SiO lower energy transitions, higher transitions for these species were observed only at the maser positions in a five-point cross grid with 20 arcsec offset. For all transitions a position-switching observing mode was used with a reference position at , .
When the 13CO observations at 110 GHz were carried out with the Mopra telescope, the effective diameter of the dish was 15 m with a corresponding beamwidth of about 43 arcsec, slightly smaller than the SEST beamwidth of about 45 arcsec for the 115-GHz 12CO observations. For the Mopra observations, the attenuation due to atmospheric absorption was corrected using measurements of a black body paddle at ambient temperature (see Hunt Cunningham et al., 2003, for more details). The corrected intensities were then matched to the main-beam temperature scale of the SEST by observing the molecular cloud in the direction of the Ori A SiO maser and scaling the observed intensities to their SEST counterparts. The final intensity calibration is believed to be accurate to within . The SEST observations were similarly corrected for atmospheric attenuation during the observations, and then corrected for the main-beam efficiency (0.74, 0.70, 0.67 and 0.45 at 85–100 GHz, 100–115 GHz, 130–150 GHz and 220–265 GHz respectively). For both telescopes the pointing was corrected approximately every 2 hours by observations of the 86 GHz SiO masers of AH Sco and W Hyd.
2.2 Near-infrared observations
The NIR observations were carried out in June 1999 using the University of New South Wales Infrared Fabry-Perot narrow-band filter (UNSWIRF; Ryder et al., 1998), in conjunction with the Infrared Imager and Spectrometer (IRIS; Allen et al., 1993) on the 3.9 m Anglo-Australian Telescope (AAT). A pixel size of 0.77 arcsec resulted in a circular image of 100 arcsec in diameter. Observations were obtained in the 2.12 H2 1–0 S(1) transition, centered at , , and the 2.25 H2 2–1 S(1) transition, with a similar position. Each observation consisted of a set of five Fabry-Perot frames, equally spaced by 40 km s-1, centred on the average maser velocity. The velocity resolution was 75 km s-1. The integration time was 180 seconds per frame for all observations. The data were reduced using modified routines in the IRAF software package (Ryder et al., 1998). An off-line frame, with velocity offset by km s-1 from the first on-source frame, was taken for subsequent continuum subtraction. The intensity was calibrated using additional observations of the standard star BS 6441. Final data cubes were fitted with the instrumental Lorentzian profile to determine the line flux for the H2 emission across the field. The resultant uncertainty in the line flux is less than . It should be noted that the images are not true velocity channel maps, because each pixel in a frame has a slightly different line centre velocity. Both the central wavelength and the spectral resolution vary between pixels (in a reproducible manner) by up to km s-1. Calibration was achieved using an arc line, to give line centre maps.
To establish the spatial coordinates for the H2 images, we carried out observations with the Cryogenic Array Spectrometer Imager (CASPIR; McGregor et al., 1994) camera installed on the 2.3 m telescope at the Siding Spring Observatory in June 1999. The observations were undertaken using standard filters: (1.15–1.4 ), (1.55–1.8 ) and (2.0–2.4 ). The selected pixel size of 0.5 arcsec yielded individual frames with a size of arcmin. A total of nine frames, with 20 arcsec spatial overlap, was obtained with each filter. The exposure time was 180 seconds for an individual frame. For each filter, bias and dark frames were taken, as well as frames of the dome lamp light for flat-fielding. The data were reduced using modified routines in IRAF. No extended emission was detected and median sky frames were made by combining six neighboring source frames. To make the final image, the nine observed frames per filter were combined in a mosaic covering a region of arcmin2. For the astrometry, stars in the -band mosaic were matched with Digital Sky Survey (DSS) stars. Stars which were also detectable in the -band mosaic were then used as reference stars for astrometry of the UNSWIRF frames. The absolute positions have a maximum uncertainty better than 1 arcsec.
2.3 Molecular-line observations at cm wavelengths
We used the Australia Telescope Compact Array (ATCA), which consists of six 22 m antennas, to observe ground- and excited-state transitions of OH at 1.6, 4.7 and 6.0 GHz, the 4.8 GHz transition of H2CO and the 6.6 GHz transition of CH3OH. The observational parameters are listed in Table 3 and the observed molecular transitions in Table 4. For some observations the correlator configuration also allowed a wideband setting (128 MHz band over 32 channels) for observations of continuum emission, in addition to the narrow spectral-line mode (see Table 3). The calibration source PKS 1934–638 was observed at each frequency to provide primary flux density and bandpass calibration. An observing cycle was used in which target source integrations were bracketed by short observations of the phase calibrator PKS 1718–649 used for calculation of the complex antenna gains. For the OH ground-state transitions the observing band was centred at 1666 MHz to include emission from both ‘main’ lines at 1665 and 1667 MHz. The OH excited-state observations consisted of two or three contiguous 10-minute integrations on-source with the observing band set at the different transition frequencies for each integration. Line-free channels were used for subtraction of the continuum emission from all channels to form spectral-line data cubes and, in some cases, to provide continuum images. The rms noise values for the final spectral-line cubes are listed in Table 3.
A continuum image at 18 cm was produced from two datasets at 1666 MHz formed by averaging about 350 of the 1024 channels, which were line-free. The continuum image at 6 cm was constructed by combining data at 6035 MHz and 4829 MHz. For the 6035 MHz observations the 128 MHz wideband configuration was used. However, for the 4829 MHz data, no H2CO was detected and hence, the central 1800 channels of the 4 MHz spectral band were able to be used. Because of different pointing centres and central frequencies for the two datasets, the images were produced using mosaicing and multi-frequency synthesis techniques from the MIRIAD software package (Sault & Killeen, 1997).
3 Results and analysis
3.1 SNR morphology
In Figure 1 we show the continuum images of G349.7+0.2 at 18 and 6 cm. The 18 cm image has a FWHM synthesized beam of 90 58 (P.A. = 10), an rms noise of 1.5 mJy beam-1and is similar to existing radio images of the region (Frail et al., 1996; Brogan et al., 2000). The 6 cm image has a synthesised beam of 25 18 (P.A. = 57) and an rms noise of 0.2 mJy beam-1. Only the bright eastern part of the SNR was detected at 6 cm. The emission to the west is too weak to be detected at the higher frequency with the available sensitivity and resolution. A consequence of the shortest baselines of the ATCA configurations used for this work is that the 6 cm observations are only sensitive to structures arcmin in extent, while at 18 cm structures larger in scale than 5–8 arcmin will be resolved out. The integrated flux densities are 15.5 and 6.6 Jy at 18 and 6 cm, respectively. These values are lower limits because the observations are of an extended source, subject to some flux underestimation because of the limitation of an interferometer in detecting large spatial scales. Nevertheless, we can estimate a mean spectral index of between these two wavelengths, which is in agreement with the previously derived value of (Shaver et al., 1985).
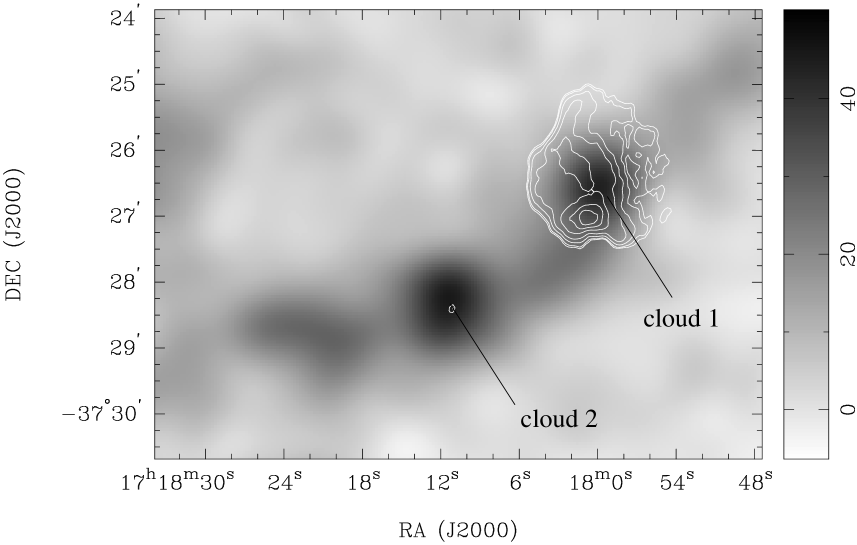
The influence of the interstellar medium on the radio morphology of G349.7+0.2 has been studied by Reynoso & Mangum (2001). They mapped the 12CO 1–0 distribution around the SNR over an area of arcmin2 with a resolution of 54 arcsec. Figure 2 shows their 12CO map, integrated between +10 and +20 km s-1 , to demonstrate that the molecular cloud associated with the SNR (‘cloud 1’) is part of a complex encompassing another cloud south-east of the SNR (‘cloud 2’), which is coincident with the low-brightness radio continuum source designated as ultra-compact (UC) H ii region IRAS 17147–3725 (Wood & Churchwell, 1989; Bronfman, Nyman, & May, 1996). Reynoso & Mangum (2001) suggested that the SNR morphology is influenced by the density gradient in the surrounding molecular gas, with the bright ridge encountering denser gas, and the fainter section of the SNR shell expanding into a lower density gas. The X-ray morphology shown in images from the Chandra X-ray Observatory supports this inference (Lazendic et al., 2005).
3.2 Millimetre-line emission
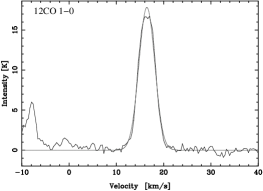
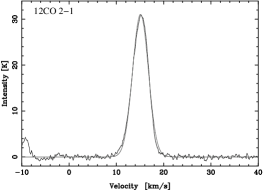
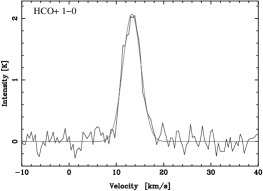
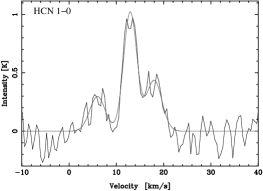
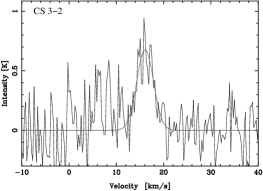
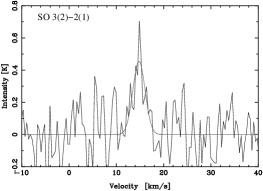
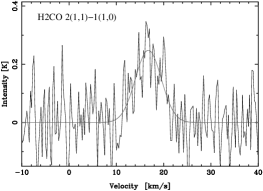
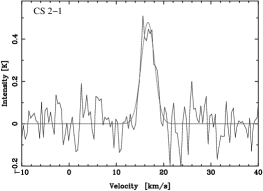
Several molecular clouds were detected along the line of sight to G349.7+0.2. Figure 3 shows a sample 12CO 1–0 spectrum towards the SNR in the velocity range to +80 km s-1. There are features seen at , +6 and +16 km s-1. To identify the molecular cloud associated with the SNR, we have assumed that the cloud has a velocity close to the maser velocity, i.e., km s-1. Figure 4 shows the molecular-line spectra for a variety of transitions and species in the velocity range to km s-1, all measured towards the peak position of the molecular cloud described above, except for the CS 3–2 and H2CO transitions, which were measured towards the maser position M1. Since the 13CO spectra taken with the Mopra telescope have different grid positions and intervals to those from the SEST data, the 13CO 1–0 spectrum shown in Figure 4 is from the pointing at , , which is the closest grid point to the SEST peak position. Most of the spectra appear to have symmetric, Gaussian-like profiles. The line profile of HCN 1–0 shows all three hyperfine components and was fitted with three Gaussian profiles. However, some spectra do show asymmetric profiles and flattening, indicative of self-absorption in the molecular cloud. The HCO+ spectra, shown in Figure 5, demonstrate this well. The self-absorption is most likely caused by cold gas in front of the warmer gas associated with G349.7+0.2, as seen in other SNRs (eg van Dishoeck et al., 1993). The basic line parameters derived from the fit to the spectral profiles are summarised in Table 5. The spectra have centre velocities between 12.9 and 16.7 km s-1, which is in good agreement with the OH maser velocities in Table 1. The line widths range from 2.7 to 6.5 km s-1, with an average value of km s-1.
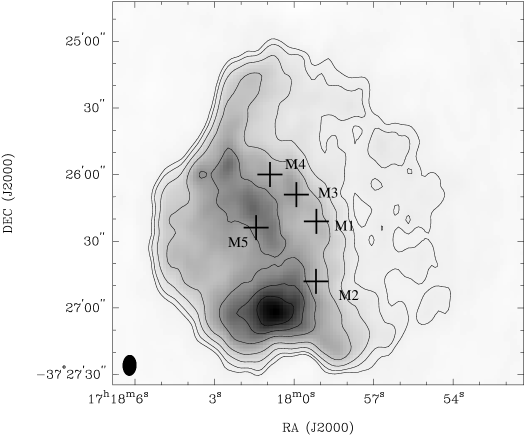
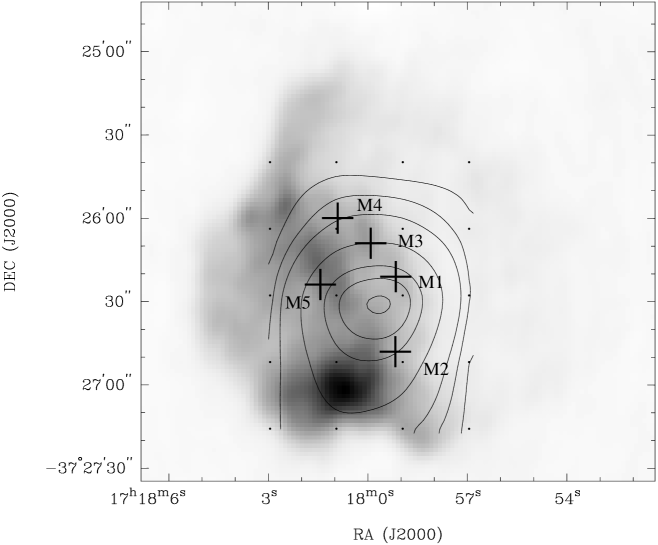
Figure 6 shows contours of velocity-integrated (10–20 km s-1) 12CO 1–0 emission obtained with the SEST overlaid on the 18 cm continuum image of the SNR. The molecular gas peaks at position 596, , which is close to the position of maser M1. Molecular maps of 12CO 2–1 emission, as well as 13CO, HCO+ and HCN emission (not shown), are remarkably similar to the 12CO 1–0 image in Figure 6. Our results are consistent with the 12CO maps of Dubner et al. (2004), also obtained with SEST. For the CS, H2CO and SO observations, emission was strongest towards maser M1. No emission was detected from the molecule SiO.
3.3 Properties of the molecular gas
To estimate the physical properties of the molecular gas we used a statistical-equilibrium excitation code RADEX111Now also available on-line at http://www.strw.leidenuniv.nl/moldata/radex.html supplied by J. H. Black (private communication) to model the molecular line emission. The code uses a mean escape probability (MEP) approximation for radiative transfer (for more details see Jansen, van Dishoeck & Black, 1994; van der Tak et al., 2007). For a given kinetic temperature and density of the gas, together with a total molecular column density and species line width, the code calculates the molecular line intensities, which can be compared with observed values.
12CO lines are commonly used to derive the kinetic temperature of the gas because they are easily thermalised (=), even at low densities. The estimated 12CO 1–0/2–1 line ratio differs from unity, which implies that self-absorption might be present and/or that there are molecular clumps with different filling factors for the two sets of observations (the beam sizes range from 20 arcsec to 55 arcsec). Indeed, we have already established that our observations show some degree of self-absorption. In addition, H2 emission is typically detected in highly clumped gas and our higher frequency data will also be subject to beam dilution effects. To be able to compare our line intensities for the same molecular species, a correction must be made for the assumed or derived source size. We adopt a source size of arcsec2 for the 12CO cloud, which is the the size estimated from both the H2 and OH emission (see below). This coincidence implies that the value could be the true size of the cloud interacting with the SNR. The actual source brightness temperature, corrected for the source size, can be found from , where and are the beam and source FWHM, respectively, and is the observed main-beam brightness temperature (e.g., Rohlfs & Wilson, 1996). We derive 12CO K and 12CO K, and a 12CO 2–1/1–0 line intensity ratio of . Importing these values into the RADEX code and adopting an uncertainty of in , we derive a kinetic temperature of for a gas density of cm-3, or for a gas density of – cm-3. These values may be lower limits because of the presence of self-absorption. The measured line ratio of 12CO to 13CO 1–0 main-beam brightness temperature was , which implies that the 12CO emission is optically thick. In this case, the derived kinetic temperature refers to the region from which the optically thick 12CO emission arises, which might not apply to the entire molecular cloud. Using an overall to ratio of (e.g., Langer & Penzias, 1990), we estimate an upper limit for the 12CO 1–0 optical depth of and for 13CO 1–0 an optical depth of .
To derive the density of the molecular cloud it is common to use molecular species with a dipole moment larger than that of 12CO, such as CS. The distribution of the CS 2–1 emission (not shown here) implies that CS emission is concentrated in a much smaller region than for the 12CO emission, so a source size of arcsec is used to correct the CS brightness temperatures for beam dilution effects. Modelling the two CS transitions with kinetic temperatures of K implies a gas density of cm-3. We note that our analysis is sensitive to the line ratio of the transitions used, which in turn depends on the adopted source size.
The excitation analysis implies a 12CO column density of cm-2. Applying the isotope abundance ratio of , given above, we obtain a 13CO column density of cm-2. The CS column density derived from the excitation analysis is cm-2. The non-detection of the CS 5–4 line is also consistent with these physical parameters for the gas. We assume that other molecular transitions have a small opacity. In fact, the ratios of the hyperfine lines in HCN, (F=0–1)/(F=2–1)1.3 and (F=1–1)/(F=2–1)2.9, deviate significantly from the LTE values of 0.2 and 0.6 (eg, Chin et al., 1997), respectively, suggesting that HCN is optically thin. For an estimation of the total column density for the molecular cloud associated with the SNR we use the standard fractional abundance of 12CO relative to H2 of (e.g., Irvine, Goldsmith, & Hjalmarson, 1987; van Dishoeck et al., 1993), which implies (H cm-2. For the other molecules species observed we used the relation for optically thin transitions (e.g., Rohlfs & Wilson, 1996):
| (1) |
where () is the number of states with the same energy (), is the Einstein -coefficient of spontaneous emission, and is transition frequency in units of GHz. From this relation we derive the column densities for HCO+ and HCN, using the same source size as for 12CO, and for SO using the source size for CS. The values are listed in Table 8.
3.4 H2 emission
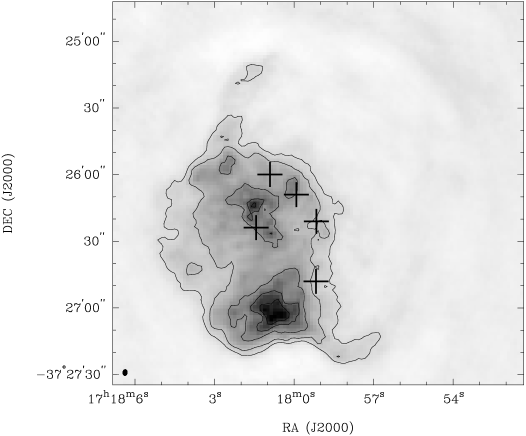
Figure 7 shows the velocity-integrated 1–0 and 2–1 S(1) H2 line emission detected towards G349.7+0.2. The 1 noise in the 1–0 line is 6 erg s-1 cm-2 sr-1 and in the 2–1 line is 4 erg s-1 cm-2 sr-1. The south-eastern part of the 2.12 H2 1–0 S(1) emission is truncated by the instrumental field of view, but the total extent of the emission can be determined from the 2.25 H2 2–1 S(1) image. The H2 emission extends about 1.5 arcmin with a maximum width of 40 arcsec. It has a clumpy structure containing several peaks (knots), which are about 15 arcsec in size. In general, the maser positions are located near these H2 knots. The line fluxes of the knots are corrected for a minimum extinction of mag because the source is located beyond the Galactic Centre. The values are summarised in Table 6 and the numbering of the knots is the same as for the masers. After correction for extinction, the intensity ratio of the 1–0 and 2–1 S(1) H2 transitions is calculated to be about 5–6. However, we note that because of the uncertainties in the absolute calibration at the two line frequencies, the derived line ratios may have a (constant) scaling error of up to 50%. There is a range of line centre velocities across the source, as indicated in Figure 7. Most of the H2 emission has a line centre velocity around km s-1. However, the emission from H2 knots 1 and 3 have a peak line center velocity of km s-1, while the emission from knot 2 has a peak velocity of km s-1. As mentioned previously, the velocity resolution is low ( km s-1) and we cannot determine the peak velocities very accurately ( km s-1uncertainty). Nevertheless, we can report that H2 emission was detected in the velocity range of 40 to +40 km s-1, which encompasses both the velocites of the OH(1720 MHz) masers and the parent molecular cloud, at roughly 16 km s-1. The velocity-integrated H2 emission contours are superimposed on the 18 cm radio continuum greyscale image in Figure 8. We note that there is also a clump of H2 emission coincident with the radio continuum peak, which is clear in the 2–1 S(1) line image, but has been truncated by the edge of the field of view in the 1–0 S(1) line image.
3.5 Search for ground- and excited-state OH maser emission
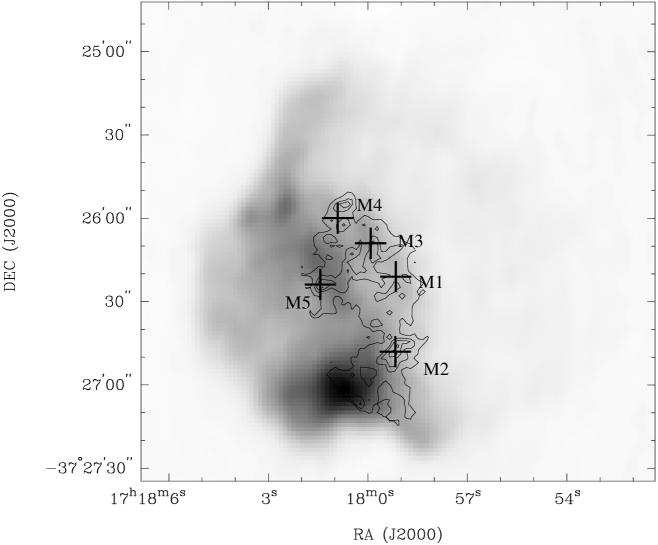
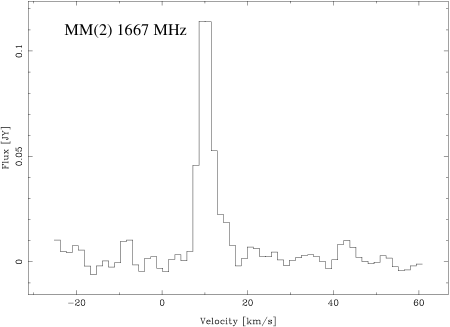
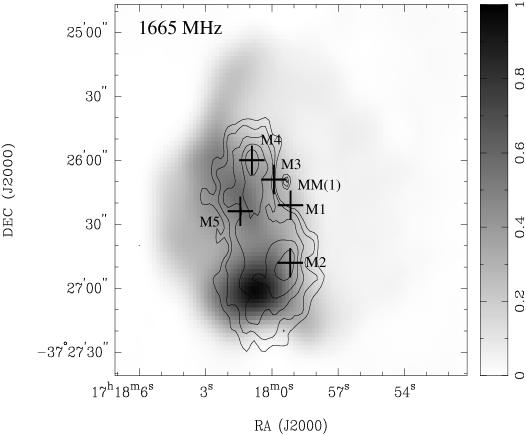
We have detected weak emission from the OH main-line masers at 1665 and 1667 MHz towards two locations in the observed field. The positions and flux densities of the sources are summarised in Table 7 and the maser profiles are shown in Figure 9. One of the main-line masers, denoted MM(1), is located in the direction of the SNR. Its position is closest (offset by 5 arcsec in RA and 1 arcsec in Dec) to that of maser M3 and emission was detected only in the 1665 MHz transition. The second maser, MM(2), was detected in both main-line transitions and is centred on the UC H ii region IRAS 17147–3725. Therefore, MM(2) is clearly related to star-formation. The peak velocity of the 1665 MHz transition of 16 km s-1 is somewhat different from the peak velocity of the 1667 MHz transition of 10 km s-1, but both velocities fall within the range for the molecular gas found towards the H ii region (10–20 km s-1). This discrepancy in the peak velocities of the masers may occur in star-forming regions (e.g., Masheder et al., 1994; Caswell, 1999), indicating a slight difference in their formation sites in the molecular cloud and consequent variations in the conditions producing the masers.
To date, main-maser lines have not been found detected coincident with OH(1720 MHz) masers in SNRs. There is an unresolved IRAS source IRAS 17146–3723 located arcsec away from MM(1), but the angular resolution for the IRAS observations ranges from 0.5–2 arcmin between 12 and 100µm. Both Reynoso & Mangum (2001) and Dubner et al. (2000) considered whether this source is dust heated by the SNR shock or a protostellar object. To investigate the nature of MM(1) towards G349.7+0.2, we examined the available IR data from the Two Micron All Sky Survey (2MASS) Point Source Catalog (Skrutskie et al., 2006) and the Spitzer Space Telescope GLIMPSE Catalog (Ramírez et al., 2008). There is a GLIMPSE source SSTGLMC G349.7294+00.1747 detected at 5.8µm (8 mag) and 8.0µm (6.5 mag), located 0.8 arcsec from MM(1), but with no 2MASS counterpart. For comparison, there is a GLIMPSE source SSTGLMA G349.7213+00.1208 located 0.7 arcsec from MM(2) with 6.5 mag at 5.8µm and 4.8 mag at 8.0µm , which does have a 2MASS counterpart. Thus, it would appear that MM(1) may also be related to star formation. However, detection of a possible Hii region associated with MM(1) and the GLIMPSE source would be very difficult because the radio continuum emission from the SNR is very bright. As evidence, the nearby UC Hii region IRAS 17147–3725 has a brightness comparable with the weakest emission measured from the SNR.
Our search for the excited-state maser lines was unsuccessful and the limits given by the 1 rms values are listed in Table 3. The relationship between ground- and excited-state transitions of OH masers has been studied in detail in star-forming regions observationally and theoretically (see e.g., Gray, Field, & Doel, 1992; MacLeod, 1997; Pavlakis & Kylafis, 1996, 2000, and references therein), and recently in molecular gas associated with SNRs (Wardle, 2007; Pihlström et al., 2008; McDonnell et al., 2008). Gray et al. (1992) proposed a correlation between masing at 1720 and 4765 MHz in warm gas ( K), and between 1720 and 6035 MHz in cooler molecular gas, which was confirmed using single dish observations of star-forming regions (MacLeod, 1997). Models by Pavlakis & Kylafis (1996, 2000) imply that OH transitions around 4.7 GHz are only excited in gas with higher density ( cm-3) than is required to produce the 1720 MHz maser. Furthermore, the transitions at 6031 and 6035 MHz require a strong far-infrared (FIR) radiation field. A satellite-line maser at 6049 MHz is more likely to be found, as it requires physical conditions not dissimilar to those needed for production of the 1720 MHz line, but it is expected to be very weak at densities cm-3 (Pavlakis & Kylafis, 2000), and would probably lie below our detection limits. Our results are therefore consistent with the OH excitation models.
3.6 Search for CH3OH maser emission
Methanol (CH3OH) masers are related to star-formation and are often found to co-exist with OH masers (e.g., Plambeck & Menten, 1990; Phillips et al., 1998). We searched for CH3OH maser emission at 6.6 GHz towards the location of the two OH main-line masers in the field of G349.7+0.2. Of particular interest was whether the MM(1) maser had a CH3OH maser counterpart, in order to clarify its origin. However, no maser emission was detected; the 1 rms limits are listed in Table 3. The conclusion is that either CH3OH is not sufficiently abundant or that the local conditions (gas temperature, density, dust temperature) are such that only OH masers are favoured (Cragg, Sobolev, & Godfrey, 2002).
3.7 OH absorption
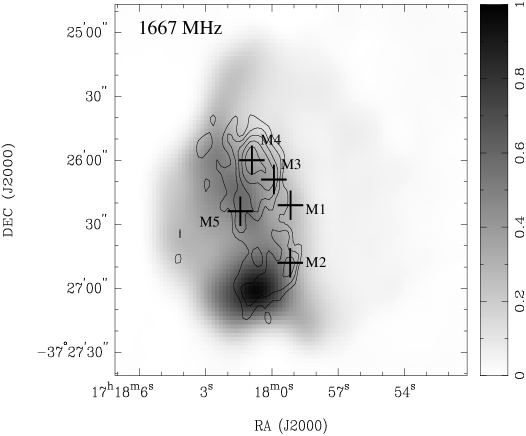
The 1665 and 1667 MHz OH absorption profiles toward G349.7+0.2 are shown in Figure 10 in the velocity range to km s-1, Hanning smoothed over 3 channels. Prominent features are present around , and +16 km s-1. The 1665 MHz profile differs from the 1667 MHz spectrum in having an additional feature at km s-1. This feature originates from a bright maser located north-west of the SNR, outside the observed field of view. These OH absorption features are also seen in H i absorption (Caswell et al., 1975), and some of them (for which we have velocity coverage) are seen in our SEST 12CO spectra, i.e., features at , and +16 km s-1. The +16 km s-1 feature, which we associate with the SNR because of the common velocity with the OH(1720 MHz) masers, is partially blended with the +6 km s-1 feature. To investigate the distribution of the 16 km s-1 OH cloud we produced velocity-integrated (10–20 km s-1) images of OH absorption with a resolution of 15″12″ (P.A. = 32), degraded from the best available resolution to improve the image sensitivity. The OH images are shown in Figure 11, overlaid on the 18 cm radio continuum image. The distribution of the OH cloud does not mirror the continuum emission, which would occur for a uniform overlaying absorption cloud, but appears as an elongated feature, 40′ wide and 15 long, covering the region of the OH(1720 MHz) maser emission. We note that for the section of the SNR containing the masers the continuum emission is reasonably constant, which suggests that the variation in OH absorption is indicative of variations in OH column density. The two troughs in the OH absorption distribution coincide with the M2 and M4 maser locations. The 1665 MHz distribution is more extended than that of 1667 MHz, and there is an indentation in the OH absorption distribution near the compact MM(1) maser, shown in Figure 11.
The optical depth was calculated from the spectral line channel maps, where and are the intensities of the spectral line and continuum maps, respectively. The calculation were limited to regions with a continuum intensity greater than 25 mJy beam-1 because of the poor signal-to-noise figure at weaker continuum levels. In Figure 12 we compare the optical depth profiles and the line-to-continuum ratios towards the peak of the OH cloud. The optical depths are quite high, around 1.2–1.3. The relative intensity of the OH absorption in the 1667 MHz and 1665 MHz lines is expected to have a ratio around 9/5 for an optically thin gas in local thermal equilibrium (LTE). The line ratio in G349.7+0.2 is , which is significantly different from the LTE ratio (), probably reflecting the high calculated optical depths. OH absorption is typically observed with low optical depths in the Galaxy, but higher values have been found towards some SNRs (e.g. Yusef-Zadeh, Wardle, & Roberts, 2003).
The OH column density for the LTE case can be obtained from (e.g., Crutcher, 1977):
| (2) |
| (3) |
Modelling of the OH population levels implies that for K an OH excitation temperature of 10 K is plausible (Yusef-Zadeh, Wardle, & Roberts, 2003). Using the above values of the optical depth, we derive a peak OH column density of (2.8–4.7) cm-2. These values are consistent with the models for OH(1720 MHz) excitation (Elitzur, 1976; Lockett et al., 1999) and with the model for OH production in C-type shocks (Wardle, 1999). Modelling the OH excitation using all four ground-state OH transitions, Hewitt et al. (2008) found that the line profiles from their observations of 15 SNRs with the Green Bank Telescope are consistent with molecular gas with temperatures of 30-100 K, OH column densities of – cm-2 and gas densities of cm-3. Hewitt et al. (2008) detected enhanced 1720 MHz emission in G349.7+0.2, but were not able to resolve any corresponding main-line absorption lines, principally because of insufficient sensitivity and the large 72 telescope beam at 1.7 GHz.
3.8 H2CO absorption
H2CO absorption at 4829 MHz is readily found in H ii-molecular cloud complexes, where H ii regions are embedded in dense molecular clouds. There have been only a few such absorption detections towards SNRs (e.g., Whiteoak & Gardner, 1974; Slysh et al., 1980; DeNoyer, 1983; Reynoso & Goss, 2002), where the associated continuum emission and resultant absorption is usually much fainter than for surveyed H ii regions. We did not detect H2CO absorption towards G349.7+0.2, but there was weak absorption towards the nearby UC H ii region, with an optical depth of and a column density of cm-2 (for an adopted excitation temperature of 10 K and a line width of 5 km s-1). For a 3 upper limit and a line-width of 5 km s-1, we estimate an optical depth and an H2CO column density cm-2 in the direction of the SNR.
4 Discussion
4.1 Kinematics and chemistry of molecular gas
The parameters derived from the millimetre-line observations of various molecular species for the molecular cloud associated with G349.7+0.2of cm-3 and K, are consistent with values required for the production of OH(1720 MHz) masers by shock excitation (Lockett et al., 1999). However, the measured millimetre-line widths of 4 km s-1 , for all the molecular transitions we observed, are smaller than those expected from shocked gas ( km s-1). Although the shock front containing the OH(1720 MHz) masers will be seen mostly perpendicular to the line-of-sight (hence showing minimal line broadening), some broadening is expected due to deflection of the shock in clumpy pre-shock gas (Turner & Lubowich, 1991). High velocity wings were not detected in the lines from the low 12CO transitions, but they may be too weak to be seen with the short integration times used here. Dubner et al. (2004) reported asymmetry in the 12CO line profiles towards the cloud borders, indicating the line broadening and kinematic signatures of shocked gas. We find that the peak velocities vary across the source for all the species observed, but there was no particular trend. It is probable that the shifts are caused by self-absorption in the spectral lines due to the presence of cold, pre-shocked gas, as found in other SNRs (eg van Dishoeck et al., 1993; Reach et al., 2005). Evidence for this hypothesis is the flattened line profiles seen in the 12CO, 13CO and HCO+ spectra (Figure 5). The presence of self-absorption in the lines, in conjunction with the fact that the various molecular species sample gas of different densities, could also explain the variations in peak velocity between the different molecular species, listed in Table 5.
In Table 8 we list the various molecular column densities and abundances determined using the H2 column density of 4 cm-2, derived in section §3.3. This value differ by an order of magnitude from that derived by Dubner et al. (2000), but no correction was made of their observed intensities for beam dilution, even though the 12CO 3-2 map showed a different distribution of molecular gas compared with their 1-0 and 2-1 12CO maps. The higher transition image is quite similar to our H2 map. Because the angular resolution of our observations is relatively poor compared with the size scale of the SNR, we were not able to observe the contributions from ambient and post-shock gas separately. Hence, we are not able to compare post- and pre-shock abundances in the cloud associated with G349.7+0.2. Nevertheless, an attempt has been made to compare our observed values with those of the IC 443 from van Dishoeck et al. (1993), where shock chemistry has been studied in great detail. We also compared them with abundances in the dark clouds L134N and TMC-1 (Ohishi, Irvine, & Kaifu, 1992), which were also compared with IC 443 (van Dishoeck et al., 1993). Abundances in dark clouds provide information about basic molecular formation in gas-phase chemistry without contamination by ultraviolet (UV) photons from embedded sources. We find that the abundances of CS and HCN are comparable for SNRs and dark clouds. In other words, they remain unchanged for shocked gas, as expected from the models.
SiO is the only molecule in IC 443 found to have an abundance enhanced with respect to dark clouds (van Dishoeck et al., 1993). Observations and theoretical modelling indicate that in dark clouds Si is heavily depleted because it freezes out onto dust grains. Si-species such as SiO become observable in warm regions with temperatures higher than 30 K (Ziurys, Friberg, & Irvine, 1989; Mackay, 1996). Shock models predict enhanced SiO abundances as a bi-product of gas-phase chemistry when Si is released from the grains by evaporation or disruption by fast dissociative shocks (Neufeld & Dalgarno, 1989; Mackay, 1996; Schilke et al., 1997). This hypothesis is supported by observations of young bipolar outflows, where jets from a central star interact with ambient molecular gas (e.g., Garay et al., 1998). We did not detect SiO towards G349.7+0.2and estimate an upper limit to its column density of (SiO)7.5. This limit is much lower than the value for IC 443, but is still significantly higher than the limits found for dark clouds. More sensitive observations are needed to further examine the SiO abundance in G349.7+0.2.
Another molecule predicted to be enhanced in shocks is SO. This enhancement depends on the H/H2 ratio, the C/CO ratio, and on the initial form (atomic or molecular) of sulphur (see van Dishoeck et al., 1993, and references therein). Pineau Des Forets et al. (1993) suggested that SO can be found at distances up to cm from the shock front. The telescope resolution at the SO frequency observed is such that beam dilution is expected to render any SO enhancement undetectable, unless the species was distributed over a substantial distance. The derived SO abundance of is an order of magnitude greater than in TMC-1, but is consistent with the value found in L134N. More spatially sensitive observations are needed to determine whether SO is enhanced in G349.7+0.2.
Early observations reported an enhancement of HCO+ towards IC 443 (Dickinson et al., 1980; DeNoyer & Frerking, 1981), which was contrary to predictions for slow shocks (Iglesias & Silk, 1978), but could be explained by the increased ionisation expected in SNRs (Elitzur, 1983). However, subsequent observations found that the HCO+ abundance in IC 443 was not enhanced by the SNR shock (Ziurys et al., 1989) and even decreased in the high density gas, probably due to more rapid dissociative recombination with electrons and reactions with H2O (van Dishoeck et al., 1993). Our beam-averaged result of 7.5 implies that the HCO+ abundance is either enhanced in G349.7+0.2, or that that the source size used for the beam correction of the HCO+ data was incorrect. As for SO, more spatially-sensitive observations are needed to determine if there is an enhanced abundance of HCO+ in G349.7+0.2.
4.2 Shocked H2
The measured H2 1–0/2–1 line ratio of 5–6 is somewhat lower than the ratio of 10–20 expected for C-shocks (Burton et al., 1988). A lower line ratio can be produced in J-shocks, where the vibrational ground-states of H2 are generated by a cascade following collisional excitation of excited electronic states. However, this type of shock cannot account for the high 1–0 S(1) line intensities observed in G349.7+0.2 (Hollenbach & McKee, 1989). A very low line ratio () can be measured for fluorescent H2 emission produced by radiative excitation of low density gas by UV photons (Black & Dalgarno, 1976). UV excitation can also produce higher line ratios in molecular gas of density – cm-3 (Burton, Hollenbach, & Tielens, 1990). However, to generate 1–0 S(1) emission with a peak of 0.005 erg s-1 cm-2 sr-1, as found in G349.7+0.2, the far-UV (FUV) radiation field needs to be G0, where G0 represents the FUV radiation field equivalent to 1.6 erg s-1 cm-2 sr-1 (Burton et al., 1990). This is an unusually high value to be produced by only a few young stars. For example, early-type B stars typically produce a field of G0 (note that strictly this is a function of the distance from the star). Burton et al. (1990) showed that less than of the energy of 6–13.6 eV photons is re-emitted in the 1–0 S(1) line. The total NIR H2 1–0 S(1) line luminosity of G349.7+0.2 is about 500 (Table 6), so an exciting source would need to emit 5 in 6–13.6 eV photons, with an even higher bolometric luminosity. Therefore, the H2 emission we detect is too bright and widespread to be produced by UV excitation from a star and, despite the lower than expected line ratio, must be produced by the SNR shock. One possible explanation is a combination of gas components with different physical properties contributing to the detected H2 emission. From observations of excited H2 S(0)–S(7) lines with the Spitzer Space Telescope IRS spectrograph in 5–15 µm and 12–42.2 µm bands, Hewitt et al. (2009) found that two components are required to produce the observed H2 line intensity: a slow ( km s-1) C-type shock propagating into dense gas ( cm-3, 500 K, (H2)2.8 cm-2) and a faster ( km s-1) C-type shock propagating into lower density gas ( cm-3, 1600 K, (H2)5.2 cm-2). They also detected ionic lines (mainly [Fe ii]), which could be explained with models of a J-shock travelling in hot, low density gas ( cm-3, K). Multiple gas components are often found in molecular clouds interacting with SNRs (eg van Dishoeck et al., 1993; Reach et al., 2005; Hewitt et al., 2006). J-shocks will dissociate H2 and then ionize the atomic hydrogen, eventually producing the H2 1–0 emission, while C-shocks will provide the H2 2–1 emission. Hence, a mix of shocks along the line of sight might produce both an elevated 1–0 emission for C-shocks and too high a 2–1 emission for the J-shock, resulting in the line ratio we observed.
In shocked gas the 1–0 S(1) line contributes typically 5–10 of the total H2 luminosity (e.g., see Burton, 1992). The H2 luminosity of the source would therefore be high, , at the SNR distance of 18 kpc. This is approximately five times higher than the emitted in H2 lines by IC 443 (Burton et al., 1988). It is also brighter than the extended fluorescent H2 line emission associated with several massive star-forming complexes (e.g., 300 from the PDR emission around the Orion Molecular Cloud-One; Burton & Puxley, 1990).
There is morphological evidence that the H2 emission is related to the SNR shock in G349.7+0.2. Figure 8 shows that the H2 filaments coincide with the western edge of the bright continuum shell. The H2 knots are associated with the locations of OH(1720 MHz) masers, which are produced by collisional excitation. This morphological coincidence between the H2 and radio continuum emission, and between the H2 and maser emission suggests that these phenomena are shock-related. Furthermore, our H2 emission is strikingly similar to emission detected by the Spitzer Space Telescope IRAC camera in the 5.8 band (Reach et al., 2006), which has a shocked origin, as confirmed by the IRS observations of Hewitt et al. (2009).
Dubner et al. (2004) have also mapped G349.7+0.2 in the 12CO 1–0, 2–1 and 3–2 transitions, with a somewhat different survey area. While their integrated 12CO 1–0 and 2–1 maps are similar to our corresponding maps, their 3–2 map is distinct and matches the morphology of the H2 emission well. The authors noted this difference and that their line widths and derived gas density do not imply shocked molecular gas. However, the higher than unity line ratio between the three 12CO transitions (1–0, 2–1 and 3–2) at the peak of the cloud plus a possible asymmetry in the 12CO 2–1 and 3–2 line profiles (which we ascribe to self-absorption) are indicative of shocked gas. Dubner et al. (2004) suggest that the SNR is in front of the molecular cloud which it is impacting, with the eastern side being pushed away from us, and the western side of the SNR being pushed towards us.
The H2 emission we detect shows a wide range of velocities from km s-1to +40 km s-1. However, there are no molecular cloud components at or +40 km s-1 observed in our 12CO or OH data. This is consistent with similar observations obtained towards other SNRs associated with OH(1720 MHz) masers G359.1–0.5 and G357.7–0.1 (Lazendic et al., 2002, 2004). It is likely that our arcsecond-scale NIR observations have the sensitivity to detect individually accelerated molecular clumps, while the mm and cm molecular data are sensitive to the bulk motion of the molecular gas, with ambient velocities. The H2 observations reveal the shocked gas viewed from different angles, while the mm observations mostly probe the molecular gas along the line-of-sight and the optically thicker and colder outside layers of the molecular cloud. In the case of the SNR 3C 391, which is also associated with OH(1720 MHz) maser emission, Reach & Rho (1999) detected broad molecular lines ( km s-1) only from a small gas clump (labeled 3C 391:BML) less than 0.6 pc in size. Such a feature would be about 6 arcsec in size if located at the distance of G349.7+0.2. Comparing the distribution of NIR H2 emission and 12CO emission for 3C 391, Reach et al. (2002) further showed that broad-line 12CO emission does follow shocked H2 emission, but that the line strength of the broad-line component was 10 times weaker than for the 3C 391:BML clump, which coincides with the OH(1720 MHz) maser. In summary, there are several factors which could explain the non-detection of broad molecular lines in an SNR suspected of interaction with a molecular cloud: the lack of high spatial resolution in the observations, confusion with ambient gas (ie self-absorption) and with higher 12CO transitions (Reach & Rho, 1999). Jiang et al. (2010) compiled a list of SNRs having confirmed or suspected interactions with molecular clouds, and of 34 SNRs confirmed (using various methods), only 16 have broad and/or asymmetric molecular lines.
4.3 Shocked OH and maser emission
Figure 13 shows contours of velocity-integrated OH absorption at 1667 MHz overlaid on the contours of velocity-integrated H2 emission. Good correlation between the OH and H2 distributions is a strong indication that the OH gas is generated in the shocked regions. Other evidence to support the shock origin of the OH gas comes from the association of the OH peaks with the masers. The OH column density derived in section 3.7 yields an OH fractional abundance of (0.4–1.0), indicating that the OH abundance in G349.7+0.2 might be 3 times higher than in dark clouds (e.g., 3; Ohishi et al., 1992). An enhanced OH abundance towards an SNR (IC 443) was first reported by DeNoyer (1979), but shock models do not predict such an enhancement (Draine, Roberge, & Dalgarno, 1983; Hollenbach & McKee, 1989; Kaufman & Neufeld, 1996). For temperatures above 400 K, any OH formed will be rapidly converted into H2O through reactions with H2. However, X-rays from the interior of the remnant can penetrate the surrounding molecular cloud and eject photo-electrons, which then collisionally excite the Werner Ly band of H2, providing enough energy to dissociate the H2O molecules into OH, but not enough to dissociate the OH (Wardle, 1999). The process of forming abundant OH occurs when the temperature drops to a point where the conversion of OH back into H2O ceases. A warm, dense layer rich in OH develops at the rear of the shock, ideal for the collisional pumping of OH(1720 MHz) masers. The upper value of the derived OH abundance in G349.7+0.2 is consistent with predictions for the dissociation of of the water by the SNR X-ray flux (Wardle, 1999).
Our non-detection of excited-state OH masers is consistent with previous searches: Fish et al. (2007) searched for 6 GHz OH masers towards 10 SNRs with the Effelsberg 100-m telescope; Pihlström et al. (2008) searched for 4.7, 7.8, 8.2 and 23.8 GHz OH transitions in 4 SNRs with the Very Large Telescope; and McDonnell et al. (2008) searched for the 6 GHz OH transitions with the Parkes 64-m telescope in about 40 SNRs, including sources from the Magellanic clouds and G349.7+0.2. These results suggest that the shock conditions suitable for the production of 1720 MHz OH transitions do not support the other OH transitions, even those at 6049 MHz and 4765 MHz, which have the most compatible requirements. Interestingly, Wardle (2007) found that for OH column densities larger than cm-2, the 6049 MHz masers switch on while the 1720 MHz transition is quenched, even with suitable gas densities and temperatures for the production of 1720 MHz masers, suggesting that the higher frequency line might serve as a complementary signpost of warm, shocked gas. Unfortunately, a dedicated search for the 6049 MHz OH line by McDonnell et al. (2008) was unsuccessful. However, they found indications that this transition is more sensitive than the 1720 MHz line to velocity coherence. Similarly, searches for the 22 GHz H2O maser transition in about 20 SNRs reported no detections (Claussen et al., 1999; Woodall & Gray, 2007). Detailed modeling of this transition using the conditions required for 1720 MHz OH maser production with both C-type and J-type shocks indicate that by the time the appropriate gas density is reached ( cm-3), the gas temperature has cooled too much (to 15 K from required 300-600 K) to be able to generate the necessary H2O column density (Woodall & Gray, 2007).
5 Conclusion
Radio and infrared observations towards G349.7+0.2, an SNR with associated OH(1720 MHz) masers, were used to investigate the interaction of the SNR with the adjacent molecular cloud. The main results are summarised below.
-
(1).
Emission from several molecular species (12CO, 13CO, CS, HCO+, HCN, H2CO and SO) have been detected towards the SNR at the OH(1720 MHz) maser velocities. The molecular lines have moderate line widths ( km s-1), showing no kinematic evidence of shock, but the derived gas density of cm-3 and temperature of K are consistent with the predictions for OH(1720 MHz) maser production in molecular gas triggered by an SNR shock.
-
(2).
Molecular abundances of the shocked molecular gas in G349.7+0.2 are found to be somewhat different from those in another well-studied SNR, IC 443. The abundances of molecules such as CS, HCN and H2CO are not enhanced by the effect of the shock, as expected from the most plausible models. The abundances of HCO+ and SO appear to be an order of magnitude higher than in dark clouds. No SiO emission was detected, but the upper limit to the SiO column density does allow the possibility of an enhanced SiO abundance.
-
(3).
Strong H2 emission was detected towards the SNR. Its distribution coincides with the bright radio shell and the location of the OH masers, supporting the proposal that the H2 emission arises from the SNR shock expanding into the adjacent molecular cloud. The total H2 line luminosity in the source is very large, , which indicates that the interaction of SNRs with molecular clouds can produce H2 line emission greater than that associated with fluorescent emission around massive star-forming complexes. This should be born in mind when interpreting extragalactic H2 line emission.
-
(4).
In G349.7+0.2 we have clear observational evidence of an extended OH cloud associated with shocked regions in the SNR, as revealed by thermal absorption against the SNR continuum emission. The distribution of the OH gas correlates well with the OH(1720 MHz) maser locations and the distribution of shocked H2. An upper value for the OH fractional abundance () is greater than for cold clouds and is consistent with predictions for water dissociation by a soft X-ray flux from the SNR. We found no H2CO absorption towards the SNR.
-
(5).
We detected for the first time OH main-line maser emission at 1665 and 1667 MHz in directions towards and near G349.7+0.2. Only a 1665 MHz maser is located towards the SNR and was identified with an IR source SSTGLMC G349.7294+00.1747 from the GLIMPSE Catalog. The other maser was detected in both main-line transitions and coincides with the ultra-compact H ii region IRAS 17147–3725, located south-east of the SNR. We also found weak H2CO absorption towards this H ii region. No masing was detected towards the SNR from excited-state OH transitions around 4.8 and 6 GHz, nor from the 6 GHz CH3OH transition.
Acknowledgments
We thank John Black for kindly providing us with his RADEX code, Estela Reynoso for use of the 12-m NRAO CO map, and Andrew Walsh for help with the CASPIR observations. We would also like to thank our referee, John Phillips, who’s comments have greatly improved this manuscipt. JSL and JBW acknowledge travel support from the Australian Government’s Access to Major Research Facilities Program (AMRFP). This work was also supported in part by the Australian Research Council and Australian’s Government International Postgraduate Research Scholarship program.
The Australia Telescope Compact Array and Mopra Telescope are part of the Australia Telescope funded by the Commonwealth of Australia for operation as a National Facility, managed by CSIRO. The Swedish-ESO Submillimetre Telescope (SEST) is operated by the Swedish National Facility for Radio Astronomy, Onsala Space Observatory and by the European Southern Observatory (ESO). The NIR observations would not have been possible without the efforts of Michael Ashley and the UNSWIRF crew from UNSW, as well as the staff of the Anglo Australian Observatory. CASPIR is operated by the Australian National University at the 2.3 m telescope at Siding Spring Observatory. This publication makes use of data products from the Two Micron All Sky Survey, which is a joint project of the University of Massachusetts and the Infrared Processing and Analysis Center/California Institute of Technology, funded by the National Aeronautics and Space Administration and the National Science Foundation. This research has made use of the NASA/ IPAC Infrared Science Archive, which is operated by the Jet Propulsion Laboratory, California Institute of Technology, under contract with the National Aeronautics and Space Administration.
References
- Allen et al. (1993) Allen, D. A. et al. 1993, Proceedings of the Astronomical Society of Australia, 10, 298
- Black & Dalgarno (1976) Black, J. H. & Dalgarno, A. 1976, ApJ, 203, 132
- Brogan et al. (2000) Brogan, C. L., Frail, D. A., Goss, W. M., & Troland, T. H. 2000, ApJ, 537, 875
- Bronfman, Nyman, & May (1996) Bronfman, L., Nyman, L., & May, J. 1996, A&AS, 115, 81
- Burton et al. (1988) Burton, M. G., Geballe, T. R., Brand, P. W. J. L., & Webster, A. S. 1988, MNRAS, 231, 617
- Burton et al. (1990) Burton, M. G., Hollenbach, D. J., & Tielens, A. G. G. M. 1990b, ApJ, 365, 620
- Burton & Puxley (1990) Burton, M. & Puxley, P. J. 1990, its The Interstellar Medium in External Galaxies: Summaries of Contributed Papers p 238-240 (SEE N91-14100 05-90), 238
- Burton (1992) Burton, M. G. 1992, Australian Journal of Physics, 45, 463
- Caswell et al. (1975) Caswell, J. L., Murray, J. D., Roger, R. S., Cole, D. J., & Cooke, D. J. 1975, A&A, 45, 239
- Caswell (1999) Caswell, J. L. 1999, MNRAS, 308, 683
- Chin et al. (1997) Chin, Y.-N., Henkel, C., Whiteoak, J. B., Millar, T. J., Hunt, M. R., & Lemme, C. 1997, A&A, 317, 548
- Claussen et al. (1999) Claussen, M. J., Goss, W. M., Frail, D. A., & Seta, M. 1999, AJ, 117, 1387
- Cragg et al. (2002) Cragg, D. M., Sobolev, A. M., & Godfrey, P. D. 2002, MNRAS, 331, 521
- Crutcher (1977) Crutcher, R. M. 1977, ApJ, 216, 308
- DeNoyer (1979) DeNoyer, L. K. 1979, ApJL, 228, L41
- DeNoyer & Frerking (1981) DeNoyer, L. K. & Frerking, M. A. 1981, ApJL, 246, L37
- DeNoyer (1983) DeNoyer, L. K. 1983, ApJ, 264, 141
- Dickinson et al. (1980) Dickinson, D. F., Dinger, A. S. C., Kuiper, T. B. H., & Rodriguez Kuiper, E. N. 1980, ApJL, 237, L43
- Draine, Roberge, & Dalgarno (1983) Draine, B. T., Roberge, W. G., & Dalgarno, A. 1983, ApJ, 264, 485
- Dubner et al. (2000) Dubner, G. M., Velázquez, P. F., Goss, W. M., & Holdaway, M. A. 2000, AJ, 120, 1933
- Dubner et al. (2004) Dubner, G., Giacani, E., Reynoso, E., & Parón, S. 2004, A&A, 426, 201
- Elitzur (1976) Elitzur, M. 1976, ApJ, 203, 124
- Elitzur (1983) Elitzur,M. 1983, ApJ, 267, 174
- Fish et al. (2007) Fish, V. L., Sjouwerman, L. O., & Pihlström, Y. M. 2007, ApJL, 670, L117
- Frail, Goss & Slysh (1994) Frail, D. A., Goss, W. M. & Slysh, V. I. 1994, ApJL, 424, L111
- Frail et al. (1996) Frail, D. A., Goss, W. M., Reynoso, E. M., Giacani, E. B., Green, A. J. & Otrupcek, R. 1996, AJ, 111, 1651
- Frail & Mitchell (1998) Frail, D. A. & Mitchell, G. F. 1998, ApJ, 508, 690
- Garay et al. (1998) Garay, G., Köhnenkamp, I., Bourke, T. L., Rodríguez, L. F., & Lehtinen, K. K. 1998, ApJ, 509, 768
- Gray et al. (1992) Gray, M. D., Field, D., & Doel, R. C. 1992, A&A, 262, 555
- Green et al. (1997) Green, A. J., Frail, D. A., Goss, W. M. & Otrupcek, R. 1997, AJ, 114, 2058
- Hewitt et al. (2006) Hewitt, J. W., Yusef-Zadeh, F., Wardle, M., Roberts, D. A., & Kassim, N. E. 2006, ApJ, 652, 1288
- Hewitt et al. (2008) Hewitt, J. W., Yusef-Zadeh, F., & Wardle, M. 2008, ApJ, 683, 189
- Hewitt et al. (2009) Hewitt, J. W., Rho, J., Andersen, M., & Reach, W. T. 2009, ApJ, 694, 1266
- Hewitt & Yusef-Zadeh (2009) Hewitt, J. W., & Yusef-Zadeh, F. 2009, ApJL, 694, L16
- Hollenbach & McKee (1989) Hollenbach, D. & McKee, C. F. 1989, ApJ, 342, 306
- Hunt Cunningham et al. (2003) Hunt Cunningham, M., Whiteoak, J. B., Jones, P. A., & White, G. L. 2003, astro-ph/0312442
- Iglesias & Silk (1978) Iglesias, E. R. & Silk, J. 1978, ApJ, 226, 851
- Irvine, Goldsmith, & Hjalmarson (1987) Irvine, W. M., Goldsmith, P. F., & Hjalmarson, A. 1987, ASSL Vol. 134: Interstellar Processes, 561
- Jansen et al. (1994) Jansen, D. J., van Dishoeck, E. F. & Black, J. H. 1994, A&A, 282, 605
- Jiang et al. (2010) Jiang, B., Chen, Y., Wang, J., Su, Y., Zhou, X., Safi-Harb, S., & DeLaney, T. 2010, ApJ, 712, 1147
- Kaufman & Neufeld (1996) Kaufman, M. J. & Neufeld, D. A. 1996, ApJ, 456, 611
- Koralesky et al. (1998) Koralesky, B., Frail, D. A., Goss, W. M., Claussen, M. J., & Green, A. J. 1998, AJ, 116, 1323
- Langer & Penzias (1990) Langer, W. D. & Penzias, A. A. 1990, ApJ, 357, 477
- Lazendic et al. (2002) Lazendic, J. S., Wardle, M., Burton, M. G., Yusef-Zadeh, F., Whiteoak, J. B., Green, A. J., & Ashley, M. C. B. 2002, MNRAS, 331, 537
- Lazendic et al. (2004) Lazendic, J. S., Wardle, M., Burton, M. G., Yusef-Zadeh, F., Green, A. J., & Whiteoak, J. B. 2004, MNRAS, 354, 393
- Lazendic et al. (2005) Lazendic, J. S., Slane, P. O., Hughes, J. P., Chen, Y., & Dame, T. M. 2005, ApJ, 618, 733
- Lockett et al. (1999) Lockett, P., Gauthier, E. & Elitzur, M. 1999, ApJ, 511, 235
- Mackay (1996) Mackay, D. D. S. 1996, MNRAS, 278, 62
- MacLeod (1997) MacLeod, G. C. 1997, MNRAS, 285, 635
- Masheder et al. (1994) Masheder, M. R. W., Field, D., Gray, M. D., Migenes, V., Cohen, R. J., & Booth, R. S. 1994, A&A, 281, 871
- McDonnell et al. (2008) McDonnell, K. E., Wardle, M., & Vaughan, A. E. 2008, MNRAS, 390, 49
- McGregor et al. (1994) McGregor, P., Hart, J., Downing, M., Hoadley, D., & Bloxham, G. 1994, Experimental Astronomy, 3, 139
- Neufeld & Dalgarno (1989) Neufeld, D. A. & Dalgarno, A. 1989, ApJ, 340, 869
- Ohishi et al. (1992) Ohishi, M., Irvine, W. M., & Kaifu, N. 1992, IAU Symp. 150: Astrochemistry of Cosmic Phenomena, 150, 171
- Pavlakis & Kylafis (1996) Pavlakis, K. G. & Kylafis, N. D. 1996, ApJ, 467, 309
- Pavlakis & Kylafis (2000) Pavlakis, K. G. & Kylafis, N. D. 2000, ApJ, 534, 770
- Phillips et al. (1998) Phillips, C. J., Norris, R. P., Ellingsen, S. P., & McCulloch, P. M. 1998, MNRAS, 300, 1131
- Pihlström et al. (2008) Pihlström, Y. M., Fish, V. L., Sjouwerman, L. O., Zschaechner, L. K., Lockett, P. B., & Elitzur, M. 2008, ApJ, 676, 371
- Pineau Des Forets et al. (1993) Pineau Des Forets, G., Roueff, E., Schilke, P., & Flower, D. R. 1993, MNRAS, 262, 915
- Plambeck & Menten (1990) Plambeck, R. L. & Menten, K. M. 1990, ApJ, 364, 555
- Ramírez et al. (2008) Ramírez, S. V., Arendt, R. G., Sellgren, K., Stolovy, S. R., Cotera, A., Smith, H. A., & Yusef-Zadeh, F. 2008, ApJS, 175, 147
- Reynoso & Mangum (2001) Reynoso, E. M. & Mangum, J. G. 2001, AJ, 121, 347
- Reynoso & Goss (2002) Reynoso, E. M., & Goss, W. M. 2002, ApJ, 575, 871
- Reach & Rho (1999) Reach, W. T. & Rho, J. 1999, ApJ, 511, 836
- Reach & Rho (2000) Reach, W. T., & Rho, J. 2000, ApJ, 544, 843
- Reach et al. (2002) Reach, W. T., Rho, J., Jarrett, T. H., & Lagage, P. 2002, ApJ, 564, 302
- Reach et al. (2005) Reach, W. T., Rho, J., & Jarrett, T. H. 2005, ApJ, 618, 297
- Reach et al. (2006) Reach, W. T., et al. 2006, AJ, 131, 1479
- Rohlfs & Wilson (1996) Rohlfs, K. & Wilson, T. L. 1996, Tools of Radio Astronomy, Springer-Verlag, Berlin
- Ryder et al. (1998) Ryder, S. D., Sun, Y.-S. Ashley, M. C. B., Burton, M. G., Allen, L. E. & Storey, J. W. V. 1998, Publications of the Astronomical Society of Australia, 15, 228
- Sault & Killeen (1997) Sault, R. J. & Killeen, N., 1997, Miriad Users Guide, ATNF Publication
- Shaver et al. (1985) Shaver, P. A., Salter, C. J., Patnaik, A. R., van Gorkom, J. H., & Hunt, G. C. 1985, Nature, 313, 113
- Schilke et al. (1997) Schilke, P., Walmsley, C. M., Pineau Des Forets, G., & Flower, D. R. 1997, A&A, 321, 293
- Skrutskie et al. (2006) Skrutskie, M. F., et al. 2006, AJ, 131, 1163
- Slysh et al. (1980) Slysh, V. I., Wilson, T. L., Pauls, T., & Henkel, C. 1980, IAU Symp. 87: Interstellar Molecules, 87, 473
- Turner & Lubowich (1991) Turner, B. E. & Lubowich, D. A. 1991, ApJ, 381, 173
- van der Tak et al. (2007) van der Tak, F. F. S., Black, J. H., Schöier, F. L., Jansen, D. J., & van Dishoeck, E. F. 2007, A&A, 468, 627
- van Dishoeck et al. (1993) van Dishoeck, E. F., Jansen, D. J., & Phillips, T. G. 1993, A&A, 279, 541
- Wardle (1999) Wardle, M. 1999, ApJL, 525, L101
- Wardle (2007) Wardle, M. 2007, IAU Symposium, 242, 336
- Whiteoak & Gardner (1974) Whiteoak, J. B. & Gardner, F. F. 1974, A&A, 37, 389
- Wood & Churchwell (1989) Wood, D. O. S. & Churchwell, E. 1989, ApJ, 340, 265
- Woodall & Gray (2007) Woodall, J. M., & Gray, M. D. 2007, MNRAS, 378, L20
- Yusef-Zadeh et al. (1996) Yusef-Zadeh, F., Roberts, D. A., Goss, W. M., Frail, D. A. & Green, A. J. 1996, ApJL, 466, L25
- Yusef-Zadeh, Wardle, & Roberts (2003) Yusef-Zadeh, F., Wardle, M., & Roberts, D. A. 2003, ApJ, 583, 267
- Ziurys et al. (1989) Ziurys, L. M., Friberg, P., & Irvine, W. M. 1989, ApJ, 343, 201
| Designation | RA(2000) | Dec.(2000) | Sp | VLSR | |
|---|---|---|---|---|---|
| (h m s) | (° ′ ″ ) | (mJy) | ( km s-1) | ( km s-1) | |
| M1 | 17 17 59.2 | -37 26 21.07 | 90 | 16.7 | 1.5 |
| M2 | 17 17 59.2 | -37 26 48.07 | 152 | 1.8 | |
| M3 | 17 17 59.9 | -37 26 09.01 | 1310 | 16.0 | 1.8 |
| M4 | 17 18 00.9 | -37 25 59.94 | 1020 | 15.2 | 1.6 |
| M5 | 17 18 01.4 | -37 26 23.90 | 277 | 16.9 | 1.4 |
| Parameter | Mopra | SEST |
| Observed frequencies (GHz) | 110 | 86 – 270 |
| Total bandwidth (MHz) | 64 | 264 |
| No. of frequency channels | 1024 | 21000 |
| Velocity resolution (km s-1) | 0.20 | 0.06 – 0.14 |
| Velocity coverage (km s-1) | 160 | 60 – 100 |
| FWHP beamwidth (arcsec) | 43 | 57–20 |
| Area observed (arcmin2) | 3.5 4 | 1.5 2 |
| Grid interval (arcsec) | 30 | 24 |
| Integration time (min) | 1 | 1 |
| Parameter | OH observations | H2CO | CH3OH | |||
| Date | Dec 1999 | Nov 1998 | Nov 1998 | May 2001 | May 2000 | Apr 2002 |
| Jun 2000 | ||||||
| Central frequency (MHz) | 1666 | 4660 | 6030 | 6049 | 4829 | 6668 |
| 4751 | 6035 | |||||
| 4765 | ||||||
| Array configurations | 1.5A, 6B | 6D | 6D | 750A | 1.5A | 6A |
| Primary beam (arcmin) | 33 | 10 | 10 | 10 | 10 | 10 |
| Total bandwidth (MHz): | ||||||
| spectral-line | 8 | 4 | 4 | 4 | 4 | 4 |
| continuum | 128 | 128 | 128 | – | – | – |
| No. of frequency channels: | ||||||
| spectral-line | 1024 | 1024 | 1024 | 2048 | 2048 | 2048 |
| continuum | 32 | 32 | 32 | – | – | – |
| Velocity resolution (km s-1) | 1.6 | 0.2 | 0.2 | 0.1 | 0.1 | 0.1 |
| Total observing time (hr) | 213 | 13 | 13 | 3 | 13 | 6 |
| Spectral-line cubes: | ||||||
| Synthesised beam (arcsec2) | 15 12 | 3 2 | 2 2 | 37 10 | 4 2 | 2 1.5 |
| rms noise ( mJy beam-1) | 5 | 7 | 6 | 9 | 7 | 9 |
| Molecule | Frequency | Transition |
|---|---|---|
| OH | 1665 MHz | J=3/2 |
| OH | 1667 MHz | J=3/2 |
| OH | 4660 MHz | J=1/2 |
| OH | 4751 MHz | J=1/2 |
| OH | 4765 MHz | J=1/2 |
| OH | 6031 MHz | J=5/2 |
| OH | 6035 MHz | J=5/2 |
| OH | 6049 MHz | J=5/2 |
| H2CO | 4829 MHz | |
| CH3OH | 6668 MHz | A+ |
| Molecule | Transition | Beam Size | ||||
|---|---|---|---|---|---|---|
| (GHz) | (arcsec) | (K) | ( km s-1) | ( km s-1) | ||
| 13COa | 1–0 | 110.197 | 43 | 3.90.2 | 16.4 | 2.7 |
| 12CO | 2–1 | 230.538 | 23 | 31.10.1 | 15.1 | 3.9 |
| 1–0 | 115.271 | 45 | 17.80.2 | 16.5 | 3.9 | |
| CS | 5–4 | 244.935 | 21 | 0.4 | – | – |
| 3–2 | 146.969 | 34 | 0.70.1 | 16.1 | 4.2 | |
| 2–1 | 97.981 | 52 | 0.50.1 | 16.7 | 3.3 | |
| HCO+ | 3–2 | 267.557 | 20 | 0.3 | – | – |
| 1–0 | 89.188 | 54 | 2.10.1 | 13.3 | 4.5 | |
| HCN | 3–2 | 265.886 | 20 | 0.5 | – | – |
| 1–0b | 88.632 | 55 | 1.00.1 | 12.9 | 3.3 | |
| H2CO | 3(1,2)–2(1,1) | 225.698 | 23 | 0.2 | – | – |
| 3(0,3)–2(0,2) | 218.222 | 24 | 0.2 | – | – | |
| 2(1,1)–1(1,0) | 150.498 | 36 | 0.30.1 | 16.8 | 6.5 | |
| 2(1,2)–1(1,1) | 140.839 | 38 | 0.2 | – | – | |
| SO | 23–12 | 109.252 | 47 | 0.2 | – | – |
| 32–21 | 99.299 | 50 | 0.50.1 | 14.7 | 3.0 | |
| SiO | 5–4 v=0 | 217.105 | 24 | 0.4 | – | – |
| 3–2 v=0 | 130.268 | 40 | 0.3 | – | – | |
| 2–1 v=0 | 86.846 | 57 | 0.2 | – | – |
() from Mopra observations; (b) values for the main hyperfine component;
| Designation | (1–0) | (2–1) | (1–0) | (2–1) | L(1–0) | L(2–1) | R |
| ( erg s-1 cm-2 sr-1) | ( ergs s-1 cm-2) | () | () | ||||
| Knot 1 | 24 | 6.0 | 38 | 8.4 | 38 | 8 | 5 |
| Knot 2 | 52 | 9.6 | 66 | 12 | 66 | 12 | 5 |
| Knot 3 | 43 | 8.4 | 49 | 10 | 49 | 10 | 5 |
| Knot 4 | 36 | 7.2 | 40 | 4.8 | 40 | 5 | 8 |
| Knot 5 | 44 | 8.4 | 41 | 7.2 | 41 | 7 | 6 |
| total | 52 | 9.6 | 540 | 90 | 540 | 88 | 6 |
| Parameter | MM(1) | MM(2) |
|---|---|---|
| RA (2000) (h m s) | 17 17 59.3 | 17 18 11.1 |
| Dec. (2000) (° ′ ″ ) | 37 26 10.00 | 37 28 23.93 |
| 1665 peak (Jy) | 0.09 | 0.06 |
| 1665 Vpeak ( km s-1) | 21 | 16 |
| 1667 peak (Jy) | – | 0.10 |
| 1667 Vpeak ( km s-1) | – | 10 |
| Molecule | G349.7+0.2 | IC 443a | TMC-1 | L134N | ||
| ( cm-2) | ||||||
| 12CO | 4 | 1 | 8 | 8 | ||
| 13CO | 8 | 2 | 2 | 2 | … | … |
| HCO+ | 3 | 7.5 | 1 | 3 | 8 | 8 |
| HCN | 1.3 | 3.2 | 3 | 9 | 2 | 4 |
| CS | 3 | 7.5 | 6 | 8 | ||
| SO | 1.2 | 3.0 | 8b | 5 | 2 | |
| H2CO | 5 | 7 | 2 | 2 | 2 | |
| SiO | 3 | 2 | 4 | 2 | 4 | |
(a) It is suggested that the shocked gas in IC 443 has two components: abundances correspond to shocked gas with cm-3 and 80 K, while abundances correspond to shocked gas with 3 cm-3 and 200 K (see van Dishoeck et al., 1993, for more details); (b) derived for a single component model;