Early-Type Galaxies in the Coma Cluster: a new piece in the Calcium puzzle
Abstract
We present measurements of the Ca ii triplet and the Ca4227 Lick-index for a sample of early-type galaxies in the Coma cluster, deriving, for the first time, their corresponding relationships with velocity dispersion. Compared with a similar subsample of ellipticals in the field, Coma galaxies with velocity dispersions in the range km s-1 exhibit significant differences in the strengths of the Ca features, suggesting an influence of the environment on the star formation histories of these galaxies. We argue that the main scenarios previously proposed to explain the relatively low Ca ii triplet of galaxies are not able by themselves to simultaneously reconcile the strengths of the two Ca indices in both environments.
1 Introduction
The near-infrared (nIR) Ca ii triplet constitutes the strongest absorption feature in the integrated spectra around 8600 Å of relatively old stellar populations. Given its well-known capability to derive the metallicity of galactic globular clusters (Armandroff & Zinn 1988, hereafter A88; Rutledge, Hesser & Stetson 1997), this spectral feature was considered a useful tool to study the stellar populations of normal galaxies. However, the first observational work (Cohen 1979; Bica & Alloin 1987; Terlevich, Díaz & Terlevich 1990; Houdashelt 1995) reported only small differences among the integrated Ca ii triplet of several types of galaxies, remarkably at variance with the trends found when using other metallicity indicators (e.g. the Mg triplet at 5175Å). The difficulties of previous single stellar population (SSP) models to make reliable predictions of the Ca ii triplet (due to severe deficiencies in the available stellar libraries) prevented an understanding of the above apparent inconsistency.
After a series of papers devoted to construct realistic models for disentangling the actual behaviour of the Ca ii triplet in stellar populations (Cenarro et al. 2001a, hereafter C01; Cenarro et al. 2001b; Cenarro et al. 2002, hereafter C02; Vazdekis et al. 2003, hereafter V03), the above topic is being revisited and constitutes a controversial matter of debate. There exist recent evidences showing that, unlike other metal-lines, the Ca ii triplet is surprisingly anti-correlated with central velocity dispersion () for several types of galaxies: ellipticals (Es) in the field (Saglia et al. 2002, hereafter S02; Cenarro et al. 2003, hereafter C03), bulges of spirals (Falcón-Barroso et al. 2003, hereafter F03) and dwarf Es (dEs) in the Fornax cluster (Michielsen et al. 2003). Even more importantly, the measured values in giant Es lie well below model predictions for any reasonable choice of stellar populations parameters (age and metallicity). A wide range of interpretations, like the existence of a dwarf-enriched stellar population, Ca underabundances, Ca depletion in the interstellar medium or a composite stellar population have been discussed in the above references. Unfortunately, the lack of definitive evidences makes no consensus to exist at the moment.
In the blue spectral range, Ca4227 is considered as the most Ca-sensitive Lick-index (Tripicco & Bell 1995). Intriguingly, despite Ca is an -element like Mg, the metallicities inferred for Es using Ca4227 suggest that Ca is not enhanced –even it could be depressed– with respect to Fe (Worthey 1992; Vazdekis et al. 1997, hereafter V97; Worthey 1998; Trager et al. 1998; Vazdekis et al. 2001; Proctor & Sansom 2002, hereafter P02). Once again, the existence of Ca underabundances have been demanded to explain the low Ca4227 values (Thomas, Maraston & Bender 2003b; hereafter T03b).
It is well known that the environment is expected to play a decisive role in the assembling and star formation history of galaxies. Hierarchical scenarios predict that Es in rich clusters were mostly formed at high redshifts, whereas field Es may have experienced an extended and more complex star formation history (Kauffmann & Charlot 1998). Although no differences in the [Mg/Fe] ratios seem to exist between cluster and field Es (Jørgensen 1999; Kuntschner et al. 2002), Sánchez-Blázquez et al. (2003, hereafter S03) have recently found significant differences in C and N abundance ratios between Coma and field Es. These differences impose strong constraints to models of galaxy formation and chemical evolution.
The above picture motivated us to extend the previous work to the analysis of the Ca ii triplet and the Ca4227 index in galaxies of different environments. First of all, because it might reveal new clues on the so confusing Ca ii triplet behaviour. Secondly, because the fact that Ca seems to be an anomalous -element makes it specially interesting from the point of view of chemical evolution.
2 Observations and data reduction
This work makes use of long-slit spectroscopic data for two samples of galaxies: Es from the Coma cluster and Es in the field. Both were observed during two different runs (1999 March and 2001 April) using ISIS, the double-arm spectrograph at the 4.2 m William Herschel Telescope (Observatorio del Roque de los Muchachos, La Palma). All details about the sample, observations and data reduction for Es in the field are given in C03 and Sánchez-Blázquez (2004; hereafter S04), for the nIR and blue-arm data respectively. We also refer the reader to S04 for a description of the reduction of the blue spectroscopic data for the Coma galaxies. In this section we just concentrate on their nIR spectral range (8355 – 9164 Å).
Our sample of galaxies from the Coma cluster consists of 28 early-type galaxies (E – S0) spanning a wide range of central velocity dispersions ( km s-1). We have rejected the faintest low-mass galaxies in S03 because of quite large errors. When it was feasible, the 3.5 arcmin long slit (2 arcsec width, providing 2.9 Å FWHM spectral resolution) was rotated to include two galaxies in the same exposure. Otherwise, single galaxies were observed by aligning the slit with the major axis. Exposure times of 1200 – 2000 s per galaxy leaded to signal-to-noise ratios per angstrom from 30 to 120 Å-1 in a central aperture of radius /8.
Standard spectroscopic reduction procedures were performed with REDucm E (Cardiel 1999). Apart from an accurate correction for the fringe pattern, we took special care on the sky subtraction and the correction for telluric absorptions at Å (by using the telluric pattern derived from the spectra of flux standard stars). Both are specially critical for Coma galaxies since the redshift of the cluster (z 0.025) places some index bandpasses in regions affected by atmospheric absorptions and strong sky emission lines. The availability of error spectra for each galaxy frame allowed us to estimate reliable uncertainties in the measurements of the indices. Index errors account for photon statistics, uncertainties in the flux calibration and radial velocity determinations (see details in C01).
Final spectra were relative-flux calibrated using spectrophotometric standard stars observed several times at different air masses. In order to transform the nIR spectra to the V03 spectrophotometric system, a sample of 39 stars (from B to late M spectral types) in common with C01 were observed during twilights. Following C03, they were also employed as templates for determinations. Rather than using template-dependent polynomials, systematic differences between indices measured at different spectral resolutions were prevented by broadening all the spectra up to the largest of the galaxy sample, namely 370 km s-1, corresponding to NGC 4889.
The observation of four Es in common with C03 allowed us to confirm an homogeneous spectrophotometric system for the blue and nIR spectra of both observing runs.
3 Index– relations
We analyze, for the first time, the behaviours of the Ca ii triplet, the H Paschen series (CaT∗, CaT and PaT line-strength indices; see definitions in C01) and the Ca4227 Lick-index as a function of for Es in the Coma cluster. All the measurements correspond to a central aperture of radius /8 (or 1 arcsec for galaxies with arcsec). There exists a database111http://www.ucm.es/info/Astrof/ellipt/CATRIPLET.html listing the galaxy sample as well as the indices and determinations.
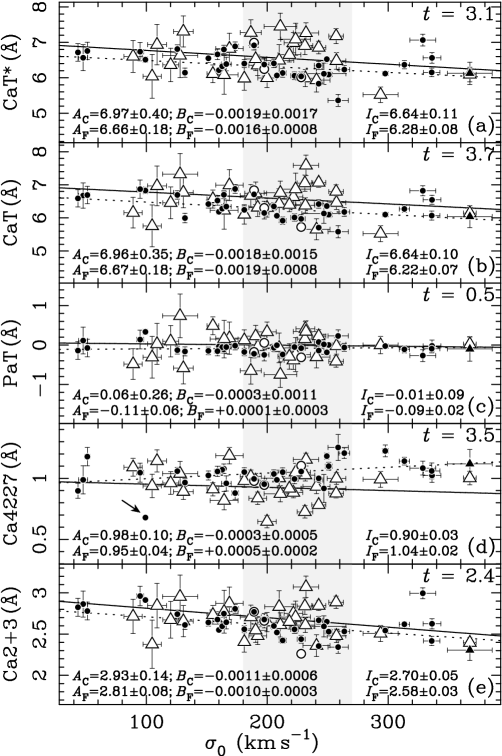
Figure 1 shows the measurements of the above indices versus for Es in the Coma cluster and, for comparisons, for a similar subsample of Es in the field. Error-weighted, least-squares linear fits to all data have been computed for both samples (see labels in Fig. 1). CaT∗ and CaT in Coma Es exhibit an anti-correlation with (panels and ) which is compatible with the one derived for field Es (C03). However, because of the errors of the computed slopes, we cannot rule out that a flat trend with could exist for the Coma sample. As in the case of field Es, a flat behaviour is derived for the PaT index (panel ), whilst both slightly positive and negative (nearly flat) trends are evidenced for the Ca4227 indices of field and Coma Es respectively (panel ). In brief, as regards to the qualitative behaviours with of the above indices, we find no important differences between field and Coma Es.
The most striking differences between both samples arise from the mean absolute values of their Ca indices. In particular, though intermediate-low mass Es ( km s-1) in both samples exhibit similar mean index values, we find clear differences for those Es within the range km s-1 (in the following we will refer to them as massive Es, the ones being the main subject of discussion in this letter). Note that, other than visual inspection, there exist not any a priori argument to justify the above subsample selection. Interestingly, the fact that the differences in C4668 and CN2 for Coma and field Es are also particularly evident in a similar range of velocity dispersion (S03) supports the idea that massive Es in different environments could indeed have different stellar population properties. Unfortunatelly, the scarcity of Es with km s-1 in our Coma sample prevents us to confirm whether the above behaviour extends to the high-mass end of the Es family.
For this subsample of massive galaxies consisting of 17 Coma Es and 15 Es in the field, we have computed error-weighted means of the indices and their corresponding standard errors (see labels in Fig. 1). The statistical significance of the differences between the mean indices of both samples is studied by using a -test (see Fig. 1; for a significance level of , values larger than 1.96 indicate that a significant difference exists). Apart from the fact that no significant differences are found for the PaT index (as it is expected for relatively old stellar populations; see V03), we conclude the existence of a intriguing behaviour: while field Es exhibit Ca4227 values significantly larger than Coma Es, the contrary occurs for the CaT∗ and CaT indices. In order to check that the above results are not driven by uncertainties in the correction for nIR telluric absorptions, we also measured the Ca2 and Ca3 classical indices by A88 (Ca23 Ca2 Ca3). The high sensitivities of these indices to velocity dispersion and to the presence of Paschen lines (see C01) are not important when, as it is the case, they are measured on the spectra of old stellar populations at equal spectral resolution. In turn, the major improvement lies in the fact that their continuum sidebands are located in regions free from telluric absorptions for the redshift of the cluster. The data in Fig. 1 (panel ) prove that the trends and differences inferred from these indices are compatible with the ones derived for CaT∗ and CaT.
4 Discussion
As it has been recently reported by S02, C03 and F03, single and composite stellar populations models with solar abundance ratios ([Fe]) and a standard initial mass function (IMF) cannot reproduce the low Ca ii values of massive galaxies by solely assuming age and metallicity variations. Among others, two alternate scenarios have been proposed: i) the existence of Ca underabundances and ii) the existence of a dwarf-enriched stellar population. In the following paragraphs we explore in turn whether the above scenarios are consistent enough to explain simultaneously the discrepancy with the model predictions and the differences between distinct environments.
i) Even though there exist no evolutionary synthesis models for the Ca ii triplet in which non-solar abundances ratios are considered, the Ca underabundant hypothesis has been proposed as a plausible scenario to explain the low CaT of massive galaxies (S02; F03). Making use of stellar population models with variable element abundance ratios for the Lick indices (Thomas, Maraston & Bender 2003a; hereafter T03a), T03b suggest the existence of a Ca depletion, with respect to the rest of elements, that increases with galaxy mass. Under this scenario, and assuming that the integrated Ca ii triplet indeed traces the Ca abundance, the relative differences in the CaT of massive Coma and field Es should be naturally explained as differences in the levels of Ca underabundances, being field Es “more Ca underabundant” than Coma galaxies. However, there exist a strong contradiction in the fact that while mean Ca ii indices of massive Coma Es are larger than of those in the field, the contrary occurs for Ca4227. Furthermore, taking into account that Ca4227 is affected by C and N abundances in the sense that the stronger CN the lower Ca4227 (Schiavon et al. 2002; P02; T03a), and given that field Es exhibit CN overabundances larger than those in Coma Es (S03), the relative differences in Ca4227 cannot be explained by just CN effects either. In fact, if we consider such an effect, the actual difference between the Ca4227 strengths of both samples should be even larger than that in Fig. 1 (panel ). In summary, just the existence of Ca underabundances and/or CN effects is unable to reconcile Ca4227 and CaT∗ at the same time.
ii) Since the Ca ii triplet of giant stars is stronger than that of dwarf stars, the existence of a dwarf-enriched stellar population could account for the low values of massive Es. This scenario can be parametrized by means of a variation of the IMF-slope (; assuming a Salpeter-like IMF). The evolutionary synthesis models by V03 predict that, for old SSPs with intermediate-to-high metallicities, CaT∗ and CaT mainly depend on (they decrease with the increasing because of a larger dwarf-to-giant stars ratio). In the light of the above predictions, massive Es are interpreted to have both metallicities and dwarf-to-giant ratios larger than low mass Es (C03).
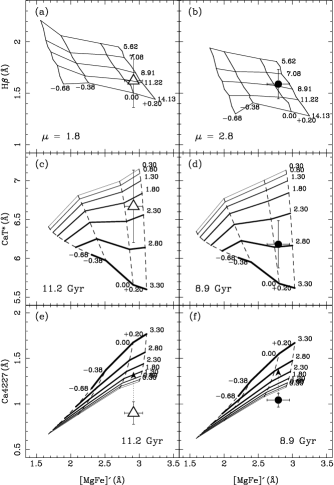
In Figure 2 we make use of the models by Vazdekis (1999; hereafter V99) and V03 to compare Coma and field Es under this scenario. The only way to reconcile H, [MgFe]’ (the one being independent of typical /Fe ratios as defined by T03a) and CaT∗ at the same time is invoking different ages, metallicities and dwarf-to-giant ratios. In turn, the later also affects the derived ages and metallicities because of the non-negligible dependendence of H to the dwarf-to-giant ratio. From panels , , and , we derive similar metallicities (above solar) for both subsamples, a mean age for field Es lower ( Gyr) than that for Coma Es ( Gyr), and mean dwarf-to-giant ratios larger for the former () than for the latter (). However, when this scenario is simultaneously applied to Ca4227, the model predictions fail to reproduce the locus of the galaxies (panel ). Therefore, even though relative differences between the Ca indices of Coma and field Es could be compatible with just variations of the dwarf-to-giant ratio (the larger , the lower CaT∗ and the larger Ca4227; panels , , and ), this argument is not enough to reconcile absolute values of CaT∗ and Ca4227 by itself.
At this point, one notices that the current status is not quite optimistic. Could it be that both scenarios coexist driving an apparent inconsistency? Even though the sensitivity of Ca4227 to unusual dwarf-to-giant ratios is not negligible, age and metal abundances effects are mainly expected to govern its behaviour. The arrows in panels and of Fig. 2 would indicate the offsets in Ca4227 -arising not only from the existence of Ca subabundances but also from possible dilution effects due to CN enhancements- required to reproduce the SSPs properties in the previous panels. On the contrary, several arguments support the idea that the Ca ii triplet is rather unsensitive to Ca abundances. First, the CaT index does not correlate with stellar [Ca/Fe] abundance ratios (C02). Also, for SSPs older than Gyr with intermediate-to-high metallicities, the integrated Ca ii triplet saturates (or even decreases for dwarf-enriched SSPs) with the increasing metallicity (V03). This is indeed a by-product of the increasing luminosity-weight of late-M stellar types (with very weak Ca ii lines and strong TiO bands in their spectra) as the temperature of the isochrone becomes colder. Therefore, just because of temperature effects, very metal rich stellar populations with high Ca abundances are expected to exhibit CaT values lower than if, for example, they were solar-abundant (see more details in V03). In this sense, Ca ii triplet indices are expected to be sensitive to global metallicity rather than to Ca abundances.
To conclude, we report, for the first time, systematic differences between the integrated Ca ii triplet and Ca4227 of Es in the Coma cluster and in the field which are difficult to reconcile at the same time. Different abundance ratios and/or dwarf-enriched stellar populations could be conspiring to produce apparently inconsistent Ca indices. As proposed in S03, these kind of differences are probably driven by the effect of the environment on chemical evolution and galaxy formation. Unfortunately, far from concluding any definitive prove for distinct star formation histories in massive Es located at different environments, the fact is that the current picture of calcium in galaxies seems to go beyond the capabilities of the available SSPs models. An extensive effort in the field of nucleosynthesis and stellar atmospheres are demanded to understand how different abundance ratios affect, not only line-strength indices, but also the physics and temperature of isochrones. In the mean time, the collection of more and high-quality data of Ca line-strengths is crucial for trying to understand the controversial Ca puzzle.
Acknowledgments
The authors are indebted to the referee S. M. Faber for useful comments and suggestions. A. J. C. acknowledges financial support from a UCM Fundación del Amo Fellowship. The WHT is operated on the island of La Palma by the Royal Greenwich Observatory at the Observatorio del Roque de los Muchachos of the Instituto de Astrofísica de Canarias. This work was supported by the Spanish research project AYA2003-01840.
References
- (1) Armandroff, T.E., Zinn, R., 1988, AJ, 96, 92 (A88)
- (2) Bica, E., Alloin, D., 1987, A&A, 186, 49
- (3) Cardiel, N., 1999, PhD thesis, Universidad Complutense, Madrid
- (4) Cenarro, A.J., Gorgas, J., Vazdekis, A., Cardiel, N., Peletier, R.F., 2003, MNRAS, 339, L12 (C03)
- (5) Cenarro, A.J., Gorgas, J., Cardiel, N., Vazdekis, A., Peletier, R.F., 2002, MNRAS, 329, 863 (C02)
- (6) Cenarro, A.J., Cardiel, N., Gorgas, J., Peletier, R.F., Vazdekis, A., Prada, F., 2001a, MNRAS, 326, 959 (C01)
- (7) Cenarro, A.J., Gorgas, J., Cardiel, N., Pedraz, S., Peletier, R.F., Vazdekis, A., 2001b, MNRAS, 326, 981
- (8) Cohen, J.G., 1979, ApJ, 228, 405
- (9) Faber et al., 1997, AJ, 114, 1771
- (10) Falcón-Barroso, J., Peletier, R.F., Vazdekis, A., Balcells, M., 2003, ApJ, 588, L17 (F03)
- (11) Houdashelt, M.L., 1995, PhD thesis, The Ohio State University
- (12) Jørgensen, I., 1999, MNRAS, 306, 607
- (13) Kauffmann, G., Charlot, S., 1998, MNRAS, 294, 705
- (14) Kuntschner, H., Smith, R., Colles, M., Davies, R., Kaldare, R., Vazdekis, A., 2002, MNRAS, 337,172 (K02)
- (15) Michielsen, D., De Rijcke, S., Dejonghe, H., Zeilinger, W.W., Hau, G.K.T., 2003, ApJ, 597, L21
- (16) Proctor, R.N., Sansom, A.E., 2002 MNRAS, 333, 517 (P02)
- (17) Rutledge, G.A., Hesser, J.E., Stetson, P.B., 1997b, PASP, 109, 907
- (18) Saglia, R.P., Maraston, C,. Thomas, D., Bender, R., 2002, ApJ, 579, L13 (S02)
- (19) Sánchez-Blázquez, P., Gorgas, J., Cardiel, N., Cenarro, J., González, J.J., 2003, ApJ, 590, L91 (S03)
- (20) Sánchez-Blázquez, P., 2004, PhD thesis, Universidad Complutense, Madrid (S04)
- (21) Schiavon, R.P., Faber, S. M., Castilho, B. V., Rose, J. A., 2002, ApJ, 580, 850
- (22) Terlevich, E., Díaz, A.I., Terlevich, R., 1990, MNRAS, 242, 271
- (23) Thomas, D., Maraston, C., Bender, R., 2003b, MNRAS, 343, 279 (T03b)
- (24) Thomas, D., Maraston, C., Bender, R., 2003a, MNRAS, 339, 897 (T03a)
- (25) Trager, S.C., Worthey, G., Faber, S.M., Burstein, D., González J.J., 1998, ApJS, 116, 1
- (26) Tripicco, M.J., Bell, R.A., 1995, AJ, 110, 3035
- (27) Vazdekis, A., Cenarro, A.J,. Gorgas, J., Cardiel, N., Peletier, R.F., 2003, MNRAS, 340, 1317 (V03)
- (28) Vazdekis, A., Kuntschner, H., Davies, R., Arimoto, N., Nakamura, O., Peletier, R., 2001, ApJ, 551, 127
- (29) Vazdekis, A., 1999, ApJ, 513, 224
- (30) Vazdekis, A., Peletier, R.F., Beckman, J.E & Casuso, E., 1997, ApJS, 111, 203 (V97)
- (31) Worthey, G., 1998, PASP, 110, 888
- (32) Worthey, G., 1992, PhD thesis, University of California, Santa Cruz