Radial Distribution of Dust Grains around HR 4796A
Abstract
We present high-dynamic-range images of circumstellar dust around HR 4796A that were obtained with MIRLIN at the Keck II telescope at = 7.9, 10.3, 12.5 and 24.5 m. We also present a new continuum measurement at 350 m obtained at the Caltech Submillimeter Observatory. Emission is resolved in Keck images at 12.5 and 24.5 m with PSF FWHM’s of 0.37′′ and 0.55′′, respectively, and confirms the presence of an outer ring centered at 70 AU. Unresolved excess infrared emission is also detected at the stellar position and must originate well within 13 AU of the star. A model of dust emission fit to flux densities at 12.5, 20.8, and 24.5 m indicates dust grains are located AU from the star with effective size, 286 m, and an associated temperature of 26040 K.
We simulate all extant data with a simple model of exozodiacal dust and an outer exo-Kuiper ring. A two-component outer ring is necessary to fit both Keck thermal infrared and HST scattered-light images. Bayesian parameter estimates yield a total cross-sectional area of 0.055 AU2 for grains roughly 4 AU from the star and an outer-dust disk composed of a narrow large-grain ring embedded within a wider ring of smaller grains. The narrow ring is 141 AU wide with inner radius 661 AU and total cross-sectional area 245 AU2. The outer ring is 8015 AU wide with inner radius 455 AU and total cross-sectional area 90 AU2. Dust grains in the narrow ring are about 10 times larger and have lower albedos than those in the wider ring. These properties are consistent with a picture in which radiation pressure dominates the dispersal of an exo-Kuiper belt.
Subject headings:
circumstellar matter – infrared: stars – planetary systems: formation – planetary systems: protoplanetary disks – solar system: formation – star: individual(HR 4796A (catalog ))1. Introduction
In the last half decade, advances in high-resolution long-wavelength techniques have yielded an increased number of spatially resolved images of thermal emission from dusty disks around nearby stars (Greaves et al. 1998; Holland et al. 1998; Jayawardhana et al. 1998 [Jay98]; Koerner et al. 1998 [K98]; Holland et al. 1999; Koerner, Ostroff & Sargent 2001; Wilner et al. 2002; Wahhaj et al. 2003; Weinberger et al. 2003). These typically reveal dust masses located at several tens of AUs from the central star in a region analagous to the Edgeworth-Kuiper Belt in our own solar system. In most instances, emission is markedly reduced close to the star. This inner clearing was previously inferred in some cases on the basis of the spectral energy distribution (SED) (e.g., Jura 1998). Dust located here is most easily detected at mid-infrared wavelengths where stellar photospheric radiation is relatively diminished and circumstellar dust emission is at a maximum. If located within an ice-condensation radius, it can be considered to be analogous to the solar system’s zodiacal dust, a population of grains that emanates from asteroid collisions and the disintegration of comet tails (Dermott et al. 1994). The presence of such an “exozodiacal” dust component was inferred by K98 on the basis of high-resolution () 12 and 20 m images of HR 4796A.
The detection of exozodiacal dust is of considerable importance to efforts aimed at the detection of earth-like planets (Backman et al. 1998). In light of a rapid dispersal timescale ( 104 yr; Gustafson 1994), current detections imply an origin in the collision of minor planetary bodies and perhaps resonant trapping by larger ones. The dust also may impact planetary detection techniques as a source of confusing radiation (Backman et al. 1998). Despite their importance, detections are currently few in number. Evidence for exozodiacal dust around HR 4796A was recently brought into question by Telesco et al. 2000 (T00) and Li & Lunine 2003 (LL03). Resolution of the issue is complicated by the fact that a prominent outer dust ring provides a confusing signature at the resolution of HR 4796A images. Here we present additional high-resolution images of HR 4796A with modeling designed to better understand the radial structure of its circumstellar dust, including whether or not an exozodiacal dust component is required by the data.
HR 4796A is an A0V star (Houk & Sowell 1985) located at a distance of 673 AU ( catalog) with an age of 82 million years (Stauffer et al. 1995). K98 and Jay98 first resolved the disk in thermal infrared images. Jay98 noted that a line-cut through their 18 m image could be simulated with a ring 50 to 110 AU in extent. K98 simulated Keck images at higher resolution and demonstrated over a large range of models that an inner clearing was demanded by the data. The most probable values of disk properties yielded inner and outer radii of 55 and 80 AU, respectively, for a disk inclined from face on. K98 also found excesses at the stellar position at 12 m and 20 m with values that implied a dust temperature of 250K and, in turn, a location 4.5 AU from the star. Schneider et al. 1999 (S99) imaged scattered light from the HR 4796A outer ring with HST/NICMOS and confirmed the presence of a narrow (17 AU) outer ring centered at 70 AU. T00 and Wyatt et al. 1999 (W99) analyzed Keck images at 10 m and 18 m and derived a radial surface density to the outer ring that rose exponentially from AU, doubled between 60 and 70 AU, and fell like outside 70 AU with an outer cutoff at AU. Grain sizes were estimated to be 2-3 m in contrast to 30 m grains found by K98. T00 also found that any excess detected in their images at the stellar position was consistent with their photometric uncertainties. Augereau et al. 1999 presented models of the SED of HR 4796A which predicted dust within 10 AU of the star. LL03 showed that the SED could be modeled without a zodiacal dust component. Sitko et al. 2000 observed that the silicate emission feature is very weak, suggesting that there aren’t many small silicate grains near the star. He also estimated that only half the flux in the 8-13.5 m range is photospheric, detecting more excess than in the 12.5 m MIRLIN image in K98. Here we present new data and model all extant measurements simultaneously. These allow us to resolve disputes about the properties of dust around HR 4796A.
2. Observation
HR 4796A was observed on UT 11 & 14 June 1998, 30 January 1999, and 3 February 1999 with the mid-infrared camera MIRLIN at the Keck II telescope. MIRLIN’s detector is a Boeing 128128 pixel, high-flux Si:As BIB array with a Keck II plate scale of 0.138′′ per pixel and 17.5′′ field of view (Ressler et al. 1994). Chopping with the Keck II secondary mirror was carried out in a North-South direction at a 4 Hz rate with a throw of 7′′, In between chop sequences, the telescope was nodded East-West with a similar throw. Since thermal IR emission from HR 4796A is confined to within a maximum length of 5′′, the 7′′ chop/nod throw was sufficient for differencing of any pair of images without overlap. Observations were carried out in filters centered at = 7.9, 10.3, 12.5 and 24.5 m with widths 0.76, 1.01, 1.16 and 0.76 m and for on-source integration times of 3, 6, 6, and 52 minutes respectively. Images on double-differenced frames were cross-correlated with a point spread function (PSF) to determine a first estimate of the centroid position and were then coadded. The resulting image was then used in place of the PSF to repeat the process with improved centroiding and produce a new stacked image. This procedure was repeated multiple times until there was no perceptible change in the final coadded image on successive iterations. The final image was sized to 64 64 pixels (8.8′′ 8.8′′) to optimally window the emission from HR 4796A and adjacent background. Infrared standards Leo, Cen, Sco and Boo were observed in the same way at 7.9 (and 10.3), 12.5, 20.8 and 24.5 m respectively at similar airmasses.
To better constrain the properties of grains around HR 4796A, a new continuum measurement was obtained on UT May 23, 1998 at 350 m with the SHARC linear bolometer array camera at the Caltech Submillimeter Observatory. Atmospheric conditions were good with a steady of 0.36. The flux calibrator was Uranus with an angular size of 3.59′′ and a flux density of 242 Jy on that date. The resulting 350 m flux density of HR 4796A was observed to be 16042 mJy and is listed in Table. 1.
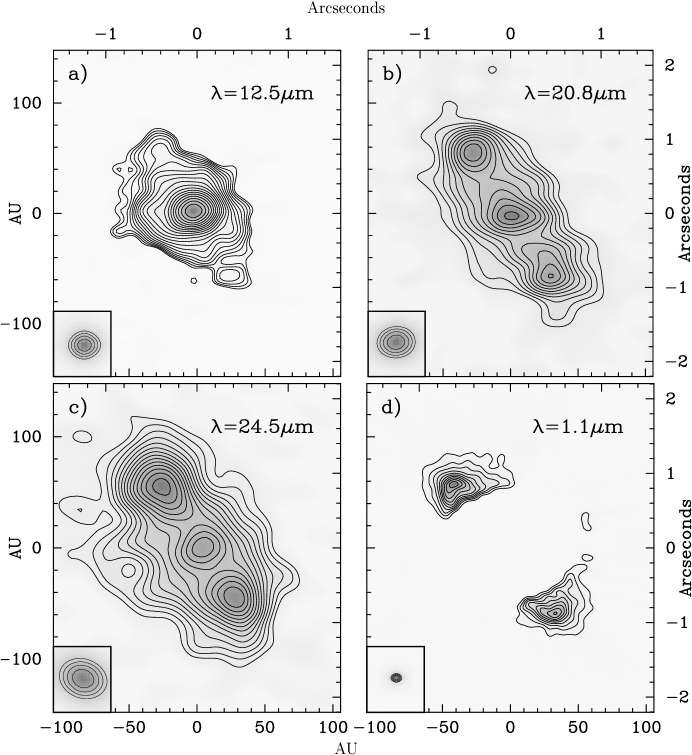
Images of HR 4796A are unresolved at = 7.9 and 10.3 m with respective PSF FWHM of 0.48′′ and 0.45′′ and are not displayed here. Flux densities were calculated by comparison with images of Leo obtained shortly after those of HR 4796A. Flux densities of 30744 mJy and 21824 mJy at 7.9 and 10.3 m were derived, assuming values of 10.68 Jy and 6.44 Jy for Leo at the same wavelengths (Koerner et al. 2000). Photospheric estimates 283 mJy at 7.9 m and 168 mJy at 10.3m, were derived by the fit of a model A0V star (Kurucz 1993) to measurements of HR 4796A at wavelengths shorter than 3 m. It seems that there is a small excess at 10.3 m and an even smaller excess or possibly none at 7.9 m.
The 12.5 m image is shown in Fig. 1(a). The 64 64 image was finely gridded to 256 256 pixels and then smoothed by convolution with a circular hat function of radius equal to the FWHM of Boo (PSF star) which was observed immediately after HR 4796A. The resolution of the image is 0.37′′. Peak brightnesses are calculated as the flux in the brightest pixel, divided by the pixel area. The central peak brightness was measured to be 72344 mJy/arcsec2 while that expected from the photosphere is 387 mJy/arcsec2. The total flux at 12.5 m is 23114 mJy, while the photospheric flux at 12.5 m is 114 mJy. The long axis enclosed by the 3 contour is 2.1′′ (141 AU). NE and SW peaks are detected with total separation 1.9′′ (127 AU). The NE and SW peaks are not equal in brightness, but have a flux ratio of 1.13.
The 20.8 m image displayed in Fig. 1(b) is a re-reduced version of data presented in K98. Shifting and adding was carried out as described above, starting with a model of the emission derived from earlier versions of the image. The result exhibits improved signal to noise and a flux density, 1.620.16 Jy, that is consistent with the previously reported 1.880.17 Jy. The final shift-and-add image was smoothed to match the 0.4′′ resolution of the other images in Fig. 1. Emission peaks NE and SW of the star are separated by 1.85′′ (124 AU) in the final smoothed image. The central peak is brightest and 0.93′′ (62 AU) from the SW peak and the same distance from the NE peak. Peak brightness values are 629, 668, and 623 mJy/arcsec2 at the NE, center, and SW positions, respectively. The photospheric flux at = 20.8 m is 41 mJy, and which corresponds to a peak brightness of atmost 82 mJy/arcsec2.
The 24.5 m image is shown in Fig. 1(c) and was reduced in the same way as the 12.5 m image with Boo used as the psf star. Image resolution was 0.55′′. The expected flux from the photosphere is 30 mJy, while the total measured flux for HR 4796A was 2100170 mJy. The expected photospheric brightness in the peak pixel is at most 44 mJy/arcsec2. Comparing this to the central peak brightness of 585 mJy/arcsec2 it is immediately obvious that most of the emission in the central pixel is non-photospheric and probably the result of hot circumstellar dust. The emission extends 1.68′′ (113 AU) from the NE peak to SW peak. The extent of the 3 contour is 3.6′′ (242 AU). The central peak is 0.74′′ (50 AU) from the SW peak and 0.94′′ (63 AU) from the NE peak. Peak brightnesses are 637, 617, and 585 mJy/arcsec2 at the NE, SW and central positions, respectively. The NE/SW brightness ratio is 637:617 = 1.04.
A very high-resolution image of light scattered by the HR 4796A ring was obtained by S99 with the NICMOS coronagraphic camera on HST. We have contoured the 1.1 m image and displayed it in Fig. 1(d) for comparison to the thermal infrared images. The region within 0.6” of the star has artifactual emission from coronagraphic scattering and had been masked off. At a resolution of 0.12” (8 AU), the emission is extended 2.06′′ (138 AU) from NE to SW peak, and exhibits a brightness asymmetry (NE:SW) of 14.4 : 12.2 = 1.18. The extent of the 2 contour line is much more confined than in the thermal infrared images.
| Flux Density | Uncertainty | Photosphere | Reference | ||
|---|---|---|---|---|---|
| (m) | (m) | (Jy) | (Jy) | (Jy) | |
| 7.9 | 0.87 | 0.307 | 0.044 | .283 | This work |
| 10.3 | 1.01 | 0.218 | 0.024 | .168 | ” |
| 12.5 | 1.16 | 0.231 | 0.014 | .114 | ” |
| 20.8 | 1.00 | 1.62 | 0.16 | .041 | ” |
| 24.5 | 0.8 | 2.1 | 0.17 | .03 | ” |
| 350.0 | - | 0.160 | 0.042 | 0 | ” |
| 10.8 | 5.3 | 0.188 | 0.047 | .152 | Telesco et al. 2000 |
| 18.2 | 1.7 | 0.905 | 0.130 | .054 | ” |
| 18.2 | 1.7 | 1.100 | 0.150 | .054 | Jayawardhana et al. 1998 |
| 20.0 | - | 1.860 | 0.186 | .045 | Jura et al. 1993 |
| 800.0 | 100. | 0.028 | 0.0093 | 0 | Jura et al. 1995 |
| 10.1 | 5.1 | 0.270 | 0.026 | .174 | Fajardo-A. et al. 1998 |
| 10.3 | 1.3 | 0.233 | 0.024 | .167 | ” |
| 11.6 | 1.3 | 0.225 | 0.070 | .132 | ” |
| 12.5 | 1.2 | 0.253 | 0.027 | .114 | ” |
| 450.0 | 30 | 0.180 | 0.150 | 0 | Holland et al. 1998 |
| 850.0 | 50 | 0.0191 | 0.0034 | 0 | ” |
| 12.0 | 6.5 | 0.309 | 0.028 | .123 | IRAS |
| 25.0 | 11 | 3.280 | 0.130 | .029 | ” |
| 60.0 | 40 | 8.640 | 0.430 | .005 | ” |
| 100.0 | 37 | 4.300 | 0.340 | .002 | ” |
The images in Fig. 1 confirm the general properties of ring emission inferred from previous high-resolution images (K98, S99, T00). Flux density measurements at the stellar position also appear to substantiate earlier evidence for a hot dust component close to the star (K98). The latter interpretation requires careful consideration, however, since the highly inclined ring passes within 0.3′′ of the star, and the PSF FWHM is 0.4′′. It is necessary to carefully account for the contribution of ring emission at the stellar position to identify the presence of hot dust near the star with certainty. In addition, the structure of the ring, itself, may be better ascertained with detailed analyses that combine information from all images. To accomplish both goals, we compare a variety of ring models to the Keck/MIRLIN and HST images.
3. Modeling
Our modeling approach is designed to best interpret all available observations of HR 4796A, including optical and thermal infrared images and flux densities at longer wavelengths. As a first step, we examine individual Keck/MIRLIN images for evidence of dust close to the star. Then we quantitatively compare models of dust emission by fitting them simultaneously to all available data. To successfully deduce key disk properties in this manner, it is necessary to strike a balance between the need for a detailed physical description (including grain shape, size and composition) and an appropriate number of free parameters. To best achieve this compromise, we use a simple model of emission from a flat optically thin disk as described in Backman, Gillett, & Witteborn (1992). It will be evident from the modeling process that further complications in disk structure, such as a flared disk, or a disk with a thick inner edge, etc., are not required at the resolution of extant data. According to the Backman et al. model, thermal radiation from an annulus of width at distance from the star is
where is the fractional surface density, is the grain temperature, and is the distance to HR 4796A, 67 pc. The optical depth is defined as = , where is the albedo. For moderately absorbing dielectrics and an effective grain radius, , the radiative efficiency is for and for (Greenberg 1979). The grain temperature for efficient absorbers and inefficient emitters is as calculated from radiative balance equations (Backman & Paresce 1993). is the stellar luminosity in solar units. The fragmentation process caused by inelastic collisions between large grains results in a steady state size distribution described by (Dohnanyi 1969). It has been shown that the spectral energy distribution resulting from such a collisional cascade of grains can be approximated by the SED of a population of grains of a single size (Backman, Gillett, & Witteborn 1992). The minimum grain radius in the distribution is , where a is the effective radius of the representive grains.
To simulate the HST/NICMOS image from S99 in Fig. 1(d), we use the following prescription for an emission model. The scattered-light emission from an annulus of width at distance from the star is
where and are the surface intensity and radius of the star. It is important to note that grain size does not affect the intensity of scattered-light emission, as grain temperature is not a factor. Therefore, the grain radius, will not be a parameter in scattered-light modeling.


In keeping with simple theoretical expectations, models used to interpret low-resolution observations of debris disks often approximate the surface density, , as proportional to , where is the stellocentric distance (Gillett 1986; Diner & Appleby 1986; Nakano 1988; Artymowicz, Burrows & Paresce 1989 and Backman, Gillett & Witteborn 1992). High-resolution imaging has revealed a ring-like structure in many cases, however, necessitating the specification of other model parameters such as inner and outer radii and and ring width .
To estimate photospheric emission from HR 4796A, we scale a model of the emission from an A0V star by Kurucz (1993). Model fitting uses all available photometric measurements of HR 4796A at wavelengths shortward of 3 m. To simulate images, the resulting photospheric flux density is used to scale a point source at the stellar position. As a first approximation, we then add emission from a single-ring model and convolve the entire image with an appropriate PSF star. As demanded by the data, we then consider the addition of multiple rings in a similar modeling process.
To calculate the range of acceptable values for model parameters as dictated by a simultaneous comparison to all data, we use a Bayesian approach that assigns a relative probability, , to each model. Here, refers to as defined for the data set. This requires a consistent way of weighting from the image fits with those from SED fits. Thus, for each image, all pixels of intensity above 3 are counted and divided by the area (in pixels) enclosed by the half-maximum contour of the corresponding PSF. This gives a measure of the number of data points represented by an image. The s from each of the image fits is normalized using this number.
Probabilities are calculated for models varying over a large parameter space, and the relative probability of a specific parameter value is derived by summing probabilities for all models with that value. In this way, probability distributions are built up for the values of each parameter (e.g. Lay, Carlstrom, & Hills 1997). As a prelude to modeling the entire data set, we first consider the question of whether or not the images mandate the presence of material close to the star that is analogous to the Solar System’s zodiacal dust.
3.1. Exozodiacal Dust
To date, consensus is lacking in published interpretations of evidence for an inner zodiacal dust component to the HR 4796A system. K98 derived an infrared excess at the stellar position by fitting a scaled PSF to high-resolution Keck images at 12.5 and 20.8 m and comparing the results to expected photospheric levels. T00 failed to detect this excess at 18.2 m, however, by carrying out a similar analysis on Keck images taken under non-ideal photometric conditions. LL03 were able to fit the Spectral Energy Distribution (SED) without an inner dust component by varying grain composition and using outer-disk constraints supplied by the 1.1 m HST image (S99).
The contradiction implied by these results reflects the difficulty of the analysis. Thermal infrared flux calibration is difficult from the ground, and the inner dust component is at the limit of available spatial resolution. For example, T00 derived a total flux density 20% lower than their previous measurement in the same filter at a different telescope (Jay98). If the latter measurement is in error, it would lead to an underestimate of the point-source excess after subtraction of flux from a photospheric model. It is also not surprising that LL03 did not find the case for inner dust compelling on the basis of SED shape alone, since the function that corresponds to emission at a given stellocentric distance is quite broad. The dust component inferred by K98 produces a negligible contribution to the overall SED and can be properly substantiated only by high-resolution imaging data. Keck thermal infrared images of HR 4796A easily separate emission at the stellar position from that of the ring along the long axis of emission (). However, the ring is oriented 27∘ from edge on, and the observations have insufficient resolution across the minor axis (). Consequently, simple PSF fitting will be subject to an uncertainty from contamination by outer-ring emission. Here, we present a modeling approach that accounts for confusion from the outer ring in order to interpret new high-resolution images.
To make an estimate of the contribution of outer-ring radiation to flux detected at the stellar position, we first fit a simple model of outer-ring emission solely to the region outside of 35 AU (0.52′′) from the star. Our initial model was a single flat ring with density , rotational axis inclined 73∘ to the line of sight (S99), and with the long axis aligned at PA 26∘ . A point source with photospheric flux density was added at the stellar position and the entire model image convolved with a PSF star. Ring parameters were varied in independent fits to each of 3 images at and m. Fig. 2 shows line cuts through both the images and best-fit models. It is immediately evident that, in each case, these models fail to reproduce an adequate amount of emission at the stellar position. This comparison strongly supports the inference of an inner zodiacal dust component as concluded by K98.


We make a quantitative estimate of the contribution of emission from inner dust by re-fitting our model to unmasked versions of the thermal infrared images while varying the model flux density at the stellar position. Expected photospheric contributions of 114, 41, and 30 mJy at 12.5, 20.8, and 24.5 m , respectively, were subtracted from the best-fit result to yield estimates of 9241, 15038 and 8722 mJy for the inner component flux densities. The results are plotted in Fig. 3. It is evident from Fig. 3 that the inner component of dust contributes neglibly to the total SED at all wavelengths. Hence, the above result is consistent with the null result of LL03. As a first approximation to estimate physical properties of a zodiacal dust component, we assume grains are located in a single ring of width 0.5 AU and vary the ring inner radius, surface density, , and effective grain radius, . Best-fit values are AU, 0.00460.001, and = 143 m with uncertainties determined by the Bayesian approach described earlier. This implies an average grain temperature of 26040 K. Ice grains of this size in a gas-free environment would have to be at a radial separation of atleast 43 AU to survive sublimation for any appreciable amount of time (Isobe 1970). To evaluate the consistency of our 10.3 and 7.9 m photometry with this simulation, we also plot the estimated contribution to the inner component at these wavelengths in Fig. 3. Assuming that the outer ring SED can be approximated by a 110K blackbody (Jura 1998) and that at 12.5 m the outer ring contribution is 25 mJy, we extrapolate the outer ring contribution to be 5 mJy at 10.3 m and and 0.2 mJy at 7.9 m. Thus the inner component flux density is 4524 mJy at 10.3 m and 2444 mJy at 7.9 m. From Fig. 3, it is evident that our zodiacal dust model can account for these excesses. We emphasize the approximate nature of this estimate and underscore the point that the actual dust configuration may be far more complicated. Nevertheless, a single-ring approximation yields a radial location as indicated in Fig. 4, the probability distribution for the inner ring radius. The uncertainty encloses the 66% confidence interval in the probability distribution.
It is evident in Fig. 2 that the simple power-law description for in the outer ring fails beyond the outer-ring edge. We expect this discrepancy to have no effect on our estimate of the zodiacal dust component. However, we explore it below with a more detailed model to better understand outer-ring structure.
3.2. An Outer Ring with Two Components
To date, the wide variety of published imaging and photometric measurements of HR 4796A have not been used simultaneously to constrain model simulations. An oft-used single-ring model fits some of the individual images plausibly well. Here, however, we show that a more complicated model of the outer ring is required to fit all available data. We first find the single-ring model that provides the best simultaneous fit to all data, including Keck/MIR images, the HST-NICMOS/NIR image, and all extant flux density measurements of HR 4796A (Table. 1). We assume flux values for the zodiacal contribution that were estimated in the previous section; since these contribute negligibly to the other data, only outer-ring parameters are varied. For the coronagraphic HST/NICMOS image, a circular region of radius 0.6′′ centered on the star is masked, so that only the ansae of the outer ring are considered. This accords with S99 who point out that emission inside this region is largely an artifact of photospheric light scattered off the inner edge of the coronagraphic hole. In image fitting, models are freely scaled and thus only fit to the intensity pattern of the data. The total fluxes at the imaging wavelengths are fit as part of the SED.


To minimize the number of free parameters, we make one additional simplification at the onset of detailed modeling. Searches for best-fit images revealed that the NE ansae should have an optical depth that is 20% greater than the SW ansae’s optical depth. So we incorporate this asymmetry into all our models by introducing a sinusoidal azimuthal variation into the optical depth description, such that the function has a crest at the NE peak and a trough at the SW peak. The amplitude of this azimuthal variation is kept constant across all model fits, thus ridding us of one free parameter.
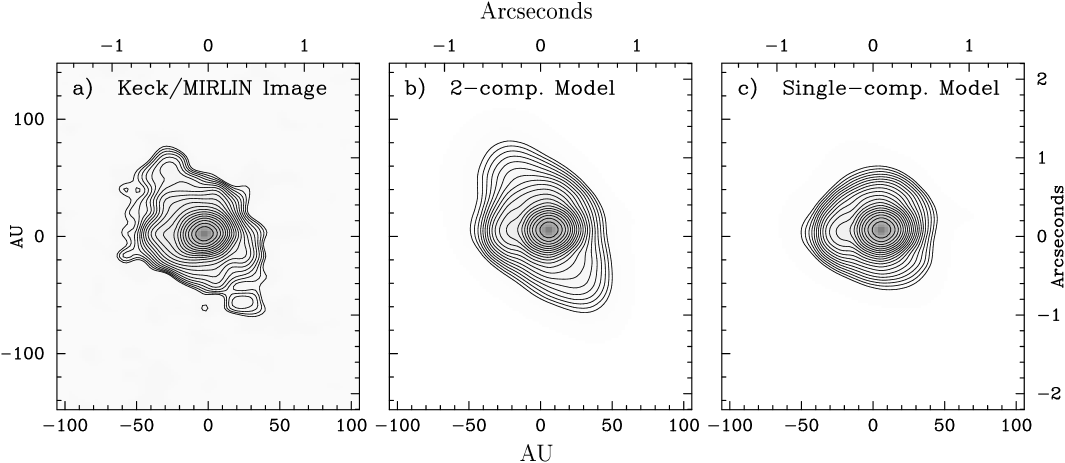
The inadequacy of the single-ring model is most evident in comparison with images at = 12.5 m and 1.1 m and in a discrepancy between model and observed fluxes at thermal infrared wavelengths. In Fig. 5(c), the best-fit single-ring model fails to simulate the extended emission in the 12.5 m image (Fig. 5(a)). It is also discrepant with the MIR flux densities as evident in Fig. 7. Finally, emission profiles at 1.1m (solid line) in Fig. 6 are not well matched by a single-ring model (dot-dashed line) fit to all data. The peaks of model emission are offset toward the star, and model flux is too high at the outer radius and too low at the inner edge. This mismatch is consistent with the positional offset between peaks of scattered-light and thermal emission in Fig. 6(b) of T00, an overlay of the HST/NICMOS countour map on a 18.2m Keck/OSCIR image of HR 4796A. However, it was unclear if this effect was simply due to the higher temperature at the inner edge of a single outer ring. Evidence outlined above indicates the discrepancy in peak locations is also a consequence of a more complex dust distribution.
Some hints as to how the model can be improved are evident in fits to some of the images. A single uniform-density () ring model fit to the MIR images alone gives outer-ring widths of 60 AU and grain radius 5 m. This is close to the grain radius estimates of T00, where the chief constraint is the relative brightnesses of the outer disks at 10 and 18 ms. On the other hand, fits to the SED alone yield a 180-AU-wide ring with roughly 16 m grains. Smaller disk sizes, yield larger grain sizes. In fact, the Wien side of the outer disk’s SED demands small grain sizes, while the Rayleigh-Jeans side of the outer disk’s SED (the submm flux densities) demand large grain sizes. Independant fits to the HST/NICMOS image yield a narrower ring, however, 17 AU. These discrepancies suggest that the outer ring has more than one component, and that it might be better approximated as two rings, each with a different characteristic grain size.


| 24.5m | 20.8m | 12.5m | 1.1m | SED | total | |
|---|---|---|---|---|---|---|
| No. data pts. | 13 | 12 | 12 | 53 | 16 | 106 |
| 2-comp | 13 | 15 | 14 | 53 | 15 | 110 |
| 1-comp | 19 | 16 | 22 | 70 | 27 | 154 |
Comparisons of the 2-component outer-ring model with the single-outer-ring model and data are shown in Figs. 5, 6 & 7. The entire SED from the best-fit 2-component model is shown in Fig.8. In all cases significant improvements are evident. However, for a more robust quantitative analysis of which model is preferred, we can employ the Bayesian Information Criteria () (Liddle 2004; Mukherjee et al. 1998; Jeffreys 1961). This is a model selection criteria which penalizes models for having extra parameters: , where is the likelihood function , is the number of free parameters and is the number of data points. The model with the lower is preferred. A difference of 2 between s indicates positive evidence against the high- model, while a difference of 6 indicates strong evidence. The top row in Table. 2 shows the number of data points for each of the data sets (images and flux measuremtents). The next two rows show the unreduced s (rounded to the nearest integer) for each of the data sets from the two best-fit models. for the 1-comp model is , while for the 2-comp model is . From these numbers, the for the 1-component model is 196 and the for the 2-component model is 171. The magnitude of this difference provides strong evidence that a 2-component model is mandated by the data.
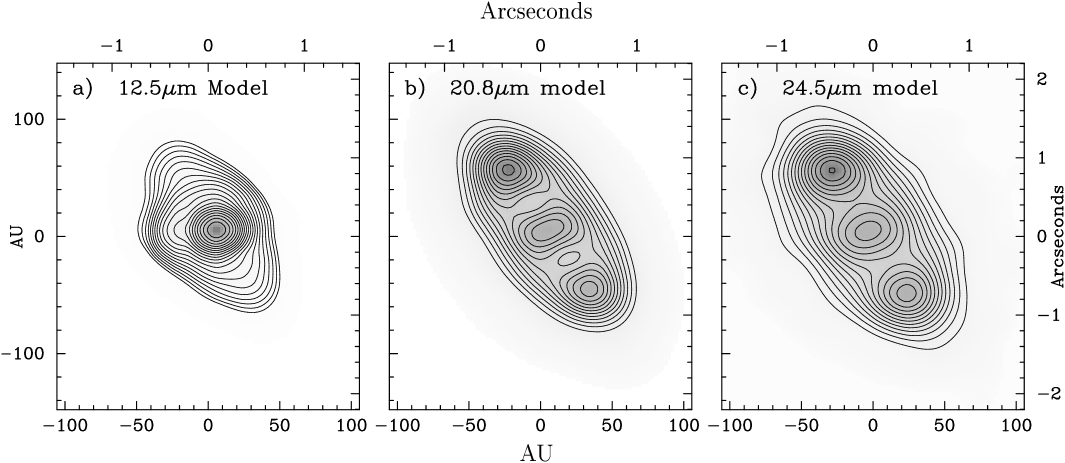
The best-fit model (2-component outer-ring) is shown at MIR wavelengths in Fig. 9. Single-ring best-fit parameters are: , , , m ( m), and albedo. Uncertainties were estimated through the Bayesian approach. The 2-component outer-ring model parameters are: , , m ( m), (implying a total cross-sectional area of 90 AU2) and albedo, , , , m ( m), (implying a total cross-sectional area of 245 AU2) and albedo, . The parameter was not used for either ring. The probability distributions, obtained by the Bayesian approach, for some of these parameters are shown in Fig. 10.
4. Discussion
Analysis of multi-wavelength HR 4796A images and flux densities yields a refined estimate of the properties of its circumstellar dust as follows. Radial structure of the outer ring is best approximated by two components: a narrow ring of 50 m grains between 66 and 80 AU and a surrounding wider ring of 7 m grains stretching from 45 AU to about 125 AU. The presence of excess emission at the stellar position is confirmed. It is unresolved by a 0.37” FWHM PSF (corresponding to a 12.5 AU radius at the 67 pc distance of HR 4796A) and has a temperature of 260 K. Bayesian parameter estimation suggests this dust is 4 AU from the star with a total grain cross-sectional area of 0.055 AU2.
4.1. Exozodiacal Dust
Evidence for warm exozodiacal dust was first identified for HD 98800 (Zuckerman & Becklin 1993). This K-dwarf quadruple system of two spectroscopic binaries (Torres et al. 1995) exhibits one of the strongest dust signatures of any in the IRAS catalog. Its infrared excess peaks at 25 m and is associated entirely with the northern spectroscopic binary, HD 98800 B (Koerner et al. 2000). Modeling of the spectral energy distribution of the dust suggests a ring of particles in the few-micron size range with an inner radius of a few AU and an outer radius that may stretch will into a giant-planet zone. Subsequent detections of warm excess from the main-sequence A3 star, Leporis, have also been intepreted as orginating from collision in an asteroid belt (Chen & Jura 2001).
The origin of a warm component to circumstellar dust around HR 4796A may be similar to that of our own Solar System. Zodiacal dust is supplied predominantly by the asteroid belt, Jupiter Family comets (JFCs), long-period comets, and perhaps by dust from the Kuiper-belt and the Oort Cloud (Flynn 1994, Dermott et al. 1992, Durda & Dermott 1992, Liou & Dermott 1993). At 1 AU, about 45% of the dust in the ecliptic plane is believed to come from the asteroid belt and JFCs. Within a sphere of radius 1 AU, however, 89% of the dust is from comets. The fractional surface density of zodiacal dust grains is (Hahn et al. 2002) with grain sizes as large as 100 m (Grogan et al. 2001).
An asteroid belt may be the source of exozodiacal dust grains around HR 4796A. Their total grain cross-section of and effective grain size of 28 m yields a minimum mass of , under the assumption that the grain density is given by =2500 (Jura 1998). Ice sublimation occurs instantaneously at 4 AU from the star (Isobe 1970), so these grains are almost certainly refractory. The blow-out size due to radiation pressure is 7 m (calculated according to Backman & Paresce 1993, Gustafson 1994) and indicates this is not an effective dispersal mechanism for the grains we detect. Due to relatively high fractional surface density ( = 0.0046), the collisional lifetime is shorter than the Poynting-Robertson lifetime even at 4 AU. Grains are primarily being destroyed by collisions, but probably also originate in a cascade of collisions from larger bodies. Assuming a grain size distribution, , and 1000 km planetesimals for the largest bodies, the total mass of orbiting material is 0.6 .
Another possible source for HR 4796A’s exozodiacal dust is a more distant asteroid or exo-Kuiper belt. Grains may spiral in toward the star under the influence of Poynting-Robertson drag but be trapped by resonant interactions with terrestrial planets. The dust may come only from more tenuous parts of the disk where collisional destruction is not the dominant dispersal phenomenon. For our Solar System, however, Liou et al. (1996) showed that Kuiper belt grains in the range 9 to 50 m are unlikely to survive collisions with interstellar grains (as opposed to interplanetary grains) on their way to the Sun, and 80% of all migrating grains are likely to be thrown out of the Solar System by interactions with the giant planets. However dust can be trapped in planets interior to an asteroid belt, and in these cases grains roughly 30 m or greater in size seem to be the best candidates (Jackson & Zook 1992). Large asteroid grains can even be injected into interior resonances with exterior planets due to the initial outward thrust of radiation pressure upon release from a parent body. As they leave these resonances they usually have lower eccentricities and orbital inclinations that render them susceptible to capture in resonant orbits with interior planets.
Comets that travel close to the star may provide a source of exozodiacal dust grains around HR 4796A. The cometary component of zodiacal dust is thought to be highly variable according to simulations done by Napier 2000 and may increase the dust creation rate from a 100 to 1000 fold within periods of 100,000 to 10,000 yrs. Particles that are most likely to be trapped in our own Solar System have sizes between 10 and 100 m (Jackson & Zook 1992). Dust with low eccentricities and low orbital inclinations are again more likely to be captured in resonant orbits. It should be noted that while the radiation pressure blow-out size for the Solar System is roughly 0.9 m, it is 7 m for HR 4796A. The optical depth of the zodiacal dust at 25 m is roughly when measured along the ecliptic (Spiesman et al. 1995). For HR 4796A, assuming similar dust dispersal times scales, this would imply a dust production rate roughly times higher than expected for the Solar Sytem. Grain velocities also differ in the two systems. Thus it is best to undertake system-specific simulations before speculating too much about the origin of exozodiacal dust grains. Regardless of origin, the main explanation for the persistence of dust in the exozodiacal region is probably resonance trapping by interior planets as found in the Solar System.
4.2. Properties of HR 4796A’s Outer Ring
A cold, massive outer ring of dust particles is more readily detected around stars other than the Sun. Examples other than HR 4796A include Fomalhaut (Holland et al. 1998); Eri (Greaves et al. 1998), and Vega (Holland et al. 1998; Koerner et al. 2001; Wilner et al. 2002). However, such a structure is more difficult to detect in our own Solar System where confusion from the inner zodiacal dust interferes with emission from outer dust grains (Backman et al. 1998). The discovery of a sizeable aggregation of Kuiper Belt Objects (see review by Luu & Jewitt 2002) implies an associated population of dust grains (Backman et al. 1995). Larger grains are likely to be better retained in the Kuiper Belt region by mean motion resonances while smaller grains diffuse under the influences of P-R drag, solar-wind drag, and radiation pressure (Holmes et al. 2003).
The HST/NICMOS image of HR 4796A at 1.1 m establishes that most of the scattered light around HR 4796A arises within a 17 AU ring centered at 70 AU (S99). A wider low-density component is also needed to fit Keck/MIRLIN images of thermal emission. The spectral energy distribution can be fit by a single narrow ring, but only if the large-grain contribution to the size distribution is boosted significantly. LL03 used to do this, but their models fail to match the surface brightness distribution in thermal infrared images. Inclusion of two distinct effective grain sizes resolves an apparent inconsistency in the interpretation of different data sets. Thermal infrared images modeled by T00 required small grains ( 3 m), but a fit by K98 that included an upper limit to the flux density at 800 m required the presence of large grains ( 30 m) to fit the Rayleigh-Jeans side of the SED. The latter result is confirmed here by fits which include more recent detections of emission at 450 and 800 m (Holland et al. 1998) and a new measurement at 350 m. A two-part ring with separate grain-size distributions is necessary to reproduce observations at all wavelengths.
Properties derived here for HR 4796A’s outer ring are consistent with theoretical predictions for both our Solar System’s outer dust and for exo-Kuiper grains in general. The collision of large planetesimals is expected to produce a cascade of smaller-sized particles with number distribution (Dohnanyi 1969). Subsequent grain evolution is affected largely by radiation pressure; Poynting-Robertson drag is a relatively small effect. Radiation pressure effects can be parametrized by :
where is grain diameter in ms, and is grain density in SI units (Gustafson 1994, W99). Appropriate values for HR 4796A are = 2.5 (Jura 1998) and =2500 and yield . Large particles with correspond to and will remain in original orbits close to parent bodies. Grains in the size range 35 m 7 m are critical with values . These experience orbital evolution which extends their distribution both inwards and outwards. The smallest grains ( m and ) have been called “ meteoroids” and are blown out of the system on hyperbolic orbits.
This picture of grain evolution provides a natural explanation for the properties of the outer ring around HR 4796A. In this scenario, a large-grain ring centers on a system of planetesimals surrounded by an outer region of smaller grains diffused under the influence of radiation pressure. Large grains in the narrow ring have , m or 50 m in our model, so they stay close to parent bodies. Smaller grains are “ critical” or “ meteoroids,” since their size is so close to 7 m ( 6.6 m) threshold. However, “ critical” is more likely, since “ meteoroids” have a “blow-out” lifetime of order 100 yrs, while “ critical” dust has a collisional lifetime of order 1000 yrs. This idea is supported by comparison with expected size distributions. The large- and small-grain populations have a diameter ratio of about 7:1 and cross-sectional areas for small grains and for large grains. So the number of grains is approximately in the ratio 20:1 for small:large grains. In contrast, the initial ratio for a collisionally generated size distribution should be . This underabundance of small grains agrees well with the hypothesis that many “ meteoroids” have already left the system.
4.3. Furthur Work
The modeling approach presented in this work was designed to determine the simplest disk morphology required by observations with a minimum number of underlying assumptions. The resulting dust distribution suggests significant physical interpretations. These should be tested with a more complex analysis that uses a more realistic representation of dust grain properties, including physically meaningful size distributions and plausible assumptions about grain composition. The latter should, in turn, be coupled to models that simulate the dynamical evolution of dust grains under the influence of planetary bodies in the HR 4796A system.
Further progress in observing HR 4796A’s radial dust distribution will be difficult until a next generation of large-aperture telescopes comes on line, since Keck/MIRLIN images are already close to the diffraction limit of a 10-m telescope. ALMA may provide sub-millimeter images with resolution improved by a factor of 5. The next generation telescopes like the 30 meter “Giant Segmented Mirror Telescope”, the “Thirty Meter Telescope” and the 100 meter “Overwhelmingly Large Telescope” will have also improved resolution and greatly enhanced sensitivity, and high-dynamic range techniques that are designed to search for planets may provide more detail on reflected light. Meanwhile, progress in observations of exozodiacal and exo-Kuiper dust configurations, may be better advanced by studying systems that are closer than the 67 pc distance to HR 4796A. The enhanced sensitivity of Spitzer Space Telescope will identify nearby debris-disk systems for which spatial resolution will be improved. Nulling interferometers (Keck and LBT) will also bring enhanced capability to study their inner dust regions. Ultimately, coordinated planet searches will be able to verify the relationship between circumstellar dust signatures and the presence of a planetary system.
Portions of this work were carried out at the Jet Propulsion Laboratory, operated by the California Institute of Technology under a contract with NASA. Data presented herein were obtained at the W.M. Keck Observatory, which is operated as a scientific partnership among the California Institute of Technology, the University of California and the National Aeronautics and Space Administration. The Observatory was made possible by the generous financial support of the W.M. Keck Foundation. The authors wish also to recognize and acknowledge the very significant cultural role and reverence that the summit of Mauna Kea has always had within the indigenous Hawaiian community. We are most fortunate to have the opportunity to conduct observations from this mountain.
References
- (1)
- (2) Artymowicz, P., Burrows, C., Paresce, F. 1989, ApJ, 337, 494
- (3) Augereau, J.C., Lagrange, A.M., Mouillet, D., M nard, F. 1999, A&A, 350, 51
- (4) Backman, D.E., Gillett, F.C., & Witteborn, F.C., 1992,ApJ, 385, 670
- (5) Backman, D.E., & Paresce, F., 1993, in Protostars & Planets III, (ed. E.H. Levy & J.I. Lunine), Tucson: University of Arizona Press, p. 1253
- (6) Backman, D.E., Dasgupta, A. & Stencel, R.E. 1995, ApJ, 450, 35
- (7) Backman, D.E., Caroff, L.D., Sandford, S.A., Wooden, D.H. 1998, Exozodiacal Dust Workshop; Conference Proceedings, (NASA Ames Research Center)
- (8) Chen, C. H. & Jura, M. 2001, ApJ, 560, 171
- (9) Fajardo-Acosta, S.B., Telesco, C.M., Knacke, R.F. 1998, AJ, 115, 2101
- (10) Dermott, S.F., Jayaraman, S., Xu, Y.L., Gustafson, B.A.S., Liou, J.C 1994, Nature, 369, 719
- (11) Dermott, Stanley F., Durda, Daniel D., Gustafson, Bo A. S., Jayaraman, S., Xu, Y. L., Gomes, R. S., Nicholson, P. D., In Lunar and Planetary Inst., Asteroids, Comets, Meteors 1991, 153
- (12) Diner, D.J. & Appleby, J.F. 1986, Nature, 322, 436
- (13) Durda, D.D., Dermott, S.F., American Astronomical Society, 24th DPS Meeting, 11.04, Bulletin of the American Astronomical Society, 24, 951
- (14) Dohnanyi, J., 1969, J. Geophys. Res., 74, 2531
- (15) Flynn, Abstracts of the 25th Lunar and Planetary Science Conference, 1994., p.379
- (16) Greaves, J.S., Holland, W.S., Moriarty-Schieven, G., Jenness, T., Dent, W.R.F., Zuckerman, B., McCarthy, C., Webb, R.A., Butner, H.M., Gear, W.K. & Walker, H.J. 1998, ApJ, 506, 133
- (17) Greenberg, J.M., 1979, Infrared Astronomy, Proceedings of NATO Advanced Study Institute, ed. G. Setti & G.G.Fazio (Dordrecht:Reidel), 51
- (18) Gillett, F.C. 1986, Light on dark matter, Proceedings of the First Infra-Red Astronomical Satellite Conference, Noordwijk, Netherlands, June 10-14, 1985 (A87-11851 02-90). Dordrecht, D. Reidel Publishing Co., 61
- (19) Grogan, K., Dermott, S.F., Durda, D.D. 2001, Icarus, 152, 251
- (20) Gustafson, B.A.S. 1994, Annual Review Of Earth And Planetary Sciences, 22, 553
- (21) Hahn, J.M., Zook, H.A., Cooper, B., Sunkara, B. 2002, Icarus, 158, 360
- (22) Holland, W.S., Greaves, J.S., Zuckerman, B., Webb, R.A.,McCarthy, C., Couldon, I.M., Walther, D.M., Dent, W.R.F.,Gear, W.K., & Robson, I., 1998, Nature, 382, 788
- (23) Holland, W. S., Robson, E. I., Gear, W. K., Cunningham, C. R., Lightfoot, J. F., Jenness, T., Ivison, R. J., Stevens, J. A., Ade, P. A. R., Griffin, M. J., Duncan, W. D., Murphy, J. A., Naylor, D. A.1999 MNRAS, 303, 659
- (24) Holmes et al. 2003, ApJ, 597, 1211
- (25) Houk, N.; Sowell, J. 1985, BAAS, 17, 878
- (26) Isobe, S. 1970, Publications of the Astronomical Society of Japan, 22, 429
- (27) Jackson, A.A., Zook, H.A. 1992, Icarus, 97, 70
- (28) Jayawardhana, R., Fisher, S., Hartmann, L., Telesco, C., Pina, R. & Giovanni, F. 1998, ApJ, 503, L79
- (29) Jeffreys H. 1961, Theory of probability, 3rd ed., Oxford University Press
- (30) Jura, M., Zuckerman, B., Becklin, E.E., & Smith, R.C. 1993, ApJ, 418, L37
- (31) Jura, M., Ghez, A.M., White, R. J., McCarthy, D.W., Smith, R.C., & Martin, P.G., 1995, ApJ, 445, 451
- (32) Jura, M., Malkan, M., White, R., Telesco, C., Pena & Fisher, R.S. 1998, ApJ, 505, 897
- (33) Koerner, D.W., Ressler, M.E., Werner, M.W., & Backman, D.E.,1998, ApJ, 503, L83
- (34) Koerner, D.W., Jensen, E.L.N., Cruz, K.L., Guild, T.B. & Gultekin, K. 2000, ApJ, 533, L37
- (35) Koerner, D.W., Sargent, A.I. & Ostroff, N.A. 2001, ApJ, 560, L181
- (36) Kurucz, R. 1993, ATLAS9 Stellar Atmosphere Programs and 2 km/s grid. Kurucz CD-ROM No. 13. Cambridge, Mass.: Smithsonian Astrophysical Observatory.
- (37) Lagage, P.O., & Pantin, E., 1994, Nature, 369, 628
- (38) Lay, O.P., Carlstrom, J.E., & Hills, R.E. 1997,ApJ, 489, 917
- (39) Li, Aigen & Lunine, J. I. 2003, ApJ, 590, 368
- (40) Liddle, A.R. 2004, astro-ph/0401198
- (41) Liou, J-C., Dermott, S. F., Abstracts for the IAU Symposium 160: Asteroids, Comets, Meteors 1993, 1993, p.191
- (42) Liou, J-C, Zook, H.A., Dermott, S.F. 1996, Icarus, 124, 429
- (43) Luu, J.X. & Jewitt, D.C. 2002, Annual Review of Astronomy and Astrophysics, 40, 63
- (44) Mukherjee, S., Fiegelson, E.D., Babu, G.J., Murtagh, F., Fraley, C., Raftery, A. 1998, ApJ, 508, 314
- (45) Nakano, T. 1988, MNRAS, 230, 551
- (46) Napier, W.M. 2000, MNRAS, 321, 463
- (47) Ressler, M.E., Werner, M.W.; Van Cleve, J., Chou, H.A. 1994, Experimental Astronomy, 3, 277
- (48) Schneider, G., Smith, B.A., Becklin, E.E., Koerner, D.W., Meier, R., Hines, D.C., Lowrance, P.J., Terrile, R.J., Thompson, R.I., Rieke, M. 1999, ApJ, 513, 127
- (49) Sitko, M.L., Lynch, D.K., Russell, R.W. 2000, AJ, 120, 2609
- (50) Spiesman, W.J., Hauser, M.G., Kelsall, T., Lisse, C.M., Moseley, S.H, Jr., Reach, W.T., Silverberg, R.F., Stemwedel, S.W., Weiland, J.L. 1995, ApJ, 442, 662
- (51) Stauffer, J.R., Hartmann, L.W., Barrado y Navascues, D. 1995, ApJ, 454, 910
- (52) Telesco, C.M., Fisher, R.S., Pi a, R.K., Knacke, R.F., Dermott, S.F., Wyatt, M.C., Grogan, K., Holmes, E.K., Ghez, A.M., Prato, L., Hartmann, L.W., & Jayawardhana, R. 2000, ApJ, 530, 329
- (53) Torres, C.A.O., Quast,G., de La Reza, R., Gregorio-Hetem,J., Lepine, J.R.D. 1995, AJ, 109, 2146
- (54) Wahhaj, Z., Koerner, D. W., Ressler, M. E., Werner, M. W., Backman, D. E., Sargent, A. I. 2003, ApJ, 584, 27
- (55) Weinberger, A.J., Becklin, E.E., Schneider, G., Smith, B.A., Lowrance, P.J., Silverstone, M.D., Zuckerman, B. & Terrile, R.J. 1999, ApJ, 525, L53
- (56) Weinberger, A.J., Becklin, E.E., Zuckerman, B. 2003, ApJ, 584, 33
- (57) Wilner, D.J., Holman, M.J., Kuchner, M.J., Ho, P.T.P. 2002, 569, 115
- (58) Wyatt, M.C., Dermott, S.F., Telesco, C.M., Fisher, R.S., Grogan, K., Holmes, E.K., & Piña, R.K. 1999, ApJ, 527, 918
- (59) Zuckerman, B., & Becklin, E.E., 1993, ApJ, 406, L25