Extending and Exploring the 2 cm Survey Sample
Abstract
We present new results from the VLBA 2 cm Survey, an imaging survey of active galactic nuclei (AGN) at sub-milliarcsecond resolution. We extend the structural variability monitoring program of more than 130 extragalactic parsec-scale radio jets from over 170 AGN to a total of eight years. The sample is explored further in time for all sources, and intensively for individual objects. We report new detailed results on the compact sources III Zw 2, AO 0235+16, and NRAO 512.
1 Introduction
Over the last decade we have used the Very Long Baseline
Array
(VLBA) at 15 GHz to image the structure of more than 170 active
galactic nuclei (AGN). This large collaboration is known as the “2 cm Survey”.
Most of the sources show a core-jet morphology with typical jet
structures (e.g., Zensus [1997]).
The 2 cm Survey aims to study the jet kinematics in AGN to better
understand the processes involved in the formation and evolution
of powerful jets.
The first images of 132 sources, selected from data taken
between August 1994 and October 1996, were
presented by Kellermann et al. ([1998]). An additional
39 sources were presented by Zensus et al. ([2002]), from
data collected from August 1997 to March 2001.
Many of the jets may be described by a small number of apparently
discrete features, which are generally called components.
Kellermann et al. ([2004]) reported the sky motions over
the above mentioned time lapse
of 208 components in 110 AGN from the sample.
We have made all the survey images available
on the Internet
under http://www.nrao.edu/2cmsurvey.
We continued adding new observations
from October 2001 to October 2002. We also included data
from other survey projects
in our kinematic analysis,
such as the pre-VSOP observations from L. I. Gurvits et al. (in prep.), the S5 Polar Cap Sample observations
by Pérez-Torres et al. ([2004]), and the
observations from GHz-peaked-spectrum radio sources by
Stanghellini et al. ([2001]).
To continue beyond the observations reported here, we have
assembled a complete flux-density limited sub-sample from the full
2 cm VLBA survey. The selection criteria are described in
Kellermann et al. ([2004]). Observations
of the complete sample are being continued since May 2001, under the name of
“Monitoring of
Jets in AGN with
VLBA Experiments (MOJAVE)”, see
http://www.physics.purdue.edu/astro/MOJAVE/.
This program includes also dual polarisation observations.
In this contribution we present results based on the 2001–2002 observations, which turn out to be complementary to the previously published ones.
2 Kinematics
The survey observations reported so far (Kellermann et al. [1998]; Zensus et al. [2002]; Kellermann et al. [2004]) included 29 observing sessions. We added 18 observing sessions with typically eight sources per session, where each source was observed once per hour for 6 min to 8 min over a range of 8 h in hour angle. The data reduction procedures for imaging, component identification and measurement of its position, combining difmap and tasks, are described in Kellermann et al. ([1998]; [2004]). Our additional data allowed us to analyse the kinematics of 41 components in 19 sources. The measured positions and speeds are presented in Fig. 1 and tabulated column 5 of Table 1. In some cases, when the jet features were not well resolved, or in other peculiar cases, we performed a fit to the visibilities using Gaussian functions. In this case, we have marked an asterisk at the name of the sources in Fig. 1.
|
-
a
Optical classification according to the Véron-Cetty & Véron ([2001]) catalog, where Q = quasar and G = galaxy.
-
b
To compute the linear speed, and throughout the paper we use a cosmology with km s-1 Mpc-1, , and .
-
c
Extrapolated epoch of origin.
-
d
Includes data from the S5 Polar Cap Sample (Pérez-Torres et al. [2004]).
-
e
Includes data from the pre-VSOP observations by L. I. Gurvits et al. (in prep.).
-
f
Includes data from observations taken in April 1996 on Gigahertz-peaked sources and published by Stanghellini et al. ([2001]).

|
-
a
Optical classification according to the Véron-Cetty & Véron ([2001]) catalog, where Q = quasar, B = BL Lac object, and G = galaxy.
-
b
Belonging to the complete sub-sample (MOJAVE, observed from May 2002 on).
-
c
A detailed study of the relative motions within the sub-images A and B and between them will be presented elsewhere.
-
d
Includes data from the pre-VSOP observations by L. I. Gurvits et al. (in prep.).
-
e
Includes data from the S5 Polar Cap Sample (Pérez-Torres et al. [2004]).
Apart from the 110 sources reported in Kellermann et al. ([2004]) and the 19 ones in this paper, some objects remain without kinematic analysis. Those objects are listed in Table 2. From the remaining objects, some of them have such a structure that prevents a reliable analysis (e.g., 0521365 hosts a long jet and the low declination makes mapping and model fitting to be difficult). A fraction of the objects have a parsec-scale jet where kinematics can be measured, but only two observing epochs have been observed so far. Some of those1110119+115, 1504167, 1741038 (OT 068), and 2155152 (OX 192). are being monitored at the MOJAVE program, and therefore reliable kinematics will be available in the near future. The rest2220108+388 (OC +314), 0201+113 (OD +101), 0405385, 0723008 (OJ +039), 0859+470 (4C +74.29), 1511100 (OR 118), 1514241 (AP Librae), and 2255282. are not being observed further, so unless alternative observations become available, no kinematic study using more than the existing two epochs will be possible. Finally, the objects not categorised above are compact, and some detailed -model fitting can eventually reveal changes in the structure, but higher frequency observations should provide the final answer on their kinematics.
The complete set of kinematics for the 110 sources reported in Kellermann et al. ([2004]) and the newer ones, together with an analysis of the component motions and the flux density evolution in selected cases will be reported in Ros et al. (in prep.).
3 Compact, but slightly resolved sources
We have reported in detail in Sect. 2 the kinematics of the sources with a core-jet morphology. In our sample we also find many compact objects. A careful look to these objects may yield surprises, since not all of them are unresolved. Here we show three typical cases of this kind. An analysis of the fine scale structure based on the interferometric visibilities is presented in Y. Y. Kovalev et al. (in prep.).
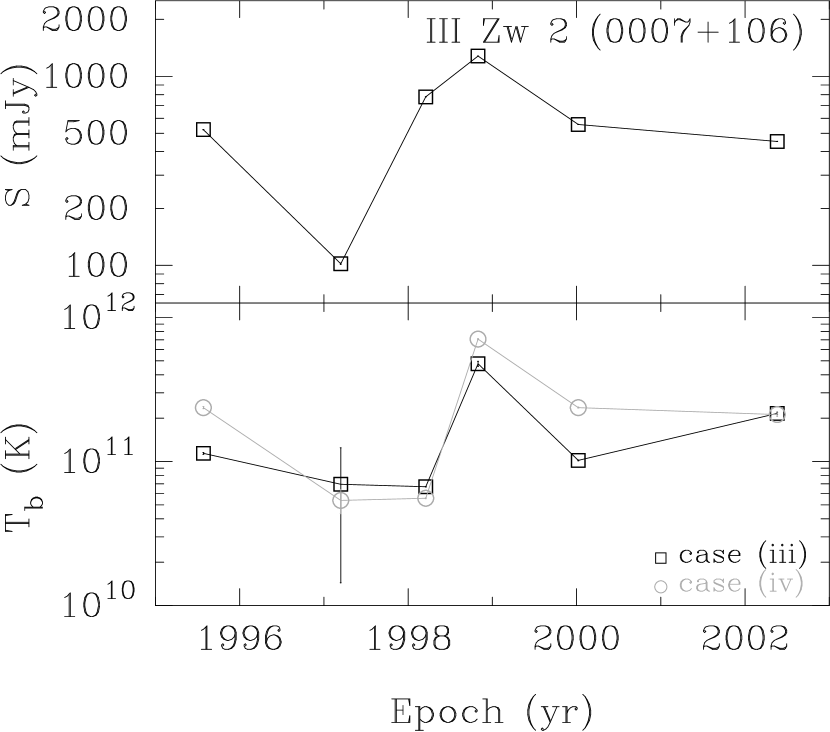
III Zw 2 (0007+106)—cracking the nut ?
The first panel in Fig. 1 reports the proper motions III Zw 2 derived from a model fitting of the interferometric visibilities using two circular Gaussian components—case (i); the use of two delta distributions (case (ii)) yields equivalent results. This Seyfert 1 galaxy, also classified as “radio intermediate quasar”, is highly variable, and a radio flare (Falcke et al. [1999]) happened in the course of our VLBI monitoring, at epoch 1998.8. Brunthaler et al. ([2003]) analysed the structure of the radio source at 15 GHz model fitting the visibilities with two point components in nine epochs from 1998.2 to 2000.7. Their data show a constant change in the separation of the components with speeds of . A direct comparison of their results and our plot show discrepancies, since our model at epoch 1998.21 shows a larger component separation. although our 1998.83 and 2002.02 data points are compatible with their measurements. A further approach to understand the changes in the source is to model fit its structure with a single circular (case (iii)) or elliptical (axis ratio 0.4, case (iv)) Gaussian component. The flux densities and the corresponding brightness temperatures are shown in Fig. 2. Notice that the brightness temperature was stable while the flux density was rising, and remained low at the highest state of the flare, becoming much higher in the post-flare phase and coming slowly back to the values of the rising phase at the last epoch. We can compare this result with the suggestions of Brunthaler et al. ([2003]) that the source can be explained with an “expanding balloon” model, say, “a radio galaxy in a nutshell”. Our comparatively low brightness density for the rising and peaking phase of the flare is in apparent contradiction with the interpretation of the 15 GHz data being the post-shock material from the hot-spots expanding in ultra-compact scales and interacting with the environment. In any case, we observe the same process of inflation and deflation in the source, but with a sparser time sampling and at only one frequency.
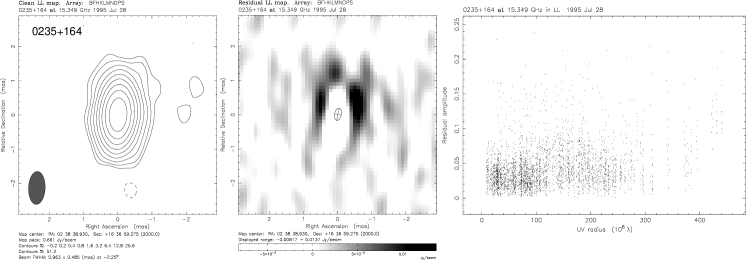
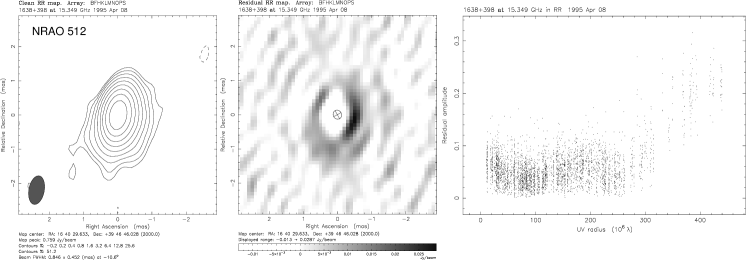
AO 0235+16 (0235+164) & NRAO 512 (1638+388)
Those two AGN show compact structure (left panel in Fig. 3) and flux density variability. The BL Lac object AO 0235+16 shows intra-day variability (Quirrenbach et al. [1992]; Kraus et al. [1999]) and recurrent outbursts with a period of yr (Raitieri et al. [2001]). It is well known that a very high brightness temperature component is present at milliarcsecond-scales (e.g., Frey et al. [2000]; Peng & de Bruyn [2004]). The quasar NRAO 512 shows unresolved structure at 8.4 GHz or 2.3 GHz (e.g., Fey & Charlot [2000]). For this reason, it has been traditionally used as a phase-reference calibrator for the neighbour source 3C 345 (e.g., Bartel et al. [1986]). The clean images shown at the left panels of Fig. 3 shows that both NRAO 512 and AO 0235+16 are compact objects but a detailed analysis shows that those are not unresolved. Figure 1 shows measured kinematics for NRAO 512 ussing a three-Gaussian model. The multi-epoch model fitting with three components appears consistent.
A rough analysis, presented in Figure 3, shows that a single Gaussian fit to the structure of those two objects does not adequately reproduce their structure. The mid panels show the residual maps after this fitting. The right panels show the residuals of this fit, and the discrepancy beyond 300 M is obvious, especially in the case of NRAO 512. A model with a clean component and an extended structure can better fit the data—a sort of “prussian hat”. An analysis of the change of the flux densities of both the ultra-compact and the extended component over time will be presented elsewhere. As in other examples, the ultra-compact component is needed to explain the intra-day variability (either if intrinsic or if caused by inter-stellar scattering), and the extended emission is related to a jet structure, that can be more or less weak, and face-on or slightly tilted and therefore present in the images.
The analysis of those sources and the rest of the 2 cm Survey will keep providing interesting results and shedding more light on the nature of the AGN in radio frequencies and its relationship with their properties in other wavebands (see, e.g., Kadler et al., these proceedings, concerning X-ray observations).
Acknowledgements.
This work has been made in collaboration with the 2 cm Survey Team, see http://www.nrao.edu/2cmsurvey. E. R. acknowledges the support of the European Commission’s I3 Programme “RADIONET”, under contract No. 505818 to attend the conference. The VLBA is operated by the National Radio Astronomy Observatory which is a facility of the National Science Foundation operated under cooperative agreement by Associated Universities Inc.References
- [1985] Aller, H. D., Aller, M. F., Lattimer, G. E., & Hodge, R. E. 1985, ApJS, 59, 513
- [1986] Bartel, N., Herring, T. A., Ratner, M. I., Shapiro, I. I., Corey, B. E. 1986, Nature, 319, 733
- [2003] Brunthaler, A., Falcke, H., Bower, G. C., et al. 2003, Pub. Astron. Soc. Aust., 20, 126
- [1999] Falcke, H., Bower, G. C., Lobanov, A. P., et al. 1999, ApJ, 514, L17
- [2000] Fey, A. L., & Charlot, P. 2000, ApJS, 128, 17
- [2000] Frey, S., Gurvits, L. I., Altschuler, D. R., et al. 2000, Pub. Astron. Soc. Jap., 52, 975
- [1998] Kellermann, K. I., Vermeulen, R. C., Zensus, J. A., & Cohen, M. H. C. 1998, AJ, 115, 1295
- [2004] Kellermann, K. I., Lister, M. L., Homan, D. C., et al. 2004, ApJ, 609, 539
- [1999] Kraus, A., Quirrenbach, A., Lobanov, A. P., et al. 1999, A&A, 344, 807
- [2004] Peng, B., & de Bruyn, A. G. 2004, ApJ, 610, 151
- [2004] Pérez-Torres, M. A., Marcaide, J. M., Guirado, J. C., & Ros, E. 2004, A&A, in press [arXiv:astro-ph/0408581]
- [1992] Quirrenbach, A., Witzel, A., Krichbaum, T. P., et al. 1992, A&A, 258,
- [2001] Raiteri, C. M., Villata, M., Aller, H. D., et al. 2001, A&A, 377, 396
- [2001] Stanghellini, C., Dallacasa, D., O’Dea, C. P., et al. 2001, A&A, 377, 377
- [2001] Véron-Cetty, M.-P., & Véron P. 2001, A&A, 374, 92
- [1997] Zensus, J. A. 1997, ARA&A, 35, 607
- [2002] Zensus, J. A., Ros, E., Kellermann, K. I., et al. 2002, AJ, 124, 662