The Discovery of Extended Thermal X-ray Emission from PKS 2152-699: Evidence for a ‘Jet-cloud’ Interaction
Abstract
A Chandra ACIS-S observation of PKS 2152-699 reveals thermal emission from a diffuse region around
the core and a hotspot located 10″ northeast from the core. This is the first detection of thermal
X-ray radiation on kiloparsec scales from an extragalactic radio source. Two other hotspots located
47″ north-northeast and 26″ southwest from the core were also detected. Using a Raymond-Smith model,
the first hotspot can be characterized with a thermal plasma temperature of 2.6 K and an electron
number density of 0.17 cm-3. These values correspond to a cooling time of about 1.6 yr. In
addition, an emission line from the hotspot, possibly Fe xxv, was detected at rest wavelength 10.04Å.
The thermal X-ray emission from the first hotspot is offset from the radio emission but is coincident
with optical filaments detected with broadband filters of HST/WFPC2. The best explanation for the X-ray, radio,
and optical emission is that of a ‘jet-cloud’ interaction.
The diffuse emission around the nucleus of PKS 2152-699 can be modeled as a thermal plasma with a
temperature of 1.2 K and a luminosity of 1.8 erg s-1. This emission appears
to be asymmetric with a small extension toward Hotspot A, similar to a jet. An optical hotspot (EELR) is seen
less than an arcsecond away from this extension in the direction of the core. This indicates that the
extension may be caused by the jet interacting with an inner ISM cloud, but entrainment of hot gas is
unavoidable. Future observations are discussed.
1 INTRODUCTION
Radio images have shown that jets of radio galaxies disperse on kiloparsec or megaparsec scales,
forming hotspots and lobes at the end of the jet’s path. The formation of these lobes is believed to be caused
by the interaction between a jet propagating through the interstellar or the intergalactic medium
(e.g., De Young, 2002). In principle, the jet may be deflected by a dense inhomogeneity in the ambient medium,
and past three-dimensional numerical simulations have examined the physics of this interaction
(De Young, 1991; Higgins et al., 1999; Wang et al., 2000).
When a jet interacts with the ambient medium, shocks are likely to form, producing extended emission
lines in the UV, optical, and X-rays through ionization of the medium (Tadhunter, 2002). Powerful radio
galaxies that may have undergone jet-cloud interactions that cause their extended emission-line regions (EELRs)
are 3C 277.3 (van Breugel et al., 1985; Tadhunter et al., 2000; Solórzano-Iñarrea & Tadhunter, 2003), 3C 265 (Solórzano-Iñarrea & Tadhunter, 2003), PKS 2250-41
(Villar-Martín et al., 1999), and PKS 2152-699 (Tingay et al., 1996; Fosbury et al., 1998).
PKS 2152-699, a well-studied Fanaroff-Riley type II radio galaxy (Fanaroff & Riley, 1974) at z = 0.0283, is
one of the brightest sources in the southern sky with a flux of 19 Jy at 2.7 GHz (Wall, 1994). In
addition, this source is quite isolated: the nearest galaxy is 250 kpc away and less than 50 galaxies are within
a 3 Mpc radius (Tadhunter et al., 1988). Previously, Tadhunter et al. (1988), Tingay et al. (1996), and Fosbury et al. (1998) have
suggested that the deflection of the northern jet is conceivably caused by a ‘jet-cloud’ interaction. For
example, radio observations obtained from the Australia Telescope Compact Array (ATCA) reveal a hotspot
(hereafter Hotspot A) located about 10″ north-east from the core. The detection of the northern lobe and
hotspot (hereafter Hotspot B) indicates a 20° deflection in the jet (Tingay et al., 1996; Fosbury et al., 1998). In this
paper, the analysis of archival data from the Chandra X-ray Observatory is presented as evidence for
a jet-cloud interaction occurring at Hotspot A and the extension near the core in PKS 2152-699.
In § 2, the X-ray observation will be presented and compared with previously obtained radio
and optical images. The analysis of X-ray spectra and the core’s point-spread function (PSF) are provided in
§ 3. In § 4, a jet-cloud interaction is presented to explain Hotspot A and the northeast, extended
thermal emission. § 5 will describe possible future observations, and concluding remarks will be made in
the final section.
2 OBSERVATIONS
2.1 Radio and Optical Observations
The ATCA was used by Fosbury et al. to observe PKS 2152-699 at 3.5 cm (8.64 GHz) on 1992 January 19 and at 6.3 cm (4.74 GHz) on 1992 April 1. In addition, a HST/WFPC2 observation (Proposal 5479, PI: M. Malkan) published in Fosbury et al. (1998) was obtained with the F606W filter on 1994 October 20. The reduced radio and optical images were provided by Fosbury et al.
2.2 X-ray Observation
PKS 2152-699 was observed (ObsID 1627, PI: A. Wilson) with the Chandra Advanced CCD Imaging
Spectrometer (ACIS-S)111Chandra Proposers’ Observatory Guide 2003: http://cxc.harvard.edu/proposer/POG/pdf/ACIS.pdf. without a transmission grating in place on 2001 August 2 for
approximately 14 ks. The level 1 products were obtained directly from the archive where they went through
the standard data processing with the afterglow correction removed (See § 3.3). In this observation, the
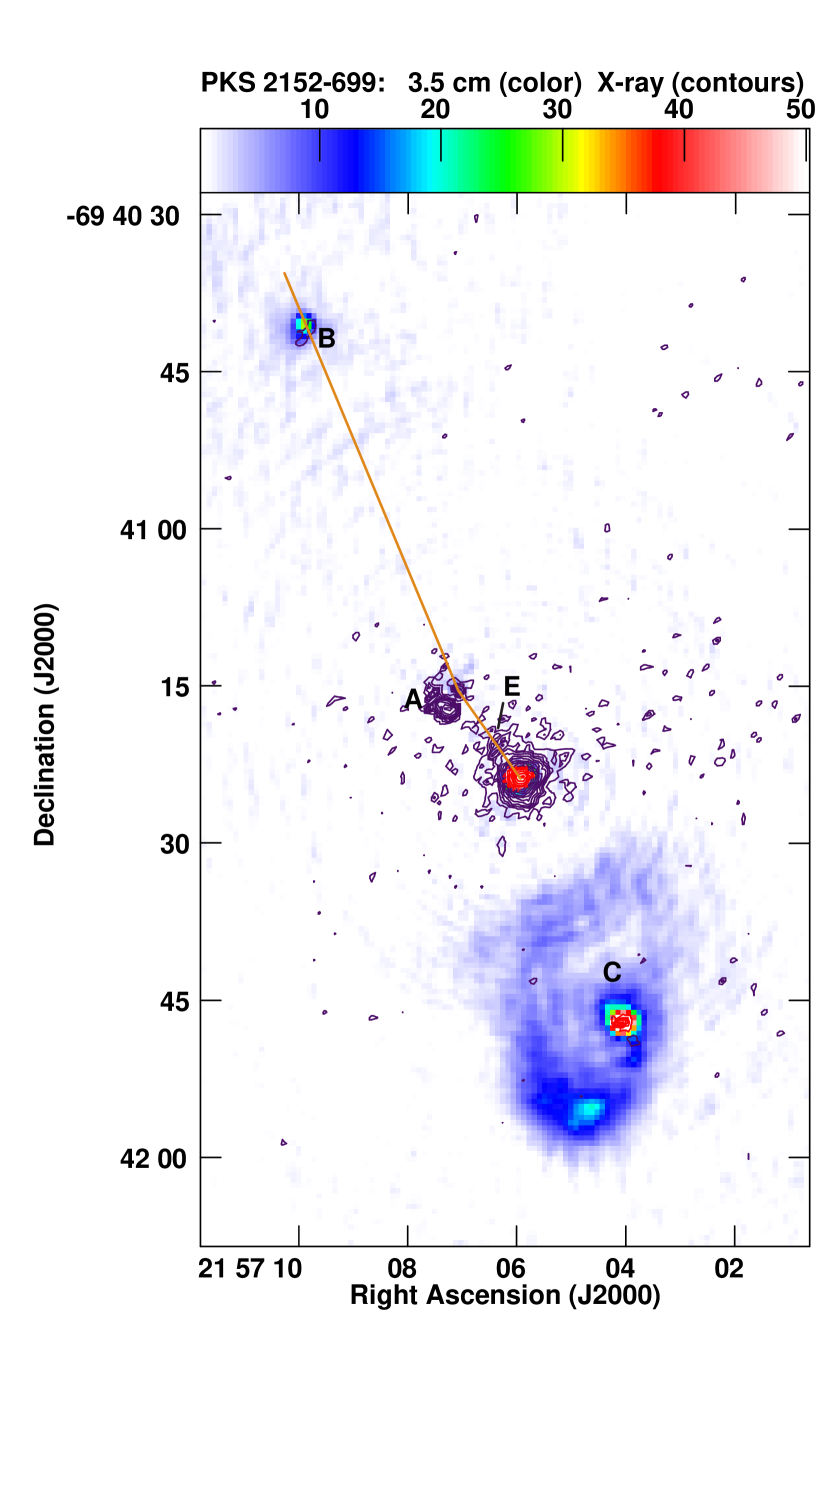
core with diffuse emission around it and three hotspots were detected, as shown by the contours in Figure 1.
The most prominent hotspot is located 10″ (5.6 kpc, PA 137°) from the core. One arc-second corresponds
to 0.56 kpc under the assumption that H∘ = 71 km s-1 Mpc-1, = 0.73, and
= 0.27 (Bennett et al., 2003). The other two hotspots, B and C, were detected
47″ (26.3 kpc, PA 116°) and 26″ (14.6 kpc, PA 292°) from the core.
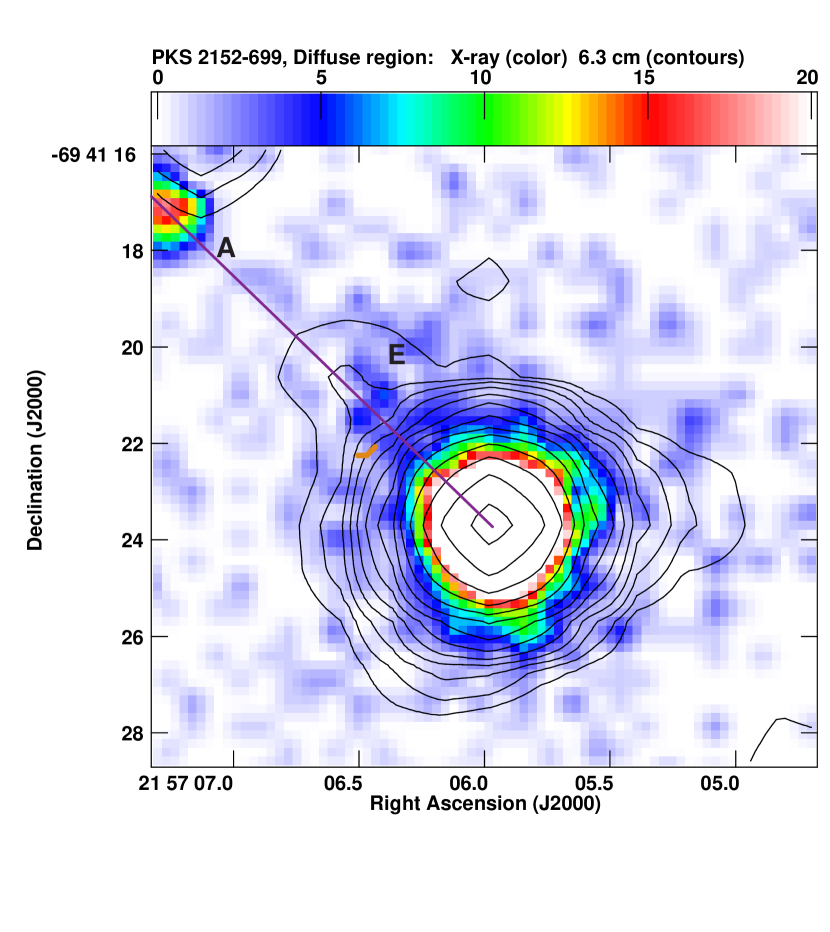
The X-ray contours in Figure 1 reveals that the diffuse emission is extended more toward the
northeast direction. This extension (labeled as E) is similar to a jet when it is compared to the 3.5 cm radio
jet as shown in Figure 2. The purple line shows that the radio jet propagates toward Hotspot A’s X-ray
emission. In addition, the diffuse emission extends in the east-west direction as noted by the low-level contours
in Figure 1.
2.3 Positional Corrections in Images
Prior to overlaying these images, positional corrections relative to the International Celestial Reference Frame Extension 1 (ICRF-Ext.1) coordinates were made (Ma et al., 1998; IERS, 1999). The offsets (, ) in arc-seconds between the ICRF-Ext.1 coordinates with the Chandra and HST coordinates are (0.1, -0.1) and (-1.4, -0.1), respectively. The radio observations had a correction of (-0.4, -0.3). The X-ray position agrees with surveys222In-Flight Calibration Observations: http://cxc.harvard.edu/cal/docs/cal_present_status.html. indicating an offset within 0.4″ relative to the ICRF-Ext.1, and the optical offsets are reasonable compared to the point inaccuracy of 0.26 to 1.84″ (Biretta et al., 1996). These images were imported into the Astronomical Image Processing System (AIPS) where the package HGEOM was used to geometrically align the images together.
2.4 Multi-wavelength Overlays
In Figure 1, an overlay between the X-ray image and 3.5 cm radio contours is shown. X-ray
emission from Hotspot B and C is coincident with those found in the radio images. Neither of these two hotspots
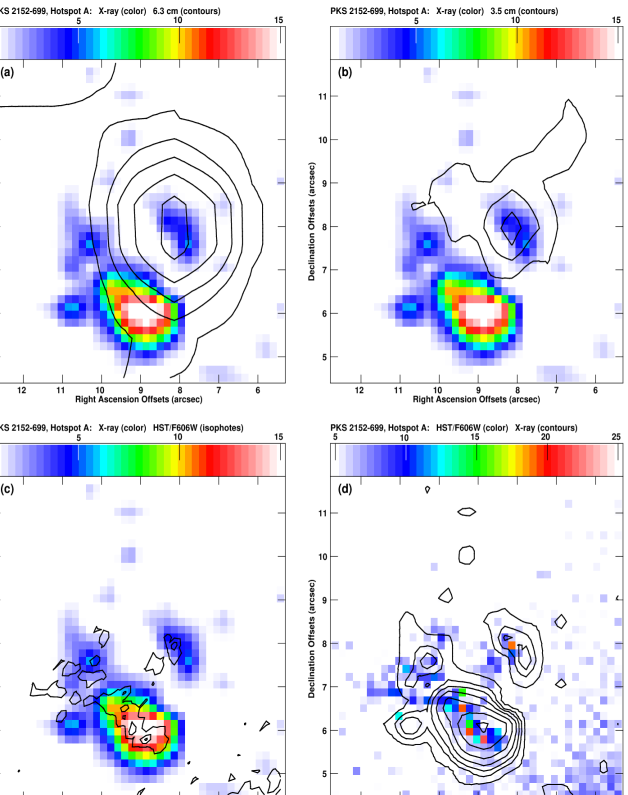
were within the HST/WFPC2 field-of-view. The overlays for Hotspot A between the X-ray image
with the radio contours and the HST isophotes are provided in Figures 3a-c, while Figure 3d
shows the X-ray contours on the HST image. In both radio observations, Hotspot A is offset 2 to 3″
from the X-ray hotspot, similar to what is seen for the case of the HST image (Fosbury et al., 1998). A
comparison between the optical and the X-ray image reveals an alignment for Hotspot A; however, some filaments
visible in the HST image are not seen in the X-ray image.
A careful examination of the HST image reveals an optical hotspot that is less than an arcsecond
away. The location is indicated by the orange line in Figure 2.
3 X-RAY ANALYSIS
The X-ray spectrum of Hotspot A, the diffuse region, and Extension E were analyzed using the
Chandra Interactive Analysis of Observations (CIAO v3.0.2)333See http://cxc.harvard.edu/ciao/.. For Hotspot B and C,
less than 40 counts were obtained, which is insufficient data to distinguish between thermal and non-thermal
emission processes. The source and background regions were selected, and the spectra of these regions were
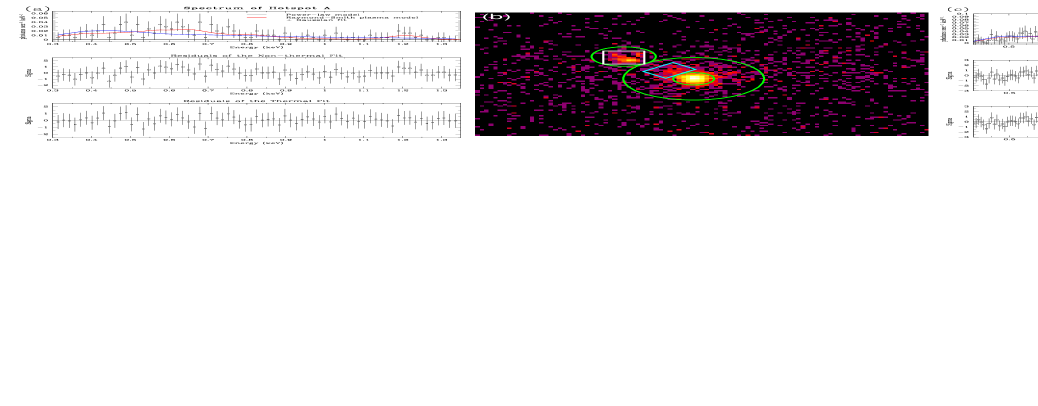
extracted using the acisspec script and imported into Sherpa for modeling. Hotspot A’s
extracted region is indicated in Figure 4b by the green circular outline that has a radius of
3.5″. The diffuse emission’s extracted region is identified by the green annulus that has an inner and
outer radius of 2.2″ and 7.6″, respectively. The cyan rectangular outline that is
4.5″3.4″ represents the extracted region of Extension E.
To obtain an appropriate background that avoids the diffuse region and the hotspots, four circular
(10″ in radius) regions that are approximately positioned 39 to 44″ north-west, west, south, and
north-east from the core were selected. The count rates per square arcsecond are
3.2 cts s-1 arcsec-2 for the background regions,
2.4 cts s-1 arcsec-2 for the diffuse region, 5.2 cts s-1 arcsec-2
for Hotspot A, and 6.5 cts s-1 arcsec-2 for Extension E. Uncertainties reported later
in this paper for the models’ parameters are 1 deviation, determined from the Sherpa task,
projection.
3.1 Hotspot A
Shown in Figure 4a is Hotspot A’s spectrum between 0.30 to 1.35 keV without redshift correction
but background subtracted. Initially, a non-thermal model (power-law with galactic absorption)
was tested, and the overall residuals indicated a poor fit. Plotted on the spectrum in blue is this non-thermal
model. The residuals are shown in the middle panel. The parameters for this power-law model are
= 2.60.4 with a normalization of (1.10.3) and a galactic neutral
hydrogen column density444Obtained from Colden on the Chandra Proposer page: http://cxc.harvard.edu/toolkit/colden.jsp. of 2.52 cm-2. The reduced chi-squared per
degrees of freedom is = 0.42.
Further analysis reveals that the Raymond-Smith model for a thermally ionized plasma is appropriate
between 0.3 to 1.0 keV. The temperature for this model is 0.22 keV ( K) with
a metal abundance of [Z/Z☉] = 0.10 and = 0.36. However, this model was
not able to explain a peak between 1.1 and 1.3 keV, so an additional Gaussian component was added to model an
emission line. Using the Sherpa package GUIDE for line identification, this emission was identified as
Fe xxv, although the uncertainties in the peak are large enough for other possible emission lines
(e.g., Fe19+, Ni19+). The error in the model, shown below the spectrum, fluctuates randomly
between 1.5 with a = 0.33.
The emission from Hotspot A is thermal based on the comparison between the residuals. Using the F-test
for a thermal model that excludes and includes the emission line, the significance is about 0.05, indicating
that the better model involves the emission line. Therefore, the best fit for the hotspot is
(rs+gauss) abs where rs is the XSpec Raymond-Smith
model (xsraymond), gauss is a simple one-dimensional normalized Gaussian model (ngauss1d) and
abs represents galactic absorption (xswabs). In Figure 4a, the red line plotted on the spectrum
is the best model with the residuals in the lowest panel.
3.2 Diffuse Region
The spectrum for the extended region is shown in Figure 4c between 0.3 to 2.6 keV. Once
again, a power-law fit was first attempted. This fit was reasonable for the tail of the spectrum between
1.2 to 2.6 keV, but a poor fit elsewhere since the peak in the fit is off from the source spectrum, and the
residuals have a “bump” profile between 0.5 to 1.2 keV. The parameters for this non-thermal model are
= 1.7 with a normalization of (3.80.3) and = 0.33.
Our second attempt was to consider a thermal bremsstrahlung model (xsbremss). The profile for
this model was similar to the power-law case and hence also a poor fit. This model yielded a goodness of fit of
= 0.30. The temperature obtained from this fit is 1.4 keV (1.6 K)
with C = 7.4. Here C = (3.02, where
is the distance to the source in cm, is the electron density in cm-3, and is the hydrogen
density in cm-3.
To improve the spectral modeling, the Raymond-Smith model was considered. This fit modeled the
data better than the two previous attempts for energies between 0.8 to 1.2 keV, had the lowest
, 0.28, and the residuals appear flatter. The temperature is keV
( K) with a metal abundance of [Z/Z☉] = 0.07 and a normalization C
of (2.10.4). Although all three models look similar in the top plot of Figure 4c,
the residuals of the thermal model indicate that the emission is thermal. Hence, rs abs
is the best model for the diffuse region.
The Raymond-Smith variable model (xsvraymond) was considered, and the temperature was similar to the
latter attempt. However, it yielded certain metal abundances that were significantly greater than solar
abundances with large uncertainties. Although 450 counts were obtained, additional data are needed to better
constrain individual metallicities.
Table 1 summarizes the best model for Hotspot A and the diffuse region with the non-thermal
attempts. The only parameters held fixed during modeling are the known redshift (in the case of rs)
and the galactic neutral hydrogen density. For the Gaussian model, only an upper limit on the FWHM exists, and
it is greater than the expected value.
3.3 Extension E and PSF Modeling
Extraction of the northeast extended emission within the diffuse region reveals similar thermal
properties as the entire diffuse region. Extension E has an ionized plasma temperature of 1.0 keV
( K) with an abundance [Z/Z☉] of 0.09.
Prior to extracting the PSF, the afterglow555See the “Remove the acis_detect_afterglow Corrections” thread at
http://cxc.harvard.edu/ciao/threads/acisdetectafterglow/ for more information. events were examined, and were not removed in
the final level 2 processing because most of these events were from the core (an additional 170 counts). PSF
modeling (using mkpsf) of the core at 1.5 keV indicates that the diffuse emission is real compared to the wings
of the core. The wings of the normalized PSF fell below one count beyond 2″ from the core, which is
within the inner radius of the annulus in Figure 4b.
3.4 Number Densities and Cooling Times
3.4.1 Hotspot A
The Raymond-Smith model for Hotspot A gives a total luminosity of 5.2 erg s-1 or 4.6 erg s-1 excluding the Gaussian model. Assuming that the thermal X-ray emission of Hotspot A is produced via shock-induced processes (See § 4.1.2), the post-shock temperature derived from the Rankine-Hugoniot conditions is
| (1) |
where is the shock velocity (Landau & Lifshitz, 1979). For a temperature of 2.6 K, the shock velocity is
480 km s-1. The kinetic energy flux from a shock is , where
is the area of the shock region. Assuming that the X-ray luminosity is half the kinetic energy flux and that the shock
region consists of the bright area in the X-ray image (Figure 3) of 1.3 kpc2, then the number
density is 0.17 cm-3.
The hotspot’s emission is projected over a rectangular region outlined in white in Figure 4b.
For a projected emitting region of 4.4″ 4.7″ (2.5 kpc 2.6 kpc) and assuming
a depth of 2 kpc, the emitting volume is 13.0 kpc3 and the power radiated per volume (LB) by the
ionized plasma (excluding the emission line) is 1.2 erg s-1 cm-3. The cooling time
for the plasma can be determined from the ratio of the power radiated per volume and the energy density:
| (2) |
For the numbers reported above, the cooling time for the plasma is approximately 1.6 yr.
3.4.2 Diffuse Region
With the plasma temperature and luminosity known for the region, the electron number density and the cooling time for the diffuse region can be determined. The power radiated per unit volume for a hot plasma is defined as
| (3) |
where () is the total cooling coefficient in units of erg cm3 s-1, and is the volume
of the emitting region. For a temperature of 107 K, is approximately
7 erg cm3 s-1 (Raymond, Cox, & Smith, 1976).
For the diffuse emission without the extension, assuming that the volume is spherically symmetric and
that the emitting region is projected onto the sky as an annulus, the volume is 305 kpc3. The luminosity
of the diffuse emission is 1.4 erg s-1. This implies a number density of 0.01 cm-3
and a cooling time of 5.1 yr.
The greatest uncertainty in our calculations is in the size of the emitting region. The emitting
region used in our calculation is (6.7 kpc)3. The proportionality between and with
the volume is
| (4) |
Thus, a factor of two in the volume will only decrease and increase by a factor of .
For the extended section of the diffuse emission (indicated by the cyan box), the emitting volume is
9.8 kpc3 when assuming that the depth is 2 kpc, and the luminosity is 3.2 erg s-1.
The number density then for the extended region in the diffuse emission is 0.04 cm-3 with a cooling time
of 1.8 yr.
3.4.3 Broad-band Flux Plot
Figure 5 reveals the broad-band flux (between radio to X-ray) for the north-western component of Hotspot A as seen in Figure 3. Radio, optical and X-ray emission overlap at this position. An additional measurement at 5472Å was reported by di Serego Alighieri et al. (1988). The upper limit infrared (IR) fluxes from IRAS observations were provided by Golombek, Miley, & Neugebauer (1988) at 12 and 100 m. PKS 2152-699 was detected at 25 and 60 m, but are not included in Figure 5 because the poor resolution of IRAS could not distinguish possible IR emission of Hotspot A from the core. The optical flux of the HST/F606W observation is primarily [O iii], [N ii], and H emission lines (Fosbury et al., 1998).
4 INTERPRETATION
4.1 Hotspot A
The thermally ionized volume of gas is located about 5.6 kpc from the nucleus of the parent galaxy (Fosbury et al., 1998), and there are two possible explanations that can account for the presence of X-ray emission at this distance. One explanation considers the possibility that hot material from the inner regions of the interstellar medium (ISM) is advected out to this location by the radio jet, and the other is the jet-cloud interaction mentioned above.
4.1.1 Entrainment from Inner Regions
The gas could have been entrained and heated from the dense ISM in the inner regions of the galaxy
by the outflowing jet. This process is virtually unavoidable over a wide variety of physical parameters
(e.g., De Young, 2002). If entrainment is to explain the X-ray emission from Hotspot A, then the cooling
time of the gas must be approximately equal to the transit time of the entrained material so that the
X-ray emission is visible only at the end of the entraining region.
However, the fact that no corresponding thermal X-ray emission is seen to the south requires special
arrangements to exist, presumably in the form of different conditions in the inner ISM for the north jet than
for its southern counterpart. In addition, in this picture the proximity of radio and X-ray emission at
Hotspot A must be regarded as fortuitous coincidence. These issues, together with the interpretation of the
diffuse X-ray emission near the nucleus in the direction of the radio jet (see § 4.2), lead us
to believe that the most plausible interpretation of the X-ray and radio morphology at Hotspot A is that of a
jet-cloud interaction.
4.1.2 ‘Jet-cloud’ Interaction
The thermal emission could arise from the interaction of the radio jet and a relatively dense cloud of
ambient gas located in the path of the oncoming jet. This latter possibility was suggested by Fosbury et al. (1998)
as a mechanism to explain both the optical emission lines in the inner cloud and the apparent misalignment
between the inner and outer northern radio hotspots. The mass of the cloud is 5.3 M☉, which
is reasonable for large clouds in the ISM (Young & Scoville, 1991). The mass could be even larger and still be within
conventional limits for giant clouds. The collapse time for this cloud due to its own self-gravity is
1.6 yr, an order of magnitude longer than the cooling time but much shorter than the age of the
parent galaxy.
A jet-cloud interaction can also explain both the presence of radio emission co-located with
the thermal X-ray emission as well as account for the misalignment. A grazing encounter between collimated
supersonic flow and a dense object will give rise to internal shocks in the flow as it is deflected away from
the massive object. These shocks will cause enhancements of both the relativistic particle and magnetic
field densities, and it will result in a significant brightening of the synchrotron radiation of the jet,
giving rise to a radio hotspot.
The interaction will also cause a shock to propagate into the cloud as it deflects the jet. This
shock-heated gas will cool rapidly in the high density cloud, emitting thermal X-rays and highly ionized
emission lines as seen in this Chandra observation. This hot, post-shock gas will reside in the
cloud and be adjacent to, but not exactly coincident with the jet. Thus the offset between the radio and
X-ray emission is naturally explained by this mechanism.
Furthermore, the geometry of this offset is also consistent with a 20° jet deflection. The
northernmost radio hotspot is offset to the west from a straight line between the nucleus and Hotspot A,
and its radio emission is also offset to the west from the X-ray emission. This is consistent with the
jet grazing the cloud on the west side, deflecting the jet to the west of the original radio-jet axis
(see Figure 1), and causing a shock to propagate into the interior of the cloud, most of which
lies east of the contact point (see Figure 3).
In addition, the shallow grazing incidence of the jet upon the cloud will produce a strong shock
propagating into the cloud. This interaction is consistent with the temperature derived here for the thermal
emission: T K as a post-shock temperature implies shock speeds of a few hundred km s-1,
which are very much less than the probable jet speed of over 1000 km s-1.
Numerical simulations of the interaction of the radio jets with dense clouds provide support for the
latter picture, though the parameters of these calculations may not fit the exact values required for the
case of PKS 2152-699. For example, Wang et al. (2000) consider interactions with very dense clouds, hundreds to
thousands of times the jet density, and find that jets tend to be destroyed or disrupted by very massive
clouds. Longer term deflections occur if the cloud-jet density ratios are less extreme and the Mach numbers
are not large (De Young, 1991; Higgins et al., 1999), though in some cases the cloud can be destroyed by the jet if the
cloud is sufficiently underdense or of small mass. Clouds of M☉ with densities of order
100 times the jet density can survive over years when deflecting jets with speeds in excess of
km s-1. Therefore, long-term jet deflection, especially for the small apparent deflection angles
seen here, can probably be produced from a combinations of reasonable jet speeds, jet-cloud density ratios,
and total cloud masses.
Although both the entrainment and deflection pictures are physically plausible, the north-south
asymmetry of the radio jets and the presence of thermal X-ray emission suggest that the simplest
interpretation may well be that the northern jet of PKS 2152-699 is slightly deflected by a massive
interstellar cloud, and this deflection is producing shock-heated gas in the cloud, which manifests itself
via the thermal X-ray emission reported in this paper.
4.2 Diffuse Emission
As discussed in the observational section, there is a faint X-ray extension of the diffuse emission
in the direction of the radio jet. This emission appears to be thermal rather than non-thermal,
and the temperature and metal abundance for this extension is the same as that of the rest of the diffuse
emission. The number density in this extension is roughly 0.04 cm-3, which is four times greater than
the diffuse emission as a whole. It appears that this X-ray emitting material in the extension could well
be the same hot gas as that around the galaxy that is giving rise to the overall diffuse X-ray emission.
A nearby optical hotspot is seen, and it may be that the extension is due to the same process as in
Hotspot A of a jet interacting with a dense cloud. However, since extended thermal emission (representable as
hot gas) is present next to the core, it is likely that the gas may also be extrained by the jet, tracing out
an extension.
To summarize, the radio morphology of the northern jet and the radio - X-ray misalignment for Hotspot A
would indicate a jet-cloud interaction. Moreover, thermal emission for Hotspot A is explained by shocks formed
in the clouds when this interaction occurs. This interaction may also be occurring at Extension E where the
optical image reveals an EELR.
5 FUTURE OBSERVATIONS
This 14 ks observation of PKS 2152-699 detected three hotspots and diffuse emission around the core.
Although this observation was sufficient to confirm thermal emission from Hotspot A, a longer observation is
needed to constrain its metallicity and to determine the ambiguous emission line at approximately 10Å.
Moreover, additional time will help distinguish whether thermal or non-thermal emission is detected in the
two farthest hotspots, and it will help understand the content of the inner ISM from improved modeling of the
diffuse region. Additional HST observations of Hotspot B and C are needed since the optical flux will
constrain the mechanisms for the detected X-ray emission.
Other sources that are believed to have undergone jet-cloud interactions should be investigated for
their X-ray emission properties. For example, radio and optical observations of Coma A (3C 277.3) have
indicated a jet-cloud interaction from the coincidence of the emission-line gas and its double-radio lobes
(van Breugel et al., 1985). There is also strong support for jet-cloud interactions for high redshift (z 0.6) radio
galaxies (Tadhunter, 2002, and references therein). However, these sources have larger redshifts compared to
PKS 2152-699, hence thermal emission may not be detected because these sources are more distant, and the
inverse-Comptonization of the CMB photons is more prominent.
6 CONCLUSION
From previous X-ray observations of extended emission from extragalactic radio sources, only non-thermal
processes, such as inverse-Compton, Synchrotron Self-Compton, and Synchrotron radiation, are believed to be the
cause of X-ray (and possibly optical) emission from kiloparsec or megaparsec hotspots and jets
(Harris & Krawczynski, 2002; Wilson, 2003). However, the X-ray observation of PKS 2152-699 contradicts accepted ideas about
X-ray emission mechanisms. This observation reveals that thermal processes are dominant for Hotspot A and a
diffuse region around the core with an extension (much like a jet). Spectral modeling of the
hotspot reveals a Raymond-Smith plasma of 2.6 K with an additional iron (or possibly nickel)
emission line. The diffuse region can also be modeled as a hot plasma of 1.2 K.
To explain the detection of thermal emission for Hotspot A, it is believed that a ‘jet-cloud’ interaction
is occurring at the site of Hotspot A. The deflection of the northern jet and hotspot and the offset
between radio and X-ray emission for Hotspot A are evidence to support such an interaction. Moreover, as the
jet collides with the cloud, shocks are likely to propagate into the cloud, thus heating it. As the cloud cools
rapidly, thermal X-rays, as reported in this paper, are emitted.
A comparison between the radio and X-ray images for the diffuse region reveals that it is extended
in the northeast direction with similar thermal properties as the diffuse emission. With a detected EELR
near Extension E, one possible explanation is that the jet is interacting with the cloud. However, the possibility
that hot gas (as seen by the diffuse emission) from the inner ISM is entrained by the jet can occur and will
contribute to the X-ray emission.
This is the first detection of extended thermal emission on extragalactic scales from a diffuse
region and hotspot. Other radio sources believed to have undergone ‘jet-cloud’ interaction should be
investigated for possible thermal X-ray emission.
References
- Bennett et al. (2003) Bennett, C. L., et al. 2003, ApJS, 148, 1
- Biretta et al. (1996) Biretta, J. A., et al. 1996, WFPC2 Instrument Handbook, Version 4.0 (Baltimore: STScI)
- De Young (2002) De Young, D. S. 2002, The Physics of Extragalactic Radio Sources, (Chicago: University of Chicago Press)
- De Young (1991) De Young, D. S. 1991, ApJ, 371, 69
- di Serego Alighieri et al. (1988) di Serego Alighieri, S., Binette, L., Courvoisier, T. J.-L., Fosbury, R. A. E., Tadhunter, C. N. 1988, Nature, 334, 591
- Fanaroff & Riley (1974) Fanaroff, B. L. & Riley, J. M. 1974, MNRAS, 167, 31P
- Fosbury et al. (1998) Fosbury, R. A. E., Morganti, R., Wilson, W., Ekers, R. D., di Serego Alighieri, S., & Tadhunter, C. N. 1998, MNRAS, 296, 701
- Golombek, Miley, & Neugebauer (1988) Golombek, D., Miley, G. K., & Neugebauer, G. 1988, AJ, 95, 26
- Harris & Krawczynski (2002) Harris, D. E. & Krawczynski, H. 2002, ApJ, 565, 244
- IERS (1999) IERS. 1999, 1998 Annual Report, ed. D. Gambis (Paris: Obs. Paris), 87
- Higgins et al. (1999) Higgins, S. W., O’Brien, T. J., & Dunlop, J. S. 1999, MNRAS, 309, 273
- Landau & Lifshitz (1979) Landau, L. D. & Lifshitz, E. M. 1979, Fluid Mechanics (London: Pergamon Press)
- Ma et al. (1998) Ma, C., et al. 1998, AJ, 116, 516
- Raymond, Cox, & Smith (1976) Raymond, J. C., Cox, D. P., & Smith, B. W. 1976, ApJ, 204, 290
- Solórzano-Iñarrea & Tadhunter (2003) Solórzano-Iñarrea, C. & Tadhunter, C. N. 2003, MNRAS, 340, 705
- Tadhunter (2002) Tadhunter, C. N. 2002, Revista Mexicana de Astronomia y Astrofisica Conference Series, 13, 213
- Tadhunter et al. (2000) Tadhunter, C. N., Villar-Martin, M., Morganti, R., Bland-Hawthorn, J., & Axon, D. 2000, MNRAS, 314, 849
- Tadhunter et al. (1988) Tadhunter, C. N., Fosbury, R. A. E., di Serego Alighieri, S., Bland, J., Danziger, I. J., Goss, W. M., McAdam, W. B., & Snijders, M. A. J. 1988, MNRAS, 235, 403
- Tingay et al. (1996) Tingay, S. J., Jauncey, D. L., Reynolds, J. E., Tzioumis, A. K., Migenes, V., Gough, R., Lovell, J. E. J., McCulloch, P. M., Costa, M. E., Preston, R. A., Harbison, P. 1996, AJ, 111, 718
- Villar-Martín et al. (1999) Villar-Martín, M., Tadhunter, C., Morganti, R., Axon, D., & Koekemoer, A. 1999, MNRAS, 307, 24
- van Breugel et al. (1985) van Breugel, W., Miley, G., Heckman, T., Butcher, H., & Bridle, A. 1985, ApJ, 290, 496
- Wall (1994) Wall, J. V. 1994, Australian Journal of Physics, 47, 625
- Wang et al. (2000) Wang, Z., Wiita, P. J., & Hooda, J. S. 2000, ApJ, 534, 201
- Wilson (2003) Wilson, A. S. 2003, New Astronomy Review, 47, 417
- Young & Scoville (1991) Young, J. S. & Scoville, N. Z. 1991, ARA&A, 29, 581
| (1) | (2) | (3) | (4) | |
|---|---|---|---|---|
| Parameter | Value | Lower bound | Upper bound | |
| Hotspot A | ||||
| (rs+gauss) abs | = 0.33 | |||
| Raymond-Smith model (rs) | ||||
| T (keV) | 0.22 | 0.03 | 0.04 | |
| [Z/Z☉] | 0.10 | 0.15 | 8.24 | |
| C | 1.1 | 1.0 | 0.9 | |
| Gaussian model (gauss) | ||||
| (keV) | 1.20 | 0.05 | 0.04 | |
| FWHM | 0.005 | … | 0.31 | |
| A | 1.6 | 1.0 | 1.1 | |
| plaw abs | = 0.42 | |||
| Power-law model (plaw) | ||||
| 2.6 | 0.4 | 0.4 | ||
| B | 1.1 | 0.3 | 0.3 | |
| Diffuse region | ||||
| rs abs | = 0.28 | |||
| Raymond-Smith model (rs) | ||||
| T (keV) | 1.04 | 0.15 | 0.28 | |
| [Z/Z☉] | 0.07 | 0.07 | 0.06 | |
| C | 2.1 | 0.4 | 0.4 | |
| plaw abs | = 0.33 | |||
| Power-law model (plaw) | ||||
| 1.7 | 0.2 | 0.2 | ||
| B | 3.8 | 0.3 | 0.3 | |
Note. — Parameters used in the Sherpa models for Hotspot A and the diffuse region. Column 1 contains the parameters for the model, Column 2 indicates the corresponding values, and Column 3 and 4 report the lower and upper 1 uncertainties. rs is the Raymond-Smith model, plaw is a power-law model, and gauss is the one-dimensional Gaussian model. In Column 1, T is the plasma temperature, Z is the metallicity with respect to solar abundances, C = (3.02, is the center of the Gaussian peak, FWHM is the full-width at half maximum of the Gaussian peak, A is the amplitude of the Gaussian normalization, and B is the amplitude of the power-law model. The for each modeling attempt is reported.