Tramp Novae Between Galaxies in the Fornax Cluster: Tracers of Intracluster Light
Abstract
We report the results of a survey for novae in and between the galaxies of the Fornax cluster. Our survey provides strong evidence that intracluster novae exist and that they provide a useful, independent measure of the intracluster light in Fornax. We discovered six strong nova candidates in six distinct epochs spanning eleven years from 1993 to 2004. The data were taken with the 4m and the 1.5m telescopes at CTIO. The spatial distribution of the nova candidates is consistent with 16-41% of the total light in the cluster being in the intracluster light, based on the ratio of the number of novae we discovered in intracluster space over the total number of novae discovered plus a simple completeness correction factor. This estimate is consistent with independent measures of intracluster light in Fornax and Virgo using intracluster planetary nebulae. The accuracy of the intracluster light measurement improves with each survey epoch as more novae are discovered.
1 Introduction
A fundamental problem in understanding the evolution of galaxy clusters and their constituent galaxies is the importance of dynamical processes such as tidal stripping. Theoretical models of cluster evolution have considered collisions, mergers, dynamical friction and tidal stripping in order to explain the galaxy morphology-density relation and the presence of luminous halos around supergiant D galaxies. It is generally accepted that tidal stripping will remove the more loosely bound stars in the outer envelopes of galaxies (Richstone, 1976). Merritt (1984) has argued that the extensive envelopes of cD galaxies consist of this tidal debris moving in the potential well of the cluster. However, the efficiency of tidal stripping is not well understood, because of uncertainties in the velocities, the mean tidal field, the distribution of dark matter, and the orbits of stars in the outer envelopes of the stripped galaxies. Typical theoretical estimates indicate that 10 - 20% of the total cluster light should be in the intergalactic medium (Willman et al., 2004; Murante et al., 2004) and that the amount of ICL should increase with time (Willman et al., 2004). Miller (1983) and Dressler (1984) have therefore stressed the importance of obtaining reliable measurements of the intracluster light (ICL) as a direct indicator of the tidal damage suffered by galaxies.
Attempts to measure the ICL date back to the early 1970s, originally being done with photographic plates. More recently CCD surveys have been employed by Partridge (1990), Boughn, Kuhn & Uson (1990), Vilchez-Gomez, Pello & Sanahuja (1994), and Bernstein et al. (1995) with results ranging from non-detections up to % of the total cluster light (surface brightnesses of mag arcsec-2). Even with CCDs, detecting the ICL directly is notoriously difficult and fraught with uncertainties such as the contributions from overlapping galaxy halos. An independent means of measuring the ICL, not subject to the same problems as measuring the extremely low surface brightness diffuse emission is needed.
Methods using planetary nebulae (PNe) have been developed and applied to Virgo (Feldmeier, Ciardullo & Jacoby, 1998; Arnaboldi et al., 2003; Feldmeier, Ciardullo, Jacoby, & Durrell, 2003) and Fornax (Theuns & Warren, 1997). Intergalactic red-giant-branch stars have also been detected in Virgo by comparing the luminosity function of point sources in intracluster space with control fields far from any cluster or galaxy (Ferguson, Tanvir & von Hippel, 1998; Durrell et al., 2002). Intracluster SNe have also been identified and have extended measurements of the ICL out to (Gal-Yam et al., 2003).
Novae typically range in brightness from M to , while the bright end of the PN luminosity function reaches M (Ciardullo, Jacoby, Ford & Neill, 1989) and red-giant-branch stars typically reach M. Supernovae are much brighter, but also much rarer than novae. Novae can therefore be detected more easily in a given cluster, or be observed to greater distances than PNe or red-giant stars. The transient nature of novae and their H brightness help eliminate the contamination suffered by PNe or red-giant-branch stars due to background emission line objects or unresolved compact galaxies. Another appealing property of novae is that the rate of novae per unit mass is high enough such that with a deep enough survey, one can expect to accrue a statistically interesting number of novae in each epoch, thus increasing the accuracy of the ICL measurement with each new epoch.
These properties give novae the potential to be useful as an independent and accurate measure of the ICL in nearby clusters. In spite of this, to our knowledge, no intra-cluster novae have been reported in the literature to date. As an independent check on highly uncertain direct measures of intracluster light, we can use novae to verify the amount of stellar tidal debris in the cluster. This then places constraints on the importance of tidal stripping in the formation and evolution of galaxy clusters. Our M81 nova results from the most complete nova survey ever undertaken indicate that novae are preferentially associated with the older, bulge populations in galaxies (Neill & Shara, 2004). We can use this knowledge to attempt to discern the predominant source of the ICL either in bulge-dominated or disk-dominated galaxies.
Another lesson we have learned from our nova studies is that accurate rates and distributions can only be derived from comprehensive, densely time-sampled surveys (Neill & Shara, 2004). The data set we use in this paper is diverse and very sparsely sampled. We therefore restrict our investigation to a relative comparison of galaxy versus inter-galaxy novae. Our aim is to prove the feasibility of using novae to perform an accurate assessment of the amount and origin of the ICL.
We have acquired six epochs of survey data of the central 30’ square of the Fornax cluster. Fornax is nearby and has a fairly high surface density of galaxies in the core, increasing the likelihood of tidal stripping. At the distance of Fornax, = 31.35 (Kissler-Patig et al., 1999), novae will have an average mB(peak) (the brightest novae will have peak brightnesses of mB = 21.35), and are easily detectable. Novae have been observed by Pritchet & van den Bergh (1987) in Virgo cluster galaxies, which are at the same distance as Fornax.
Novae are very bright in H (B H when the nova erupts, and B H shortly thereafter). Furthermore, novae remain bright in H for an extended period of time (months), providing a useful means of discovering them. To a limiting magnitude of MHα = -7.5 (mHα = 23.85 at Fornax) the mean H visibility lifetime is 3 months (Ciardullo et al., 1990a). Assuming a nova rate of 24 yr-1 per 1010 L⊙(B) (Ciardullo et al., 1990b), a luminosity in galaxies of M in the core of Fornax (Ferguson, 1989), a visibility lifetime in H of 3 months, and a conservative completeness factor of 0.5 due to the high surface brightness of galaxy cores, we estimate that at any given epoch there should be novae in eruption (with visible H emission) in galaxies in the central 1 deg2 of the Fornax cluster. Since we are surveying the central deg2 we multiply this estimate by and predict we will see 12 novae in any given epoch.
2 Observations
The observations that went into this study are a diverse set acquired over the span of more than a decade. The central 30’ of Fornax, centered on RA 03:38:13.72, Dec -35:32:52.2 (J2000), was surveyed. This area includes the central dominant (cD) galaxy NGC 1399 and three other elliptical galaxies: NGC 1404, NGC 1387, and NGC 1389. This region was imaged twice in 1993, once in 1995, for five nights in 1999, and once each in 2003 and 2004. The data were acquired during programs for other projects and during engineering time or director’s discretionary time. These observations are summarized in Table 1.
Because of the long-term nature of the data acquisition, there was no uniform observing strategy employed. We started with the Tek2048 camera, and when the MOSAIC II camera became available (before the 1999 run), we switched to that camera for the remaining epochs. We used standard Johnson B- and R-band filters and narrow-band H filters primarily, but for two epochs (b and c, see below) we were constrained to using a T1 filter from the Washington system (Å, FWHM Å, Canterna 1976), which is roughly equivalent to a Johnson R filter (Å, FWHM Å). The H filter used for the 1993 a epoch was the 6600/75 CTIO filter with Å and Å which accounts for the velocity of Fornax (1517 91 km s-1, Grillmair et al. 1994). The H filter used for the 1999 and 2003 epochs was the MOSAIC II c6009 filter with Å and Å. There is no H filter in the MOSAIC II set that correctly accounts for the velocity of Fornax, so we chose the filter whose central wavelength comes the closest to 6600Å. We will discuss the impact of using this filter below.
Total exposure times were restricted by the gaps available in the schedule for other programs. Individual exposure times were chosen to provide at least three frames per epoch so cosmic rays could be removed in the combining process. For the H frames the only exceptions to this are the 1999 g epoch (1 exposure) and the 1999 h epoch (2 exposures). Since cosmic rays could not be adequately removed from these exposures, they were only used for nova confirmation and measurement and not detection (see below).
All of the data were acquired using the CTIO 4m telescope with the exception of the b and c epoch data (taken exclusively through the T1 filter) which were acquired with the CTIO 1.5m telescope.
The data acquired in 1993 and 1995 were taken with the Tek2048 chip. The focal ratios of the 4m and the 1.5m are such that they produce an identical pixel scale for these images of 0”.43 per pixel. The resulting field of view is 14’.7 and thus required four pointings to cover the central 30’ of the cluster. The seeing tabulated in Table 1 for these epochs represents the range of seeing across the four pointings. Sky flats were acquired in each filter to remove the instrumental response.
The data acquired in 1999, 2003, and 2004 were taken with the MOSAIC II camera on the 4m telescope. This camera is a mosaic of eight 2048x4096 pixel CCDs with a pixel scale of 0”.27 per pixel. The resulting field of view is 36’.8 and thus required only one pointing. Sky flats were used to remove the instrumental response for the 1999 epochs, and dome flats were used for the 2003 and 2004 epochs.
All data were reduced using the standard tools in IRAF (Tody, 1986) or the mscred external IRAF package developed by the NOAO MOSAIC instrument team. Individual exposures for a given epoch were combined to produce a coadded image for the epoch and to remove all but a few cosmic rays.
3 Nova Detection
Classical novae erupt with amplitudes of up to 20 magnitudes, reaching absolute magnitudes as high as M and fading back to their pre-outburst brightness in a matter of weeks or months (Warner, 1995). Novae in the Fornax cluster are therefore invisible before outburst and fade back to invisibility after outburst on time scales of less than a year. Thus, our primary criterion for detecting novae is that they be transient on this timescale. For the data used in this study this means that they must only appear in only one year’s images. If a variable object appears in images from more than one year, it is most likely some other kind of variable source: a foreground periodic, or semi-periodic variable, or a background, unresolved active galaxy nucleus (AGN).
Classical novae also exhibit strong H emission in outburst, providing the next criterion: the candidate should be H-bright. Data from 1993 and 1999 were taken both through H and red continuum filters allowing us to produce H - red continuum subtracted images. These images were used to test candidates from 1993 and 1999 against this criterion.
The primary method for implementing these criteria consisted of performing a spatial registration of the different epochs, and then blinking them against each other. We required that any candidate nova be visible on each of the individual exposures for the epoch in which it was detected. This eliminated cosmic ray hits from our candidate list. This method worked well for candidates outside of the galaxies. For candidates in the galaxies, we employed the spatial median filter technique described in Neill & Shara (2004) with a box size of 17 pixels. The median subtracted image was then blinked in the same way as the unsubtracted images.
For the epochs taken through an H - continuum filter pair, we scaled and subtracted the continuum image from the H image to accentuate the objects with H emission. The a (1993) and the e, g, and h (1999) epochs had this filter combination which allowed us to blink the H-bright objects in these epochs.
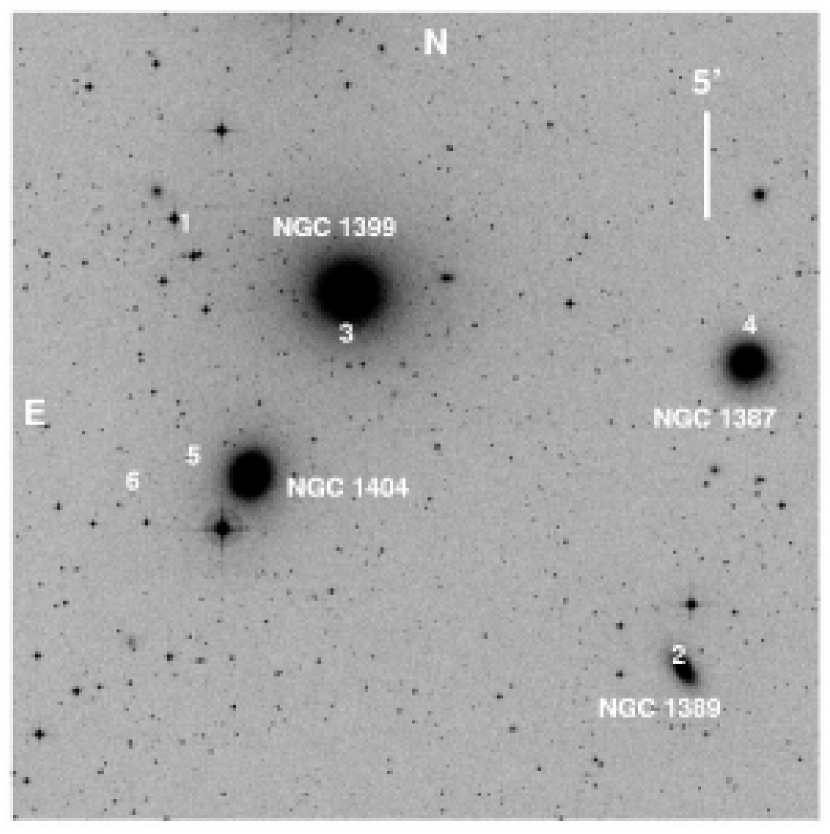
Figure 1 shows the locations of the detected nova candidates on an image from the Digitized Sky Survey111 The Digitized Sky Survey was produced at the Space Telescope Science Institute under U.S. Government grant NAG W-2166. The images of these surveys are based on photographic data obtained using the Oschin Schmidt Telescope on Palomar Mountain and the UK Schmidt Telescope. The plates were processed into the present compressed digital form with the permission of these institutions. covering the central 38’ of the Fornax cluster, corresponding to our survey area. The nova candidates are labeled by number and the galaxy identifications are also indicated. The positions of the novae are listed in Table 2. Since each candidate was discovered using slightly different techniques, each will be discussed in detail below.
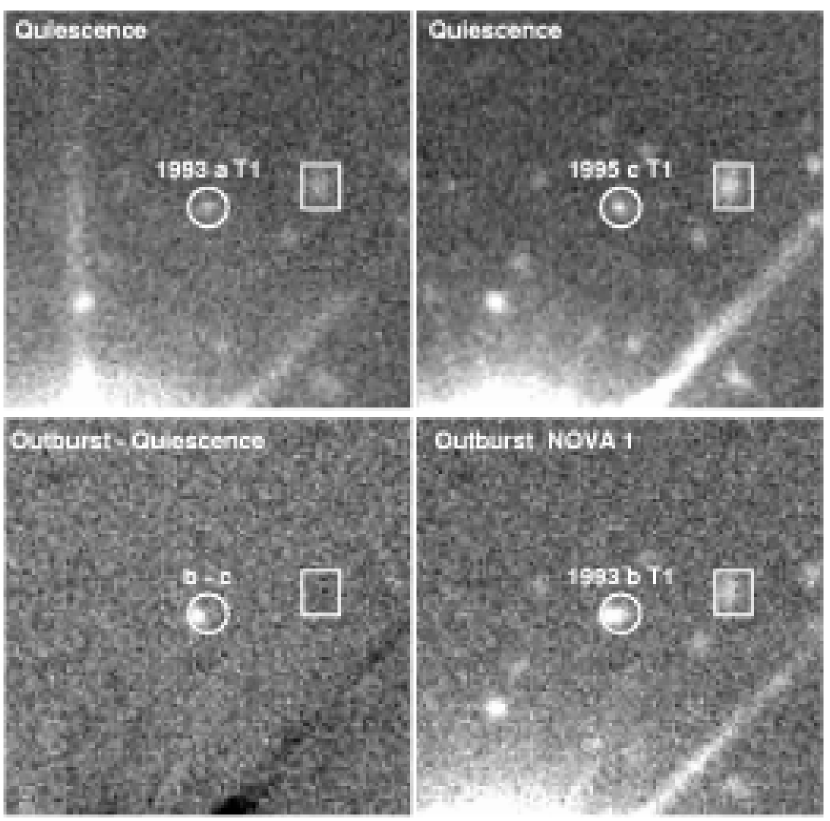
Nova 1. This candidate was discovered in the T1 image from the 1993 epoch b. It was easily compared with the T1 image from the 1995 epoch c which has a deeper frame limit afforded by the longer exposure time (see Table 1). We did a careful spatial registration of the images from other epochs and found that, indeed, this object is a transient variable meeting the first criterion described above. It appears near a faint unresolved object, but is at least 10 times brighter than that object. Figure 2 shows the three epochs of T1 images of the region (a, b, and c) and a subtraction of epoch c from epoch b, which removes the other stars in the field and shows Nova 1 as distinct from the faint point source.
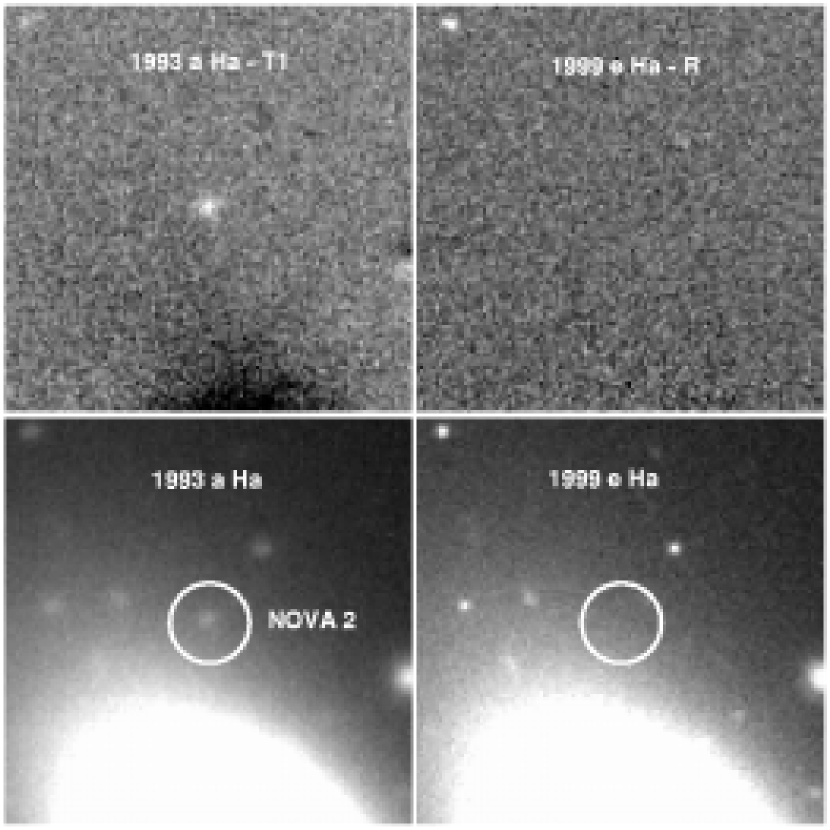
Nova 2. The 1993 a epoch H - T1 image revealed an H-bright source near the galaxy NGC 1389. Our deep H image from from the 1999 e epoch allowed us to easily confirm that this source was transient and an excellent nova candidate, as illustrated in Figure 3. In addition, we confirmed that the object was not visible in images from any other year.
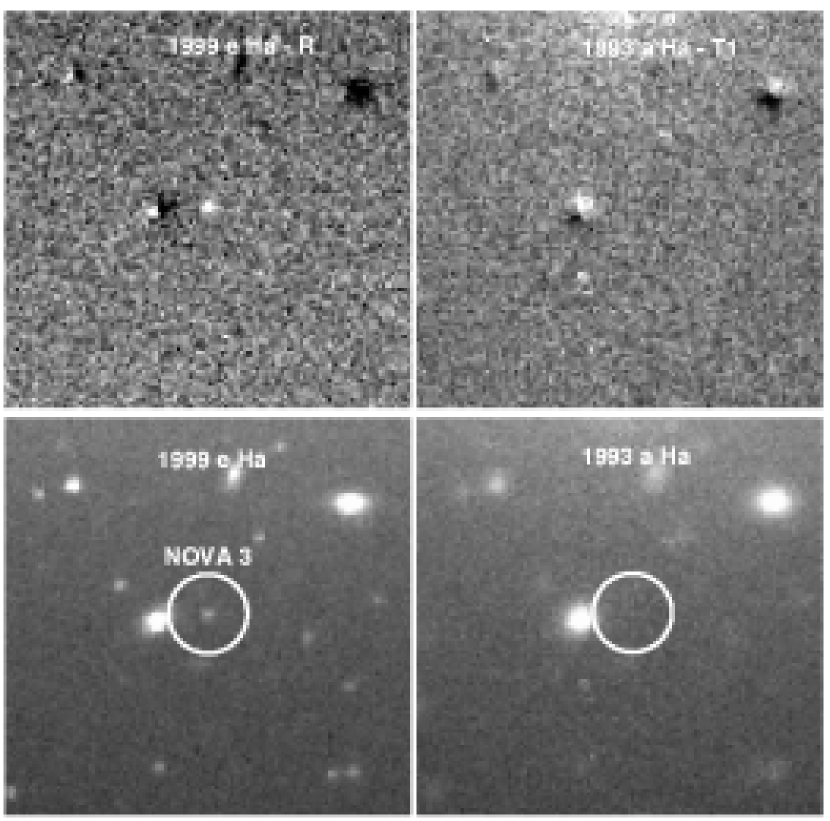
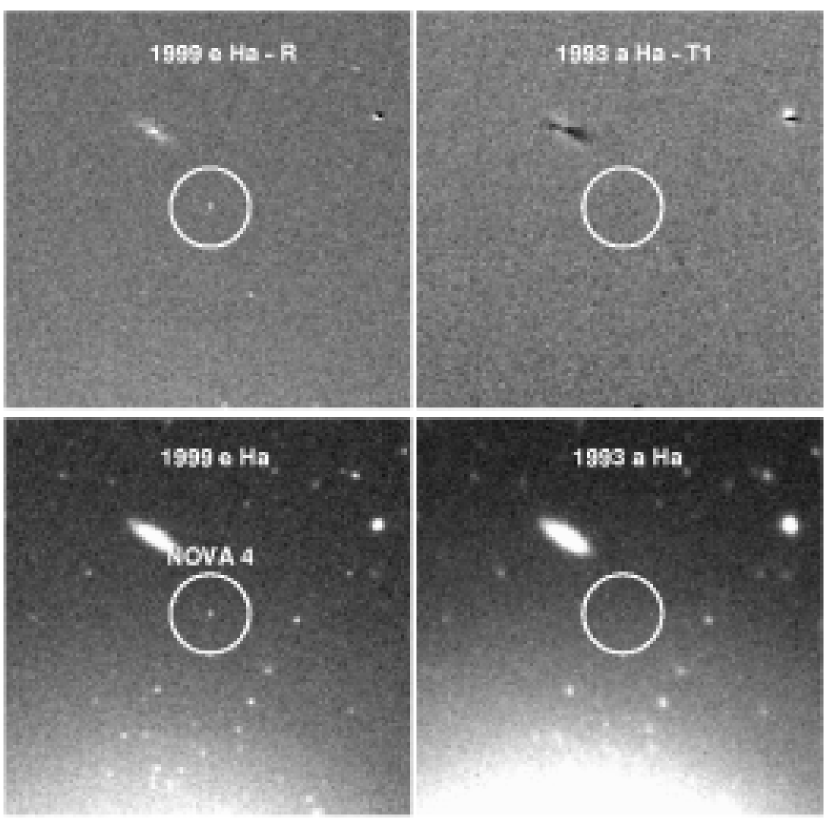
Nova 3. In this case we found an H-bright source in the H - R image from the 1999 e epoch near the galaxy NGC 1399 as shown in Figure 4. We confirmed its transient nature by the fact that it was undetectable in all H and R or T1 filter epochs from other years. Because we had 5 closely spaced epochs in 1999, we were able to generate a light curve in H and B for this candidate (see below) and measure its decline rate.
Nova 4. This candidate is nearly identical to Nova 3 in the way it was discovered, although its magnitude is fainter. It is shown in Figure 5. The light curve is displayed in the next section and shows an offset between the H and B-band brightness of 2 magnitudes, similar to that shown by the novae in M31 (Ciardullo et al., 1990a). Due to its faintness, we were unable to derive a decline rate in the B-band for this candidate. It was also not seen in the images from any other year.
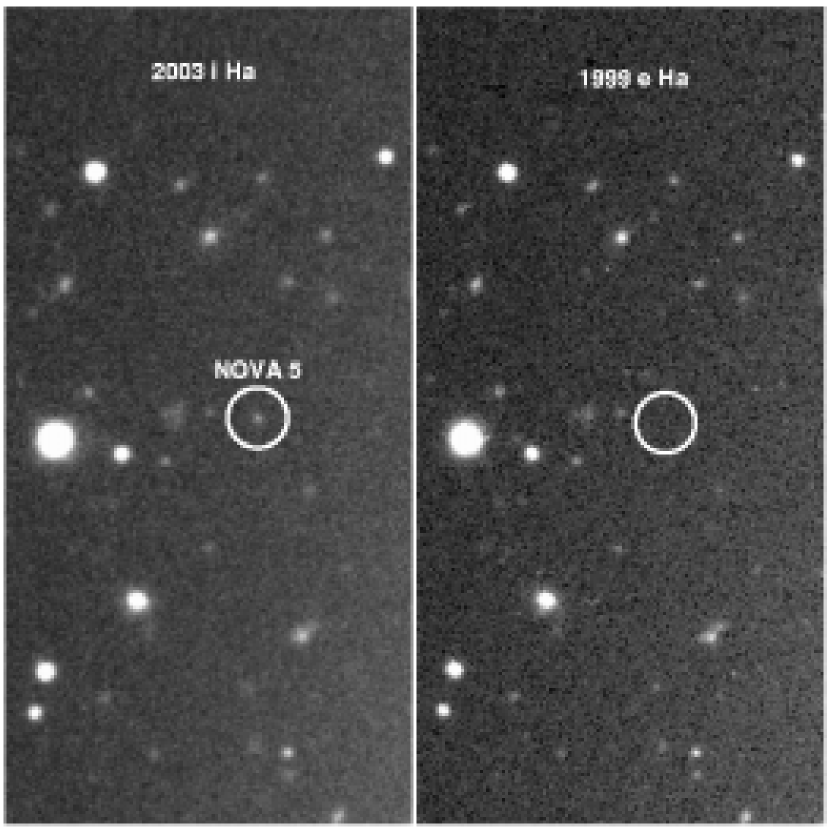
Nova 5. This candidate was discovered in the 2003 i H epoch, which did not have a corresponding red continuum image to allow subtraction. It was compared with the deeper 1999 e epoch which proves that the source is transient, as shown in Figure 6. It also does not appear on any continuum (B or R or T1-band) image in any other epoch.
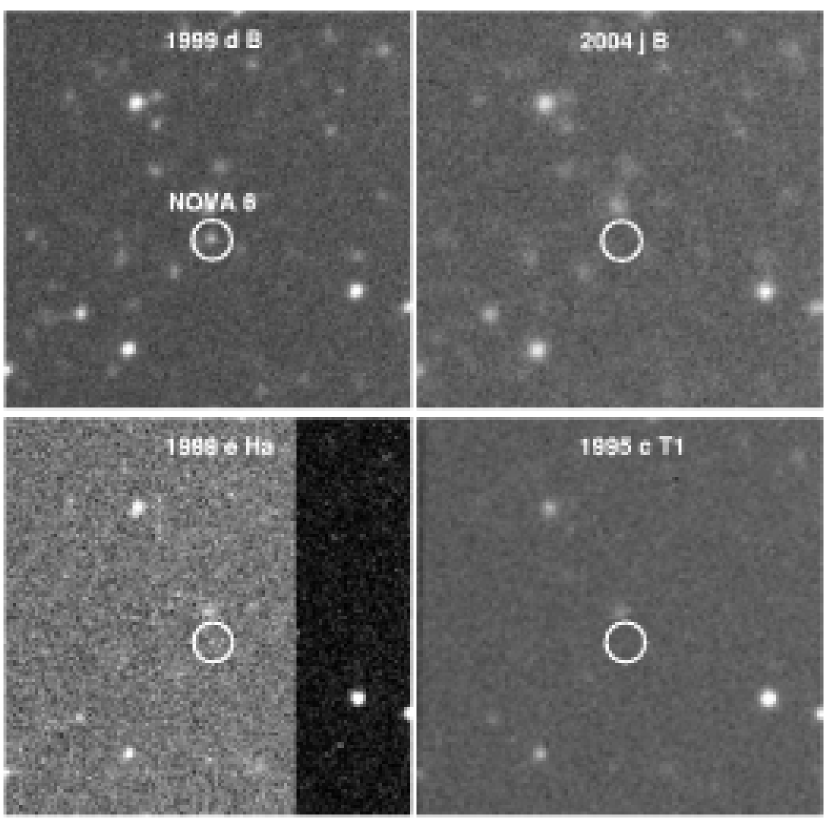
Nova 6. We discovered this candidate in the B-band image from the 1999 epochs after we obtained the 2004 j B-band epoch (see Figure 7). In the 1999 e H epoch it fell on a part of the chip that had a readout problem and therefore was missed using the H - red continuum subtraction technique. It was missed in the comparison between the B-band epochs of a (1993) and e (1999) because the depth of the 1993 a epoch B-band image was not sufficient for a good comparison. After detecting this candidate in the B-band image from 1999, we then went back and found the corresponding H-bright source in the H - R-band image. We were unable to calibrate this candidate’s H magnitude to better than 0.5 magnitudes because there were no calibration sources on the part of the chip with the readout problem. We were able to generate a B-band light curve (see below) and measure its decline rate. The H magnitude is highly uncertain for this candidate because of the readout problem mentioned above.
4 Nova Photometry
Nova instrumental magnitudes were derived using DAOPHOT (Stetson, 1987) aperture photometry. To account for variable seeing, we set the aperture radii to 1/2 the FWHM of the stellar profile measured from high signal-to-noise, well-isolated stars.
Photometric calibration was achieved using a variety of secondary standards. For B-band calibration we used the Yale/San Juan Southern Proper Motion Program (Platais et al., 1998) which had 7 unsaturated stars in common with our B-band observations in 1999. This produced a calibration accurate to 0.1 magnitudes. For the calibration of the T1, and R-band photometry we used the R-band magnitudes for the globular clusters published by Kissler-Patig et al. (1999). For the calibration we used measurement apertures that were at least as large as those used to produce the published magnitudes (Grillmair et al., 1994). Since the T1 and the R filter cover a similar wavelength range, we simply forced the T1 magnitudes to the R system. This calibration is also accurate to 0.1 magnitudes.
For the H magnitudes, we had no calibrated H sources in our fields and no observations of flux standards in our H filters. We decided, instead, to use the R-band magnitudes from Kissler-Patig et al. (1999) to calibrate our H magnitudes. This procedure is less than ideal because it introduces several uncertainties. Novae are H emission line objects and globular clusters are continuum objects. This has been overcome in the past by using a filter that is broad enough to include most of the H light and then assuming the H light fills the bandpass, i.e. by just quoting a filter magnitude and not a line flux (see e.g. Ciardullo et al. 1989). This will hold for the 1993 a epoch which used an H filter that is correctly redshifted for Fornax and a width that includes most of the H light (nova expansion velocities up to 1700 km s-1). For the other epochs which used an unshifted H filter, most of the H light will fall toward the red edge of the filter bandpass where the transmission is dropping rapidly. Without spectra of each nova, the amount of flux lost is unknown. For objects from these filters, there will be an unknown systematic error in the filter magnitudes. This also makes calculating the limiting magnitudes for these epochs uncertain as well.
With this in mind, we simply calculated the offset between the R system and our instrumental H magnitudes using the globular clusters, and applied this offset to force our instrumental H magnitudes to the R system. The number of objects used to perform the calibration varied from 13 to 30. For the 1993 a epoch the external error in H is better than 0.2 magnitudes, while for the other epochs the external H error is such that the magnitudes quoted are overestimates (the novae are probably brighter).
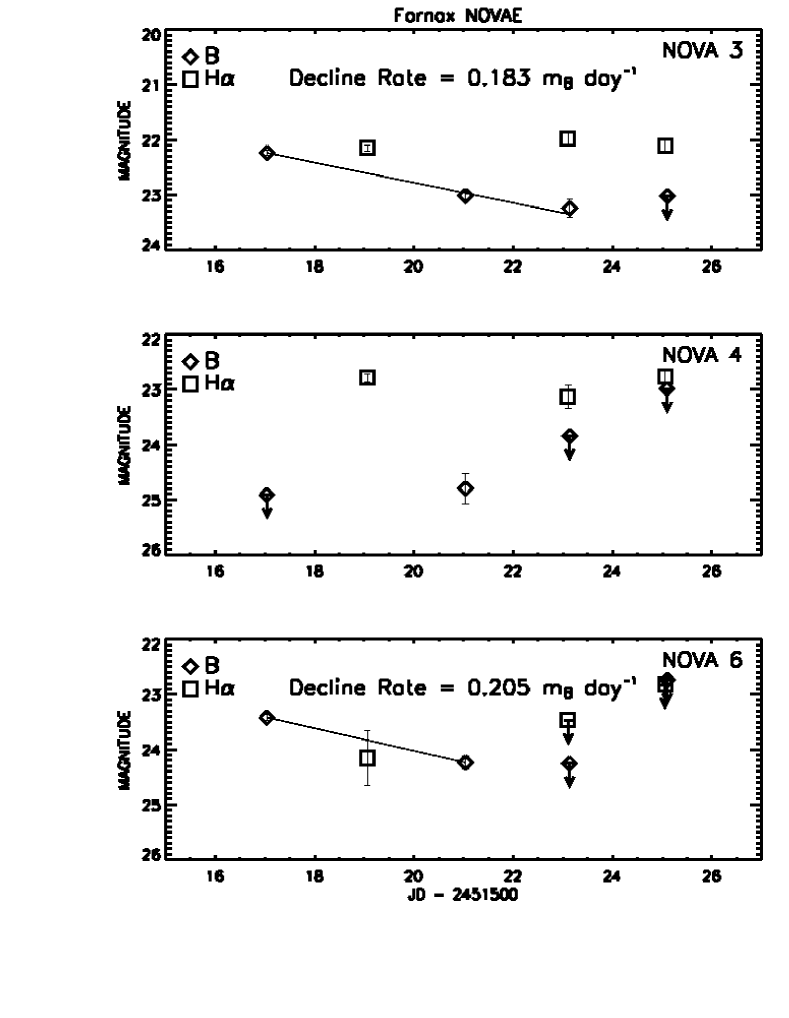
Table 3 lists the calibrated magnitudes for each nova and Figure 8 shows the B and H light curves for the multiply observed novae (Nova 3, Nova 4, and Nova 6). We used error-weighted linear fits to derive a decline rate for Nova 3 of 0.183 mB day-1 and for Nova 6 of 0.205 mB day-1. The fits are are indicated in Figure 8 by the thin solid lines. The errors quoted in Table 3 and plotted in Figure 8 are the internal measurement errors and in most cases are smaller than the external calibration errors.
5 Are These Variables Really Novae?
Could these six candidates be some other kind of variable and not novae? Without spectra, it is impossible to be certain. All of our candidates are transient according to the criterion discussed in the first paragraph of §3, thus making periodic or semi-regular variables unlikely contaminators. Four of the six candidates (Novae 2, 3, 4, and 6) are H-bright and transient, virtually ruling out other possible variables (see below). Other types of variables that are transient include background AGN, -ray bursts (GRBs), supernovae (SNe), and microlensing events. We must resort to statistical arguments in an attempt to eliminate each of these classifications for Novae 1 and 5.
The long-term quasar variability study of Helfand et al. (2001) shows that the rms variability of their sample is 0.45 mag in the blue and 0.33 mag in the red (see their Figure 4). Both Nova 1 and Nova 5 are measured at least a magnitude above the plate limit in the red (T1 for Nova 1 and H for Nova 5) making it unlikely that these could be background AGN that have varied on timescales of a year. We also checked the positions of all our novae against the deep Chandra Fornax X-ray survey of Scharf, Zurek & Bureau (2004) and found no coincidences with any X-ray sources. As an additional check we consulted the NASA/IPAC Extragalactic Database (NED) and found no coincidences with Nova 1 or Nova 5 out to a search radius of 30 arcseconds.
The total GRB rate derived from BATSE detections is about 600 yr-1, of which 40% are ’dark’, or not visible in the optical (Zhang & Meszaros, 2004). This gives an optical GRB rate of close to 1 per day over the entire sky. Our survey was roughly 30 arcminutes on a side or 0.25 square degrees, so the a priori probability of detecting a GRB in our survey field in any given epoch is .
An estimate of the SN rate in the local universe is given by Cappellaro (2001) who gives the rate for all types of SNe of SN yr-1. If we compare this to the nova rate from Ciardullo et al. (1990b) of 24 novae yr-1 we see that novae are times more common than SNe in the local universe (using H km s-1 Mpc-1). This makes it more likely that our candidates are novae rather than SNe in the Fornax cluster that declined substantially before we detected them. It is also very unlikely that a SN in the Fornax cluster would go undetected since it would reach a brightness of 12th magnitude and would decay with a timescale of months.
That being said, we can see SNe 100 times more distant than novae (SN reach M). We must, therefore, consider SNe in undetected background galaxies and intracluster SNe in background clusters. Scharf, Zurek & Bureau (2004) did find a background cluster in their deep X-ray survey of Fornax, but it is located 2.6 arcminutes from Nova 1 and has a diameter of 1.4 arcminutes in the soft band and so it is not likely that Nova 1 is a SN associated with this cluster. We cannot rule out the possibility that the object next to Nova 1 is an unresolved galaxy and that Nova 1 is a SN in that galaxy. A spectrum of this object would resolve this issue, but it would require a very large telescope since it is very faint (R 24.5).
Our deepest B-band image has a plate limit of 26. No objects are found to this limit at the positions of any of the novae (with the exception of Nova 1). If Nova 5 was really a SN in an undetected background galaxy or cluster it would have to be fainter than B of 26 and therefore much fainter than the SN itself. Although unlikely, we cannot rule this possibility out.
To assess the contamination from microlensing events, we will turn to a microlensing survey of M87 in Virgo by Baltz et al. (2004). Using the WFPC2 camera on HST every day for a month, this study detected 1 strong microlensing candidate. It’s peak magnitude was fainter than 24 and would have been barely detected in our deepest survey epochs. They report that this detection rate is consistent with the sensitivity and coverage of their survey and their microlensing models that included self-lensing from stars in M87, lensing from the M87 halo, the Virgo halo, and foreground lensing from the Milky Way (Baltz et al., 2004).
Our sensitivity to microlensing events would be considerably less than their survey due to our lower resolution and shallower depth (our faintest measurement in the B-band is 24.8, their faint limit is 28.5 assuming a 3 detection, see Baltz et al. 2004). The microlensing models from Baltz et al. (2004) show that self-lensing and lensing from the Milky Way halo provide the smallest contributions to the microlensing rate. The largest microlensing rates come from the Virgo halo, however, the rate depends strongly on the concentration of lenses toward the center of M87 where there are more sources to be lensed. This means that our much larger survey area does not drastically increase our sensitivity to microlensing events relative to theirs. This is because even though we include many more lenses (the Fornax cluster halo), we only include a factor of a few more sources to be lensed (the stars of NGC 1399 and the other three galaxies) which would not make up for the much brighter faint limit and the lower resolution of our survey.
From the models of Baltz et al. (2004), we assume that the probability for a microlensing event drops with underlying stellar density. From their observed rate and the relative similarity of M87 and NGC 1399, we would expect to barely detect one event in NGC 1399 in one month. We can eliminate the microlensing classification for our H-bright candidates because microlensing events are not H-bright. The two remaining nova candidates, Nova 1 and Nova 5, are distant from background stellar light and so the probability of detecting a lensing event in those regions should be much less than predicted in the study by Baltz et al. (2004).
Admitting that the classification for all our candidates is not iron-clad, these arguments indicate the most probable interpretation is that our candidates are novae. We will assume so for our subsequent analysis.
6 Nova Properties
We were fortunate that three of the novae erupted during the five epoch run in 1999. The two measured decline rates (see Figure 8) of 0.183 mB day-1 for Nova 3 and 0.205 mB day-1 for Nova 6 place both in the fast nova category. If we assume a distance modulus to the Fornax cluster of (Kissler-Patig et al., 1999), then our brightest B magnitude for Nova 3 is at M9.2. Typically, novae reach peak B magnitudes of M, so Nova 3 is clearly a brighter-than-average nova (see, e.g., Figure 5.3 in Warner 1995). The flat shape of the H light curve indicates that we have caught this nova near H maximum and during the earliest phases of the B decline. The brightness of Nova 3 is consistent with its fast decline rate since decline rate is known to correlate with nova peak brightness (Shara, 1981). Given the decline rate of Nova 6, it is possible that this nova was at least as bright as Nova 3 at maximum, but that we are observing it in its later decline phase. The large uncertainty in the H magnitude for this nova does not allow us to compare its B and H magnitudes.
With the uncertainties in the survey H limit mentioned above it is difficult to quantitatively assess the nova populations in the cluster. As stated in §1, we predicted 12 novae to have visible H emission down to the limit of M in any given H epoch, yet we detected only 5 novae in our 3 H epochs, a factor of 7 less than we expected. There are several factors that could reduce the number of novae we detected. Intracluster novae with velocities that would shift their H emission even farther to the red would lose a significant amount of their flux in the epochs using the unshifted H filter (Epochs e, g, h, and i). Accounting for the velocity dispersion of the intracluster population and the individual galaxies, it is possible that we are down by at least a factor of 4 by using the unshifted H filter for two of the three years of the survey.
We point out that our earlier results indicate that novae are predominantly associated with the bulge population of M81 (Neill & Shara, 2004). Novae, therefore, have the potential to provide some clues to the source of the intracluster light. A long-term, densely time-sampled study is required to properly assess the nova parent population in Fornax. Since all regions in the survey were sampled with equal frequency, an analysis of the spatial distribution of the Fornax novae is worthwhile, though it cannot be conclusive.
7 The Spatial Distribution of the Novae
We deliberately limited ourselves to two simple questions about the spatial distribution of novae in the Fornax cluster. First, assuming that novae follow the bulge light in galaxies (Neill & Shara, 2004), how many novae did we miss in the centers of the galaxies? Second, based on the light profiles of the galaxies, how many novae are associated with the cluster potential and not with any galaxy?
To answer these questions, we required the light profiles of the four galaxies in our survey region: NGC 1399, NGC 1404, NGC 1389, and NGC 1387. Since NGC 1399 has an extended halo, we used the study of Saglia et al. (2000) for its light profile. They used a combination of wide-field photographic plates and narrower-field CCD data to generate a profile that extends nearly 2000 arcseconds from the center of NGC 1399. For the other profiles, we used our B-band mosaic image from the 1999 epochs. We measured their profiles using the ellipse task in the STSDAS isophote package. Isophotes were fit on background subtracted images with the background being determined by the region in the chip most distant from the galaxy. The task was given the initial center position, position angle (PA), and ellipticity and allowed to vary these parameters at each semi-major axis position, which was set to grow geometrically and not linearly. This allowed the outer isophotes to contain enough signal to produce reasonable fits.
To answer the incompleteness question, we used artificial stars to determine our detection limit for each galaxy. Our goal was to produce a simple correction to the number of novae found in the galaxies. We used the artificial stars to ask the question, how close to the nucleus of the galaxy could the nova that was discovered in that galaxy be found? By comparing this radial limit to the light profile, we know how much light in the galaxy was effectively unsurveyed for novae of the brightness already discovered, and can thus make a correction based on the fraction of the total light unsurveyed.
DAOPHOT was used to generate a point spread function (PSF) and then used to add artificial stars around each galaxy. The galaxy images were then median-filtered, and subtracted, and (as described above) blinked to see where the artificial novae become undetectable. In all cases this limit was determined by the residual light left by the subtraction of the median-filtered image. Thus, the inner profiles of the galaxies strongly affected this detection limit.
Figure 9 shows the cumulative light profiles for the four galaxies, normalized to the total light. We set the total light limit at 26 B magnitudes per square arcsecond for the galaxies we measured. The profile of NGC 1404 was contaminated by a very bright star 180” from the galaxy, so we set a limit at that distance of 25 B magnitudes per square arcsecond.
The first thing we notice is the extent of the halo of NGC 1399. Nearly the entire survey area is enclosed by this halo. We will assume that this halo actually traces the inner potential well of the cluster itself as suggested by Merritt (1984). We also see that Nova 2 is clearly associated with NGC 1389: it is close to the half-light radius, but the association of the other novae is not straightforward. Nova 4 appears at a radius that encloses over 80% of the light of NGC 1387, while Nova 5 and Nova 6 are even farther outside of NGC 1404. Interpreting the nova placement in NGC 1399 is complicated by the extended halo, although it seems clear that Nova 3 belongs with that galaxy. The extent of the halo of NGC 1399 means that Nova 1 is located just beyond the half-light radius, but clearly it is more properly placed in the cluster rather than in that galaxy (see Figure 1). Grillmair et al. (1994) found that the transition from being bound to NGC 1399 and being bound solely to the cluster occurs at a distances between 1’.5 and 5’.5 from the center of NGC 1399 (see their Figure 2). Nova 1 is 8’.2 from the center of NGC 1399 and well past this transition. We also placed Nova 6 on the NGC 1399 light profile and it appears at a radius that encloses only 65% of the light. To be conservative, we’ll assume that 4 of our novae (2, 3, 4, and 5) are associated with the galaxies in the cluster and 2 (1 and 6) are not. But how many novae did we miss in the centers of the galaxies?
To generate a correction for missed novae, we look at the fraction of light unsurveyed, as determined by our detection limits and plotted as the vertical dot-dashed lines in Figure 9. For NGC 1399 this fraction of unsurveyed light is 0.15, for NGC 1404 it is 0.4, for NGC 1387 it is 0.3 and for NGC 1389 it is 0.45, giving a total unsurveyed light fraction of . Since we found, on average, 1 nova associated with a galaxy, this would essentially add another novae to our number associated with galaxies, giving a final score of 5.3 novae in and 2 novae outside of galaxies in the cluster.
8 A Comparison with the X-Ray Gas
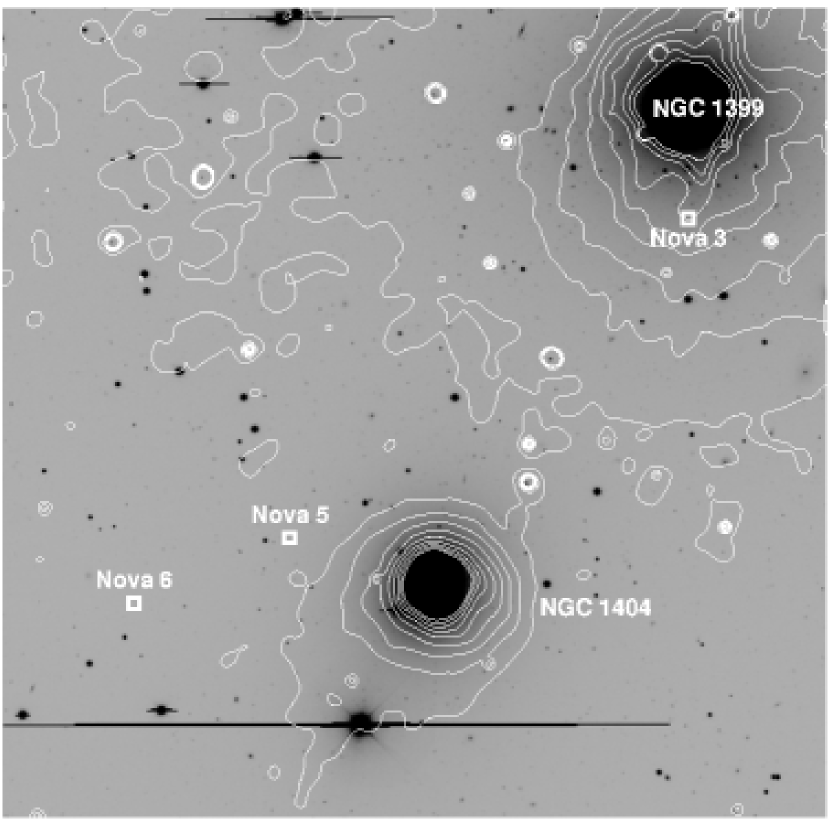
The X-ray study of the Fornax cluster by Scharf, Zurek & Bureau (2004) offers some interesting evidence concerning the association of the novae with the galaxies nearby. Figure 10 shows the X-ray flux levels near NGC 1399 and NGC 1404 generated from a soft band image (0.3 - 1.5 KeV) with an exposure time of 45 ksec (Scharf, Zurek & Bureau, 2004). Ten evenly spaced contour levels ranging from a flux of 7.710-17 erg cm-2 s-1 arcmin-2 to a flux of 4.910-16 erg cm-2 s-1 arcmin-2 are overplotted on our B-band image from epoch j (2004). Three of our novae (Nova 3, Nova 5 and Nova 6) fall in this region and are indicated by small boxes and labeled with their identifications. As pointed out in Scharf, Zurek & Bureau (2004), NGC 1404 has a bow-shock on the side facing NGC 1399 due to its motion toward NGC 1399. The comet-like tail they describe is apparent in the lowest contour of Figure 10. This figure solidifies the association of Nova 6 with intracluster space and not with NGC 1404 because it is well outside the lowest X-ray contours for NGC 1404 and well outside the bow-shock of the X-ray gas in NGC 1404.
Using our optical light profiles alone (see Figure 9), we would associate Nova 5 with NGC 1404. We see from Figure 10 that Nova 5 is outside of the bow-shock of NGC 1404. Without a detailed investigation of the dynamics of NGC 1404, we cannot conclusively say that the stars outside the bow-shock are not bound to NGC 1404, but the placement of Nova 5 is suggestive of its membership in the intracluster population. This evidence suggests that we might revise our score to 4.3 novae in galaxies and 3 novae in intracluster space.
9 The Intra-Cluster Light in Fornax
Assuming that novae trace the intracluster light in a galaxy cluster, we calculate that the ICL contributes % of the total light in the Fornax cluster. This is very close to the estimate of 40% by Theuns & Warren (1997), who used intergalactic planetary nebulae (PNe). This is likely an overestimate of the ICL due to contamination by background Ly-emitting galaxies masquerading as PN (Ciardullo et al., 2002). If we move one nova from the out to the in category (e.g., Nova 5), we get an ICL fraction of % of the total light, similar to the ICL fraction of 22% estimated for Virgo by Feldmeier, Ciardullo & Jacoby (1998) from intergalactic PNe. If we also assume that one of our intracluster novae is really a background SN (e.g., Nova 1), then we get an ICL fraction of %. All these numbers are within the range of other measures of ICL. Our key result is that we have demonstrated for the first time that intergalactic tramp novae very likely exist in the Fornax cluster, and that they can be useful tracers of the ICL.
10 Future Work
Clearly, a longer-term, densely time-sampled survey in H and continuum light of this region would allow us to provide a much more accurate measure of the ICL in Fornax. Using an H filter that accounts for both the redshift of Fornax and the velocity dispersion of the cluster and member galaxies as well as the range of nova line widths would improve the number of novae detected in each epoch by a factor of up to 7 over the survey reported here. This kind of survey would not only bolster the statistics by adding more novae, but would also provide light curves which can be used to better verify novae and estimate their peak brightnesses. It would also allow us to estimate the nova rates in each galaxy and in the ICL. This would be the first step toward assessing the source population of the ICL and estimating the effect of the galaxy cluster environment on close binary stars.
11 Conclusions
1. Intra-cluster novae do exist in the Fornax cluster and their distribution is consistent with 16 - 41% of the total light in the cluster being contributed by the ICL. The high end of this range is close to the estimate of the ICL in Fornax using intracluster PNe by Theuns & Warren (1997). The low end is close to the estimate of the ICL in Virgo using intracluster PNe by Feldmeier, Ciardullo & Jacoby (1998).
2. Tramp novae are very interesting and useful as tracers of the ICL. Their brightness at peak (MB up to 10) allows them to be visible out to the Coma cluster with current telescopes. New objects can be accumulated with each observation epoch, increasing the accuracy of the measure of the ICL with time. As our understanding of nova parent populations improves, they may become useful for constraining the origin of the tidal debris in clusters.
References
- Arnaboldi et al. (2003) Arnaboldi, M., et al. 2003, AJ, 125, 514
- Baltz et al. (2004) Baltz, E. A., Lauer, T. R., Zurek, D. R., Gondolo, P., Shara, M. M., Silk, J., & Zepf, S. E. 2004, astro-ph/0310845
- Bernstein et al. (1995) Bernstein, G. M., Nichol, R. C., Tyson, J. A., Ulmer, M. P., & Wittman, D. 1995, AJ, 110, 1507
- Boughn, Kuhn & Uson (1990) Boughn, S. P., Kuhn, J. R., & Uson, J. M. 1990, IAU Symp. 139: The Galactic and Extragalactic Background Radiation, 139, 357
- Cappellaro (2001) Cappellaro, E. 2001, Memorie della Societa Astronomica Italiana, 72, 863
- Canterna (1976) Canterna, R. 1976, AJ, 81, 228
- Ciardullo, Jacoby, Ford & Neill (1989) Ciardullo, R., Jacoby, G. H., Ford, H. C., & Neill, J. D. 1989, ApJ, 339, 53
- Ciardullo et al. (1990a) Ciardullo, R., Shafter, A. W., Ford, H. C., Neill, J. D., Shara, M. M., & Tomaney, A. B. 1990a, ApJ, 356, 472
- Ciardullo et al. (1990b) Ciardullo, R., Tamblyn, P., Jacoby, G. H., Ford, H. C., & Williams, R. E. 1990b, AJ, 99, 1079
- Ciardullo et al. (2002) Ciardullo, R., Feldmeier, J. J., Krelove, K., Jacoby, G. H., & Gronwall, C. 2002, ApJ, 566, 784
- Dressler (1984) Dressler, A. 1984, ARA&A, 22, 185
- Durrell et al. (2002) Durrell, P. R., Ciardullo, R., Feldmeier, J. J., Jacoby, G. H., & Sigurdsson, S. 2002, ApJ, 570, 119
- Feldmeier, Ciardullo & Jacoby (1998) Feldmeier, J. J., Ciardullo, R., & Jacoby, G. H. 1998, ApJ, 503, 109
- Feldmeier, Ciardullo, Jacoby, & Durrell (2003) Feldmeier, J. J., Ciardullo, R., Jacoby, G. H., & Durrell, P. R. 2003, ApJS, 145, 65
- Ferguson (1989) Ferguson, H. C. 1989, AJ, 98, 367
- Ferguson, Tanvir & von Hippel (1998) Ferguson, H. C., Tanvir, N. R., & von Hippel, T. 1998, Nature, 391, 461
- Gal-Yam et al. (2003) Gal-Yam, A., Maoz, D., Guhathakurta, P., & Filippenko, A. V. 2003, AJ, 125, 1087
- Grillmair et al. (1994) Grillmair, C. J., Freeman, K. C., Bicknell, G. V., Carter, D., Couch, W. J., Sommer-Larsen, J., & Taylor, K. 1994, ApJ, 422, L9
- Helfand et al. (2001) Helfand, D. J., Stone, R. P. S., Willman, B., White, R. L., Becker, R. H., Price, T., Gregg, M. D., & McMahon, R. G. 2001, AJ, 121, 1872
- Kissler-Patig et al. (1999) Kissler-Patig, M., Grillmair, C. J., Meylan, G., Brodie, J. P., Minniti, D., & Goudfrooij, P. 1999, AJ, 117, 1206
- Maddox et al. (1990) Maddox, S. J., Efstathiou, G., Sutherland, W. J., & Loveday, J. 1990, MNRAS, 243, 692
- Merritt (1984) Merritt, D. 1984, ApJ, 276, 26
- Miller (1983) Miller, G. E. 1983, ApJ, 268, 495
- Murante et al. (2004) Murante, G., et al. 2004, ApJ, 607, L83
- Neill & Shara (2004) Neill, J. D. & Shara, M. M. 2004 AJ, 127, 816
- Partridge (1990) Partridge, R. B. 1990, IAU Symp. 139: The Galactic and Extragalactic Background Radiation, 139, 283
- Platais et al. (1998) Platais, I., et al. 1998, AJ, 116, 2556
- Pritchet & van den Bergh (1987) Pritchet, C. J. & van den Bergh, S. 1987, ApJ, 318, 507
- Richstone (1976) Richstone, D. O. 1976, ApJ, 204, 642
- Saglia et al. (2000) Saglia, R. P., Kronawitter, A., Gerhard, O., & Bender, R. 2000, AJ, 119, 153
- Shara (1981) Shara, M. M. 1981, ApJ, 243, 926
- Scharf, Zurek & Bureau (2004) Scharf, C. A., Zurek, D. & Bureau, M. 2004, ApJ, submitted
- Stetson (1987) Stetson, P. B. 1987, PASP, 99, 191
- Theuns & Warren (1997) Theuns, T. & Warren, S. J. 1997, MNRAS, 284, L11
- Tody (1986) Tody, D. 1986, Proc. SPIE, 627, 733
- Vilchez-Gomez, Pello & Sanahuja (1994) Vilchez-Gomez, R., Pello, R., & Sanahuja, B. 1994, A&A, 283, 37
- Warner (1995) Warner, B. 1995, Cataclysmic Variable Stars, Cambridge Astrophysics Series (Cambridge, New York: Cambridge University Press)
- Willman et al. (2004) Willman, B., Governato, F., Wadsley, J. & Quinn, T. 2004, MNRAS, 355, 159
- Zhang & Meszaros (2004) Zhang, B. & Meszaros, P. 2004, astro-ph/0311321

| Epoch ID | Date | Telescope | Detector | Filter | Exptime | Seeing |
|---|---|---|---|---|---|---|
| (s) | (”) | |||||
| a | NOV-1993 | 4m-CTIO | Tek2048 | B | 900 | 1.5 - 2.2 |
| ” | ” | ” | T1 | 900 | 1.4 - 1.7 | |
| ” | ” | ” | Haa6600/75Å | 4500 | 1.4 - 1.9 | |
| b | DEC-1993 | 1.5m-CTIO | Tek2048 | T1 | 5400 | 1.1 - 1.3 |
| c | OCT-1995 | 1.5m-CTIO | Tek2048 | T1 | 9000 | 1.1 - 1.5 |
| d | 05-DEC-1999 | 4m-CTIO | Mosaic 8K | B | 4200 | 1.0 |
| e | 07-DEC-1999 | ” | ” | R | 1260 | 0.9 |
| ” | ” | ” | Hbb6563/80Å | 7200 | 0.8 | |
| f | 08-DEC-1999 | ” | ” | B | 4200 | 1.1 |
| g | 11-DEC-1999 | ” | ” | R | 1260 | 1.2 |
| ” | ” | ” | Hbb6563/80Å | 1800 | 1.2 | |
| ” | ” | ” | B | 1800 | 1.4 | |
| h | 12-DEC-1999 | ” | ” | R | 1260 | 1.6 |
| ” | ” | ” | Hbb6563/80Å | 3600 | 1.4 | |
| ” | ” | ” | B | 3000 | 1.2 | |
| i | 27-FEB-2003 | 4m-CTIO | Mosaic 8K | Hbb6563/80Å | 6000 | 1.2 |
| j | 14-JAN-2004 | 4m-CTIO | Mosaic 8K | B | 8100 | 1.8 |
| Position | |||||
|---|---|---|---|---|---|
| (J2000) | |||||
| Distance | |||||
| Nova | RA | Dec | Epoch(s) | Galaxy | (arcsec) |
| 1 | 03:39:06.2 | -35:23:48 | b | NGC 1399 | 489 |
| 2 | 03:37:12.1 | -35:44:11 | a | NGC 1389 | 37 |
| 3 | 03:38:29.0 | -35:29:02 | d-h | NGC 1399 | 121 |
| 4 | 03:36:55.8 | -35:28:39 | d-h | NGC 1387 | 108 |
| 5 | 03:39:04.5 | -35:34:45 | i | NGC 1404 | 164 |
| 6 | 03:39:18.4 | -35:35:55 | d-h | NGC 1404 | 329 |
| J. D. | |||||
|---|---|---|---|---|---|
| Nova | (+240000) | Epoch | Filter | m | Err(m) |
| 1 | 49331.53 | b | T1aaPhotometry for this object was forced to the R-band system. | 21.9 | 0.1 |
| 2 | 49299.84 | a | H | 21.1 | 0.4 |
| 3 | 51519.07 | e | H | 22.1 | 0.1 |
| 51523.10 | g | H | 22.0 | 0.1 | |
| 51525.05 | h | H | 22.1 | 0.1 | |
| 51517.05 | d | B | 22.2 | 0.1 | |
| 51521.04 | f | B | 23.0 | 0.1 | |
| 51523.13 | g | B | 23.2 | 0.2 | |
| 51525.10 | h | B | 23.0 | ||
| 4 | 51519.07 | e | H | 22.8 | 0.1 |
| 51523.10 | g | H | 23.1 | 0.2 | |
| 51525.05 | h | H | 22.8 | 0.1 | |
| 51517.05 | d | B | 24.9 | ||
| 51521.04 | f | B | 24.8 | 0.3 | |
| 51523.13 | g | B | 23.8 | ||
| 51525.10 | h | B | 23.0 | ||
| 5 | 52697.07 | i | H | 22.8 | 0.1 |
| 6 | 51519.07 | e | H | 24.2 | 0.5 |
| 51523.10 | g | H | 23.5 | ||
| 51525.05 | h | H | 22.8 | ||
| 51517.05 | d | B | 23.4 | 0.1 | |
| 51521.04 | f | B | 24.2 | 0.1 | |
| 51523.13 | g | B | 24.3 | ||
| 51525.10 | h | B | 22.7 |