(∗ Present address: Max Planck Institut fuer Extraterrestrische Physik, D-85478 Garching, Germany.
E-mail: marcella@mpe.mpg.de) 22institutetext: INAF – Osservatorio Astronomico di Bologna, via Ranzani 1, I–40127 Bologna, Italy 33institutetext: European Southern Observatory, Karl–Schwarzschild–Strasse 2, D–85748 Garching bei Muenchen, Germany 44institutetext: INAF – Osservatorio Astrofisico di Arcetri, Largo E. Fermi 5, I–50125 Firenze, Italy 55institutetext: INAF – Osservatorio Astronomico di Roma, via Frascati 33, I–00040 Monteporzio, Italy 66institutetext: Sterrewacht Leiden, PO Box 9513, 2300 RA, Leiden, The Netherlands
XMM–Newton observations of Extremely Red Objects and the link with luminous, X–ray obscured Quasars
We present the results of a deep (about 80 ks) XMM-Newton survey of the largest sample of near-infrared selected Extremely Red Objects (RK 5) available to date to K. At the relatively bright X-ray fluxes (F erg cm-2 s-1) and near-infrared magnitude probed by the present observations, the fraction of AGN (i.e., X–ray detected) among the ERO population is small (3.5%); conversely, the fraction of EROs among hard X-ray selected sources is much higher (%). The X-ray properties of EROs detected in our XMM–Newton observation indicate absorption in excess of 1022 cm-2 in a large fraction of them. We have also considered additional samples of X–ray detected EROs available in the literature. X–ray spectral analysis of the highest S/N sources unambiguously indicates that large columns of cold gas (even cm-2) are the rule rather than the exception. The X-ray, optical, and near-infrared properties of those X-ray selected EROs with a spectroscopic or photometric redshift nicely match those expected for quasars 2, the high-luminosity, high-redshift obscured AGNs predicted in baseline XRB synthesis models. A close correlation is detected between X- and K-band fluxes. For the AGN EROs this is consistent, under reasonable assumptions, with the relation established locally between the host galaxies and their central black holes. This suggest that the majority of EROs are powered by massive black holes accreting, on average, at about 0.03-0.1 of the Eddington limit.
Key Words.:
X–rays: surveys, galaxies: active, galaxies: Extremely Red Objects1 Introduction
Extremely Red Objects (EROs, RK5, Elston, Rieke & Rieke 1988),
initially detected in near–infrared ground–based imaging,
have the colors expected for high-redshift passive ellipticals
and have been used as tracers of distant (z) and old spheroids.
Reproducing their observational properties have
proved to be extremely challenging for all current
galaxy formation models (see e.g. Kauffmann 2003 for a
review).
However, on the basis of a number of observational results, it has
been pointed out that
high- passive ellipticals are only one of the various classes
of extragalactic sources which make up the ERO population.
Deep VLT spectroscopy from the survey (Cimatti et al.
2002, 2003) has indeed shown that EROs are nearly equally populated
by old, passively evolving systems and dusty star–forming galaxies
over a similar range of redshift ( for both the classes; see also
Yan, Thompson & Soifer 2004) and similar results are confirmed both
by colour selection criteria (Mannucci et al. 2002) and by radio
observations (Smail et al. 2002).
A few individual objects have been also identified as
high redshift Active Galactic Nuclei (AGN) on the basis of the
detection of strong emission lines in near–infrared and/or optical
spectra (see e.g. Pierre et al. 2001; Brusa et al. 2003). In this case
the enhanced emission in the K band with respect to the
R band is probably due to the combination of strong dust extinction
in the optical and a contribution of the point-like emission in the
near–infrared. However, there are increasing evidences
that the near–infrared light of obscured AGN is dominated by the host
galaxy emission (see e.g. Mainieri et al. 2002; Mignoli et al. 2004).
A large population of
optically faint X–ray sources without any obvious AGN signature in
the optical spectrum and with optical to near–infrared colors typical
of high redshift ellipticals and starburst galaxies has been revealed
in the deepest Chandra and XMM–Newton exposures (e.g. Hasinger et al. 2001; Barger
et al. 2003; Szokoly et al. 2004).
Thus, the follow–up campaigns of deep XMM–Newton and Chandra observations
have probed to be a powerful tool to investigate the AGN EROs
population (Alexander et al. 2002).
Results from both shallow and deep X–ray surveys also suggested
that the AGN population among EROs shares the same X–ray properties
of high–luminosity, highly obscured (N cm-2)
AGN (Mainieri et al., 2002; Alexander et al. 2002; Brusa
2003).
Further support to the result that a significant fraction of
obscured AGN are hosted in EROs comes from near infrared observations of
X–ray sources selected on the basis of their high X–ray to optical
flux ratio (X/O, Mignoli et al. 2004): the hosts of luminous, obscured
hard X-ray sources with extreme X/O are among the most
massive spheroids at z.
Finally, the observed fraction of AGN among EROs
can help constraining models which include the evolution of QSO activity in
the formation of spheroids and the resulting effects on galaxy evolution
(e.g. Granato et al. 2004; Menci et al. 2004).
Several physical models have been proposed
in which the fueling of the supermassive accreting black holes
in AGN is triggered by merging events (in the context of the
hierarchical structure formation paradigm),
and the interplay between star formation and nuclear activity
determines the relationship between the black holes (BH) mass
and the mass of the host galaxy.
If the evolution of luminous AGN follows that of spheroids,
as suggested by e.g. Franceschini et al. (1999) and Granato et al. (2001),
it is possible that the radiation and the strong
winds produced by a powerful AGN present in the massive galaxy
may help inhibiting the star-formation in these galaxies, which
therefore would have red colors.
However, previous studies
on the fraction of AGN among the EROs population,
although having deep near–infrared and X–ray observations ( and the Megaseconds Chandra exposures)
were limited in areal coverage (50–80 arcmin2) and therefore were
unsuitable for detailed statistical analyses of the AGN EROs
population.
To further study the nature of AGN EROs and the link between accreting supermassive black holes and the host galaxy properties, we have started an extensive program of multiwavelength observations of one of the largest sample of near–infrared selected EROs available to date (400 sources), selected over a contiguous field of arcmin2 (the “Daddi field”, Daddi et al. 2000). The sample is complete to a magnitude limit of K19 and the field is covered by deep optical photometry in the R–band. The same field will be also imaged with Subaru and Chandra and spectroscopic VIMOS observations are already planned. We have obtained with XMM–Newton a total of 110 ks, in two different observations: the moderate–deep exposure and the high energy throughput of XMM–Newton, coupled with its large field of view, are well–suited to detect AGN among EROs at relatively bright X–ray fluxes, on a statistically significant sample. The data reduction and analysis, the X–ray source identification and the X–ray properties of X–ray detected EROs in our XMM–Newton sample are presented in Section 2. The results on the fraction of AGN EROs as a function of the X–ray and K–band fluxes are discussed in Section 3. Section 4 compares the optical, near infrared and X–ray properties of the EROs in our sample with those of other samples of X–ray detected EROs and discusses the fraction of AGN EROs in K–selected samples. Section 5 presents the average X–ray properties of EROs AGN, their contribution to the quasar 2 population and an estimate of their Black Hole masses and Eddington ratios. Finally, Section 6 summarizes the most important results. Throughout the paper, a cosmology with km s-1 Mpc-1, =0.3 and =0.7 is adopted.
2 Multiwavelength data and X–ray source identification
2.1 Near–Infrared and Optical data
The near infrared EROs sample was selected by Daddi et
al. (2000) from the 5 K–band source catalog and
adopting the selection criterion .
The -band data were taken at the 4.2m William Herschel Telescope
on La Palma, while the observations
were performed with the ESO NTT 3.5m telescope in La Silla;
relevant details on optical and near–infrared data reduction
can be found in Daddi et al. (2000).
A total of EROs are included in this “reference EROs
sample”; to date, this study still constitutes the largest published
survey of EROs performed at moderately deep limits, complete
to =18.8 over arcmin2 and to =19.2 in a
deeper area of arcmin2, more than a factor of four
larger than other near–infrared surveys at the same limiting
magnitudes (e.g. Thompson et al. 1999; Miyazaki et al. 2003). The
5 limiting magnitude in the band is .
2.2 X-ray data
Two XMM–Newton observations of this field
have been obtained with the European Photon Imaging Camera (EPIC,
Jansen et al. 2001), equipped with both the MOS and pn
instruments.
The first observation (OBS-ID 0057560301) was taken on August 3, 2001
for a nominal exposure time of 50 ks; the second
observation was taken two years later, splitted in two parts (August
22, 2003 – OBS-ID 0148520101 – and September 16, 2003 – OBS-ID 0148520301),
for a total nominal exposure time of ks.
All the EPIC cameras operated in full-frame and were equipped
with the “Thin” filter, which is usually employed in the observations
of faint sources111http://xmm.vilspa.esa.es/external/xmm_user_support/documentation/index.shtml.
The three XMM–Newton datasets were reduced using version 5.4.1 of
the Science Analysis
System222http://xmm.vilspa.esa.es/external/xmm_sw_cal/sas_frame.shtml
(SAS) with the latest, relevant calibration products.
The raw pn and MOS Observations Data Files (ODF) were processed
using the SAS tasks emproc and epproc to produce calibrated
event lists.
Only events with pattern 0-4 (single and double) for the pn and 0-12
for the MOS cameras were selected.
All the event files were cleaned up from hot pixels and soft
proton flares
removing all the time intervals with a count rate
higher than 0.15 c/s in the 10–12.4 keV energy range for the MOS and
higher than 0.35 c/s in the 10–13 keV band for the pn units
(see Baldi et al. 2002).
The excellent relative astrometry between the three cameras in each
observation (within 1′′, well below their PSF FWHM of ), allowed us
to merge the MOS and pn images in each observation,
thus increasing the signal-to-noise ratio and reaching fainter
X–ray fluxes. Moreover, taking into account the absolute
astrometry between the three observations, the counting statistics
have been improved by summing all the available datasets (i.e. MOS1, MOS2 and pn of the three observations).
The resulting total exposure time for the pn is ks,
and is only slightly lower for the MOS instruments ( ks).
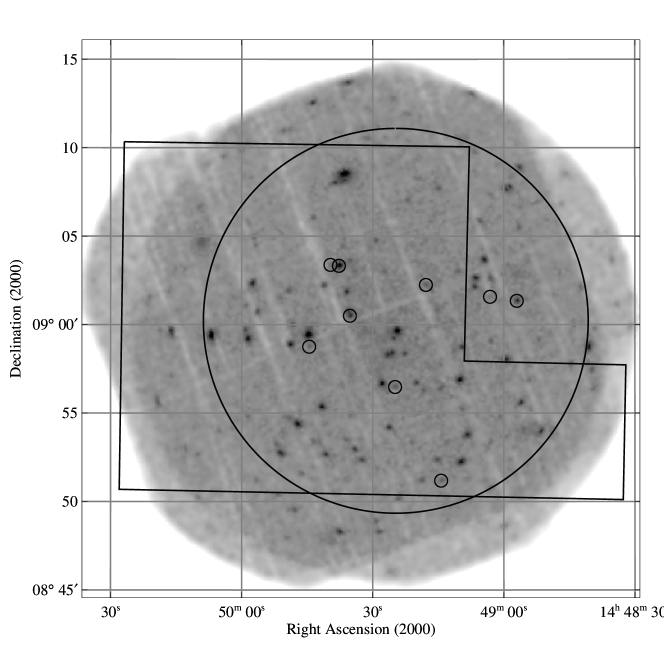
We have limited the X–ray analysis to a circular region of 11
arcmin radius from the point of maximum exposure time (centered at
=14h49m25s and
=09o0013). At this radius,
the effective exposure drops to % of the maximum value.
The resulting area analysed in the present work is therefore of
arcmin2.
The area in common with the deepest near–infrared coverage is arcmin2.
The pattern of the X–ray and optical/near–infrared data is shown in
Fig. 1: the 11 arcmin radius circle and
the deepest Ks band region (polygon) are superimposed on the
0.5-10 keV image.
The XMM–Newton area analysed in this work includes 257 EROs:
173 EROs with 18.8 over arcmin2, and
216 EROs with 19.2 in the area with the deeper
near–infrared coverage ( arcmin2).
The accurate detection algorithm developed for the Hellas2Xmm survey
(see Baldi et al. 2002 for details) was run on the 0.5–10 keV (full
band) cleaned events, in order to create a preliminary list of
candidate sources, which included also sources detected at a low level
of significance.
We then computed for each source the probability that the
detected counts originate from poissonian background fluctuations
and we kept in the final list only those sources (96) which
were detected above a detection probability threshold of
p=2 (that corresponds to less than 1 spurious
X–ray detection, or 4 gaussian threshold).
The count rate to flux conversion factor was derived assuming a
power law with photon index =1.7,
absorbed by the Galactic column density in the direction of the Daddi Field
(NH=5 cm-2, Dickey & Lockman 1990),
and weighted by the effective exposure times of
the different EPIC cameras. The uncertainty in the derived fluxes is % for
and NH up to 1021 cm-2.
The corresponding full band limiting flux is
erg cm-2 s-1at
the aim point, and is a factor of higher at the
edge of the selected area, where the net exposure is ks.
In order to compute reliable X–ray fluxes in different energy bands
(i.e. to roughly account for the X–ray spectral shape),
fluxes in the soft (0.5–2 keV band) and hard (2–10 keV band)
were computed from the counts detected in each energy band
using the same detection algorithm. A total of 86 sources (down to
S erg cm-2 s-1) and 60 sources
(S erg cm-2 s-1) were detected, respectively.
The X–ray centroids have been astrometrically calibrated
with respect to the optical positions of three bright quasars
in the field (Hall et al. 2000): the resulting shift of 2′′
((Ra)=1.47′′; (dec)=1.29′′) has then been
applied to all of the source positions.
Table 1 lists all the relevant X–ray properties of the detected
sources (the X–ray source identifier, X–ray coordinates,
hard 2-10 keV flux and counts, soft 0.5–2 keV flux and counts),
sorted with decreasing hard band X–ray flux.
2.3 Likelihood analysis
Optical and near–infrared photometry is available for 87 (55) out of 96 (60) X–ray sources detected in the full (hard) band. The sources for which optical and near–infrared photometry is not available are all close to bright stars and/or defects in the and/or band images that were masked in the optical and near–infrared source detection.
At the optical and near–infrared fluxes probed by our survey, the identification process is a critical issue especially for faint sources. At first, the X–ray source list has been cross–correlated with the –band and –band catalogs using a conservative 5′′ radius error circle (see Brusa et al. 2003 for further details): 162 (71) sources in the () band were found in 87 X–ray error-circles. The difference in the number of objects (i.e. surface densities) in the two bands clearly reflects the different depth of the optical and near–infrared images. In particular, using the catalog and a fixed searching radius, substantial source confusion may be present: on the basis of the integral counts from the –band catalog, on average 1 galaxy with R is expected just by chance in each of the 5′′ radius error circles. We therefore decided to use the “likelihood ratio” () technique, in order to properly identify the optical/near–infrared counterparts. The is defined as the ratio between the probability that the source is the correct identification and the corresponding probability of being a background, unrelated object (Sutherland & Saunders 1992), i.e.:
| (1) |
where f(r) is the probability distribution function of the
positional errors and it is assumed to be a two–dimensional gaussian,
n(m) is the surface density of background objects with magnitude
m, and q(m) is the expected probability distribution as a
function of magnitude of the true counterparts.
The q(m) distribution is normalized as , where is the a priori expected fraction
of X–ray sources with an optical counterpart brighter than
; can be either the limiting magnitude of the
optical data or the magnitude beyond which the surface density of
background objects becomes so high that no reliable “statistical”
identification is possible.
For the calculation of the parameters
we have followed the procedure described by Ciliegi et
al. (2003); more specifically,
in order to maximize the statistical significance of
the over density due to the presence of the optical counterparts, we
have adopted a 3″ radius for the estimate of the q(m)
distribution.
A large fraction of the possible counterparts are expected to be included
within such radius, on the basis of previous works on XMM–Newton data
(e.g. Fiore et al. 2003).
Fig. 2 shows the observed magnitude
distribution of the optical objects detected in the band
within a radius of 3″ around each X–ray source (solid histogram), together with the
expected distribution of background objects in the same area (dashed
histogram). The difference between these two distributions
(dot-dot-dot dashed histogram) is the expected magnitude distribution
of the optical counterparts. The smooth curve fitted to this histogram
(dot-dot-dot dashed line) has been used as input in the likelihood
calculation (q(m)).
Figure 2 shows that the observed number of
objects is well above the background up to . At , the number of
detected objects in the X–ray error boxes is consistent with
that expected from the background.
For these reasons we have adopted in our likelihood
calculation; all sources fainter than this limit will have q(m)=0 by definition and correspondingly .
For the normalization we adopted , corresponding to the ratio
between the integral of the distribution and the total
number of X–ray sources. This preliminary analysis suggests that
we expect to identify a fraction of the order of 75% of the X–ray
sources with objects brighter than R,
in agreement with the results from other XMM–Newton surveys (e.g. Hasinger
et al. 2001).
A similar procedure has been applied to the band data and the
value for all the optical and near–infrared candidates
has been computed.
The next step is to choose
the best threshold value for () to
discriminate between spurious and real identifications.
The choice of depends on two factors: first, it
should be small enough to avoid missing many real
identifications and producing a rather incomplete sample.
Secondly, should
be large enough to keep the number of spurious identifications
as low as possible and to increase the reliability of the source
identifications.
A threshold of =0.25 in both optical and
near–infrared bands has been adopted; this turned out to be the value
which maximizes the sum of sample reliability and completeness
for the assumed normalization (see Ciliegi et al. 2003 for further
details). To check how the uncertainty in Q could affect our
results, we repeated the likelihood ratio analysis using different
values of in the range 0.5–1.0: no substantial difference in the
final number of identifications has been found.
This threshold, a posteriori, led to an estimated percentage of secure X–ray to
optical or near–infrared associations up to of the order
of %, in good agreement with the estimate of Q.
2.4 X–ray source identification
The information derived in the two bands have been then combined:
all the sources with the highest in both the and
bands, as well as the sources undetected in the band but with
a in the –band have been defined
secure identifications (a total of 70).
As expected, most of the reliable optical counterparts have an X–ray to
optical separation () smaller than , with only
4 objects with .
In addition, three X–ray sources have a
unique, very faint (24.5) optical counterpart
within 1.6′′ from the X–ray position
(xid#330, xid#244, xid#129)333These sources
have no further optical counterpart up to 5′′; by construction
(see Sect. 2.3),
their associated likelihood ratio is zero. Given that less than one
galaxy with is expected by chance
in the total area corresponding to 87 error boxes with
1.6′′ error–box,
we tentatively consider also these three sources as likely identifications.

Seventy–three out of 87 X–ray sources have been
therefore securely associated to an optical/near–infrared
counterpart and are reported in the first part of
Table 2,
where we list, for each X–ray source,
the X–ray ID number and position, the distance between the X–ray and
optical counterparts (or candidates), the and –band
magnitudes, and the in both the optical and near–infrared bands.
Of these 73 sources, 45 belong to the hard X–ray sample.
In other 8 cases we have more than one optical and/or near–infrared
possible counterpart with
and therefore the real counterparts are not unambiguously
determined. These are
listed in the second part of Table 2.
In these cases, a detection in the forthcoming Chandra observations
(with 5-10 times smaller
error–boxes) would definitively discriminate between the possible
counterparts.
Finally, in the remaining 6 cases the possible
counterparts have on average fainter optical magnitude,
none of the candidates has , and all of them lie
at (Table 2).
This can be the case if the source is very faint and undetected
in the optical bands (see e.g. Koekemoer et al. 2004),
or if the X–ray emission originates from a group of galaxies.
In the bottom part of Table 2 we list also the 9 X–ray
sources for which optical and infrared photometry is not available.
In the following, we will consider only the ERO sources;
a more detailed discussion of the properties of the
global sample of optical/near–infrared identifications will be
presented elsewhere (Brusa et al., in preparation).
2.5 Hard X–ray detected EROs and hardness ratio analysis
From the likelihood analysis, 8 hard X–ray sources are
securely associated with EROs in the “reference EROs sample”
(i.e., in the 5 catalog, see Sect. 2.1).
All the EROs associated with X–ray sources are reported in
Table 3.
Differently from Table 2, the and magnitudes
given here are measured within 2′′ diameter aperture. These are the
magnitudes used to compute the colour and to select the EROs
sample.
The same table gives, for each source, the hardness ratio (HR)
defined as (H-S)/(H+S) where H and S are the counts in
the hard and soft band, respectively. Among the 8 X–ray detected
EROs, 5 are detected in both the
hard and soft bands and three only in the hard (lower limit to
HR).
One more X–ray source is associated with an ERO with a
magnitude fainter than the 5 threshold (bottom part of
Table 3).
A total of 9 hard X–ray sources are therefore associated with EROs.
.
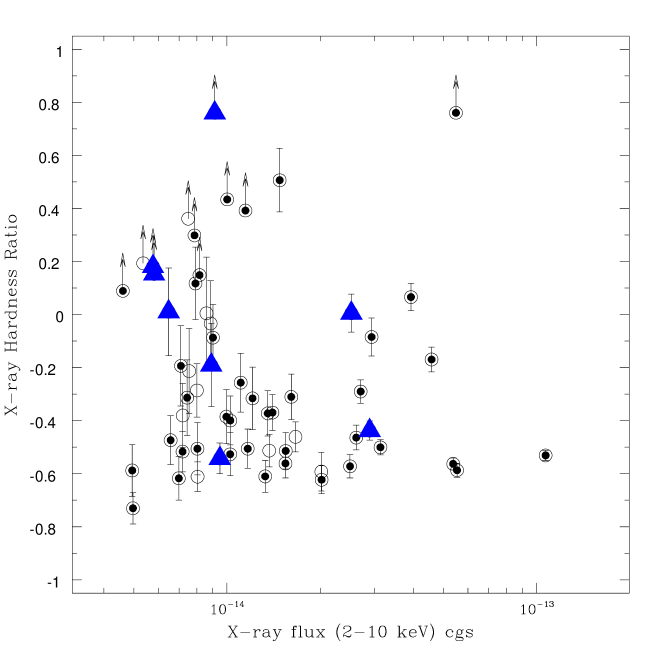
Figure 3 shows the HR versus the 2–10 keV flux
for the 60 hard X–ray selected sources. The eight EROs
belonging to the 5 sigma sample are plotted as filled triangles.
Six out of eight EROs have HR values higher than the median
value of the total sample (HRmed=-0.3); the HR of these 6 EROs
imply N cm-2 at z (see Fig. 7 in Brusa et
al. 2003).
Only two EROs have HR values in the range expected for
unobscured AGN (HR), and they are
detected at F erg cm-2 s-1, while the majority
of the EROs are detected at
F erg cm-2 s-1and hard X–ray colours,
qualitatively in agreement with the observed hardening of the
X–ray source population at fainter flux levels (e.g., Tozzi et al. 2001).
These data strongly suggest that significant absorption
is present in a large fraction of the hard X–ray detected EROs
population (see also Sect. 5).
On the other hand, Figure 3 shows that even if the fraction of EROs
increases among sources with higher values of HR, not all of the
hardest sources are EROs (e.g. among the 15 sources with HR0, only
6 are EROs).
3 Fractions of X–ray detected EROs and of EROs among hard X–ray sources
The large area of our sample is well suited
to statistically assess the fraction of
AGN powered EROs at relatively bright X–ray fluxes and to
quantitatively investigate the luminous tail of this population.
257 K–selected EROs from the “reference EROs sample”
are within the XMM–Newton area analysed in this work.
Among the 9 hard X–ray detected objects,
seven are in the deeper () 300 arcmin2
(see Fig. 1),
while the number of X–ray detected EROs
in the 380 arcmin2 area at the shallower K
limit is 6; one additional object
(xid#189) is detected over the incomplete 18.8 area
(see also Table 4).
In the present observation, the X–ray limiting flux corresponds to an
X–ray luminosity L erg s-1 for z=1.
Thus, the EROs X–ray emission is most likely
powered by AGN activity, and the fraction of
AGN among EROs in the present sample is at least
% (8/257).
The corresponding
surface densities of X–ray emitting EROs are arcmin-2 (6 over 380 arcmin2) and
arcmin-2 (7 over 300 arcmin2) at
and , respectively.
The fraction of X–ray detected EROs in K–selected samples
has been reported by Alexander et al. (2002; hereafter A02) and
Roche, Almaini & Dunlop (2003; hereafter R03).
A02 detected 6/29 EROs444We note that
these authors adopted an selection for the definition
of their EROs sample, that roughly corresponds to a
selection. (21%) in the
Chandra Deep Field–North (CDF–N) observation,
where the –band limit is about one
magnitude fainter () and the X–ray limiting flux is about
one order of magnitude deeper than in our observation, with a
corresponding limiting luminosity of L erg cm-2 s-1 at z=1.
At the faint X–ray fluxes probed by ultra–deep Chandra exposures,
starbursts and normal elliptical galaxies start to be detected
and they are usually characterized by softer X–ray
colors; a conservative estimate of the
fraction of AGN powered EROs in the CDF–N based on the hard X–ray
detections and luminosities (see also Sect. 5) is
14% (A02; Vignali et al. 2002).
| K(lim) | F2-10keV(lim) | area | N(EROs) | N(EROs) | % |
| erg cm-2 s-1 | arcmin2 | K–selected | X–ray detected | ||
| This work: | |||||
| 18.8 | 4 | 380 | 173 | 6 | 3.5% |
| 19.2 | 4 | 300 | 216 | 7 | 3.2% |
| all sample | 4 | 380 | 257 | 9 | 3.5% |
| A02†: | |||||
| 20.1 | 2 | 70 | 29‡ | 4 | 14% |
| R03†: | |||||
| 21.5 | 4 | 50 | 179 | 12 | 6.6% |
†: AO2: Alexander et al. 2002; R03: Roche, Almaini & Dunlop
2003.
‡: selected on the basis of a criterion.
From the R03 sample it is possible to estimate the fraction of
hard X–ray detected EROs in the CDF–S GOODS area, at an X–ray limiting flux
comparable to that of the CDF–N sample but extending down to significantly
fainter near–infrared magnitudes (): about 6.6% of the
-selected EROs are associated with hard X–ray sources.
Even if the estimates from A02 and R03
at the faintest K magnitudes are obtained over
very small areas and may suffer from substantial cosmic variance,
the differences in the fractions of X–ray detected EROs observed
in these three samples are likely to be mainly due to the
combination of different X–ray and near–infrared limiting fluxes, as
discussed in Sect.4.3.
With XMM–Newton and Chandra surveys, the fraction of optical
counterparts with extremely red colors has significantly increased
with respect to the first examples of EROs found in deep ROSAT
observations in the Lockman Hole (Lehmann et al. 2001).
The present data imply that a fraction of the order of about
16–18% of the hard X–ray selected XMM–Newton sources exhibit RK colors
(9/55 or 9/49 considering only the secure X–ray to optical associations).
Our results are in agreement with those reported by Mainieri et al. (2002)
in the Lockman Hole:
12/53 (23%) of hard X–ray selected sources are associated with EROs,
at limiting near–infrared and X–ray fluxes comparable with those
of the present sample.
This fraction is about the same in the R03 sample
() and in the CDF–N sample (%, from the Barger et
al. 2003 catalog).
4 Multiwavelength properties of AGN EROs
4.1 The “literature sample” of hard X–ray detected EROs
In order to investigate the nature of hard X–ray selected EROs and the link between faint hard X–ray sources and the ERO population, we have collected all the literature multiwavelength data available to date for EROs individually detected in the hard (2–10 keV) X–rays and selected on the basis of a RK criterion. More specifically:
-
1) Seventy EROs detected in the 2–8 keV band in the CDF–N observation, from the Barger et al. (2003) catalog; 9 have spectroscopic redshifts and 25 have photometric redshift estimates;
-
2) Twenty–two hard X–ray detected EROs in the Chandra Deep Field–South (CDF–S) observation, from Szokoly et al. (2004); 8 have spectroscopic redshift;
-
3) Twelve EROs detected in the hard (2–10 keV) band in the XMM–Newton Lockman Hole observation (Mainieri et al. 2002); 2 have spectroscopic redshifts and 3 have photometric redshift;
-
4) Ten hard X-ray detected EROs from the Hellas2Xmm survey selected on the basis of an X–ray to optical flux ratio X/O and R; all of them with redshifts estimated on the basis of the observed RK colors (Mignoli et al. 2004);
-
5) Five additional hard X-ray detected EROs available in the literature (“additional sample”: Gandhi et al. 2004; Crawford et al. 2002; Brusa et al. 2003; Willott et al. 2003); 4 have spectroscopic redshifts and 1 photometric redshift.
This literature sample consists of 128 EROs,
including the 9 EROs discussed in the present work, detected in the
2–10 keV band; for 62 of them photometric or spectroscopic redshifts
are available.
This sample is by no means homogeneous and complete,
but can be considered representative of EROs individually
detected in the X–rays.
4.2 X–ray to optical/near–infrared properties of AGN EROs
This enlarged ERO sample spans a wide range of optical and
hard X–ray fluxes.
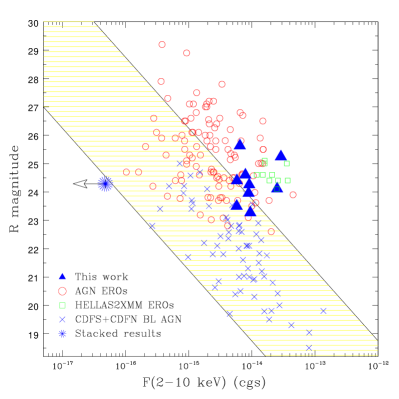
The R–band magnitudes plotted versus the hard X–ray
fluxes for all the 128 EROs in the literature sample are reported
in Fig. 4 (left panel): the 9 EROs from this work are
reported as triangles, the 10 EROs from the Hellas2Xmm survey
as squares and the remaining objects as circles.
In the same figure, the sources
classified as broad line (BL) AGN in the CDF–N and CDF–S optical
catalogs (Barger et al. 2003; Szokoly et al. 2004) are also reported
as crosses.
X–ray detected EROs show an average
ratio between the X–ray and optical fluxes555The R–band flux is computed by
converting R magnitudes into monochromatic fluxes and then multiplying
them by the width of the R filter (Zombeck 1990).
For a given X–ray energy
range and R–band magnitude the following relation holds:
where fX is the X–ray flux, R is the optical magnitude and
const depends only on the R–band filter used
in the optical observations;
an indicative, average value is const=5.5
(see Hornschemeier et al. 2000) and it can be used when datasets from
different observations are compared. (X/O)
around X/O10, about one order of magnitude higher than that
found for BL quasars by ROSAT (Hasinger et al. 1998;
Lehmann et al. 2001) and recently extended by Chandra and
XMM–Newton observations
(Alexander et al. 2001; Rosati et al. 2002; crosses in
Fig. 4). We note that
the same shift with respect to the majority of quasar population is observed
also excluding the 10 Hellas2Xmm sources selected on the basis of
their high X/O ().
The observed X–ray to optical properties of X–ray detected EROs
are different also from that of the majority of near–infrared
selected EROs:
the results of the stacking analysis of EROs
not individually detected in the X–rays in the K20
survey (asterisk in Fig. 4)
led to an average X/O which is at least two order of magnitudes
lower than that of the EROs in the present sample
(Brusa et al. 2002; see also Alexander et al. 2002).
Obscured accretion at high redshifts is the most likely
mechanism for explaining
the observed X–ray to optical properties.
Moving the Spectral Energy Distribution (SED) of an X–ray absorbed
AGN to progressively higher redshifts the K–corrections
in the optical and X–ray band work in the opposite direction.
The ratio between the optical to X-ray optical depth, in the observer frame,
scales roughly as , because dust extinction increases in
the UV while X-ray absorption strongly decreases going toward high
energies. The net result is that in the presence of an absorbing
screen the observed optical flux of a high-z AGN can be strongly
reduced, and the observed magnitudes are mainly due to starlight in
the host galaxies.
Conversely, the 2-10 keV X-ray flux can be much
less reduced. Many extreme X-ray to optical ratio sources could then
be highly obscured quasar, i.e. type 2 QSO
(Fiore et al. 2003; Comastri, Brusa & Mignoli 2003).
The observed high values of the X/O are therefore at least
qualitatively consistent with those expected by a
population of high redshift, absorbed AGN with X–ray column densities
in the range NH=1022- cm-2
(see also Sect. 5).
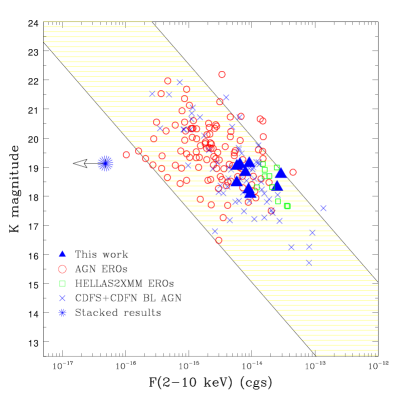
The right panel of Fig. 4 shows that in the
K–band magnitude vs. X–ray flux plane the X–ray detected EROs
occupy essentially the same region as the broad-line AGN,
with an average X–ray to near infrared ratio (X/K) of the order of 1.
Given that the K–band is less affected by absorption, the
fact that AGN EROs are indistinguishable from the overall quasar
population in this plane supports the hypothesis that their high
X/O ratios are mainly due to significant nuclear
extinction in the optical band (see also Mainieri et al. 2002).
Moreover, the observed X/K correlation implies that, for a given
hard X–ray flux, the magnitude can
be predicted reasonably well ( mag) with a single
relation both for broad line and ERO AGN.
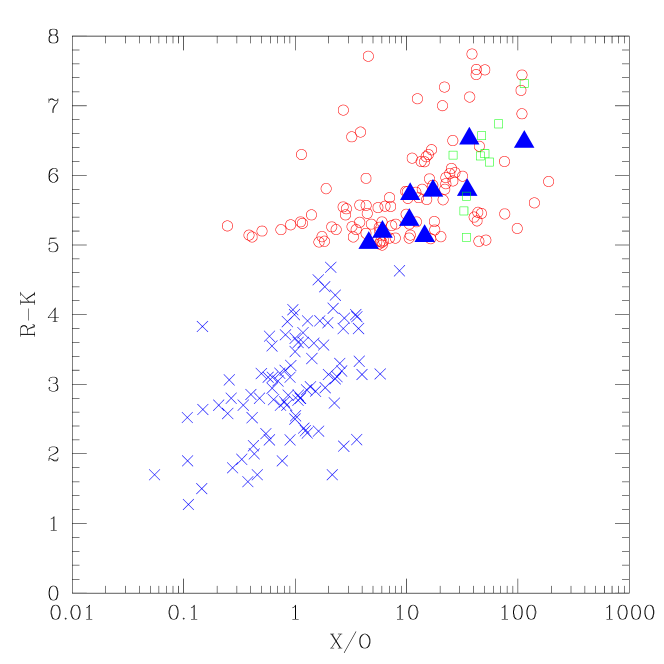
The relationship between the hard X–ray and near–infrared fluxes
can also explain the trend observed between the R–K
colors and the X/O for all the EROs
in the literature sample compared with that observed for BL AGN
(Fig. 5): the higher the X/O is, the redder the source is.
4.3 AGN in K–selected EROs samples
It has been already pointed out, on the basis of a handful of isolated
cases, that the optical and near infrared
properties of EROs hosting an AGN are indistinguishable
from the overall EROs population both from a spectroscopic and
photometric point of view (Brusa et al. 2002; Cimatti et al. 2003;
Mignoli et al. 2004).
This seems to apply also to the average redshifts and absolute
luminosities of AGN EROs when compared to the general EROs population.
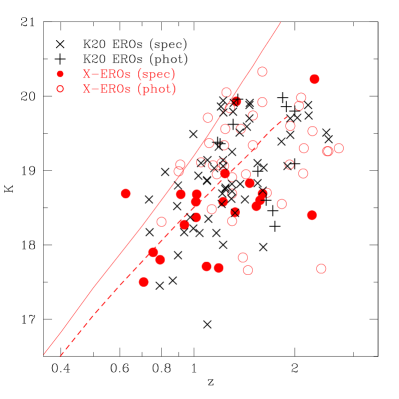
Figure 6 (left panel) shows
the K-z plane for the 62 AGN EROs with redshift information (26
spectroscopic and 36 photometric) discussed in the present work
compared with all the EROs detected in a K–selected survey,
the K20 survey (Cimatti et al. 2003), for which
spectroscopic or reliable photometric redshifts are available.
Although this figure shows objects from samples with different
limits, it allows us to conclude that X–ray detected EROs appear to be
largely indistinguishable from the general non–AGN EROs population,
both classes being brighter than typical local (z=0) galaxies
(Cole et al. cole (2001); continuous line) and, on average, similar to
evolved galaxies at (Pozzetti et al. K20_5 (2003);
dashed line), and spanning on average a similar range in the redshift
distribution (z=0.72.5).

On the basis of the considerations above, we can conclude that
the X–ray emission can be considered the only reliable tracer of
AGN activity in the EROs population, for which an accurate analysis
at longer wavelengths is generally hampered by the faintness of the
optical counterparts.
Therefore, assuming that the observed distribution of the X/ ratios
(X/K=0.1-10, see Fig. 4) is representative of the AGN
EROs population, it is possible to derive an estimate of the
fraction of AGN EROs among –selected samples, as a
function of the K–band magnitude only and independent from
the X–ray limiting fluxes.
Indeed, given that the ratio between the 2–10 keV and limiting
fluxes in our XMM–Newton sample is X/K,
only about half of the shaded area in the right panel of
Fig. 4 is sampled at K, and
a bias against sources brighter than and
with F erg cm-2 s-1 is
present.
We have therefore “corrected” the estimated fraction of AGN EROs
reported in Sect. 3 taking into account the
observed distribution of the X–ray to near–infrared ratios:
the fraction of AGN EROs at rises up to 7%.
In the same way, it is possible to statistically “correct” the
observed values in the A02 and R03 samples already reported in
Sect. 3, in order to derive the AGN fraction at
K=20.1 and K=21.5, respectively.
At the limiting fluxes of the A02 sample, the X/K ratio is , while at the R03 sample limiting fluxes,
the observed X/K is .
Combining the depth of the two different samples with the
observed X–ray to optical flux ratios distribution, the estimates of
the fraction of AGN among EROs in the A02 and R03 samples rise up
to (15)% and (196%), respectively.
In the right panel of Fig. 6 these fractions
for the three samples are shown at representative
K–band magnitudes.
Even if the statistical error bars are large,
Figure 6 suggests that the fraction of AGN EROs among the
K–selected EROs population is an increasing function of the
K–band magnitude.
The results from hard X–ray surveys indicate a space density
of low–luminosity (10 erg s-1) AGN
almost two order of magnitudes higher than that of high luminosity sources
(Fiore et al. 2003; Ueda et al. 2003).
Thus, it is not surprising that the fraction of AGN EROs increases
going toward faint fluxes (i.e., lower luminosities).
Finally, it is worth remarking that the fraction of “active” objects in
K–selected EROs samples can be used to constrain models which link
the formation and evolution of galaxies and AGN (e.g. Granato et
al. 2004).
5 X–ray Properties of AGN EROs
In order to check whether X-ray absorption is common among hard X–ray
detected EROs, we have quantitatively measured the intrinsic X–ray
column densities for the 62 EROs with a spectroscopic or
photometric redshift available in the literature sample
described in Sect. 4.1.
Column densities for the sources detected in the CDF–N and CDF–S have
been obtained by fitting the observed counts with a single power law
model plus absorption at the source redshift.
When the quality of the X-ray spectra in terms of S/N ratio was not
sufficient to use the standard statistic (a limit of
150 counts over the 0.5–8 keV band has been assumed), the C-Statistic
was used (Cash 1979).
In this case the power–law spectral index has been fixed at =1.9.
For the sources from the Lockman Hole, the Hellas2Xmm and the
“additional” sample, the best–fit values quoted by the authors have
been adopted.
In all the cases, 2–10 keV luminosities were estimated from
the observed X–ray fluxes and corrected for absorption.
The results are reported in Fig. 7.
Almost all of the individually detected EROs are consistent with
intrinsic column densities in excess of 1022 cm-2, and
they actually are heavily obscured AGN.
This study statistically confirms previous evidences, some of which
based on HR analysis (Alexander et al. 2002) and on
spectral analysis (e.g. Vignali et al. 2003; Gandhi et al. 2004;
Willott et al. 2003; Stevens et al. 2003; Severgnini et al. in prep),
and unambiguously indicates
that large columns of cold gas (even cm-2) are the rule rather
than the exception in EROs individually detected in the X–rays.
5.1 EROs and QSO2: a selection criterion
Given the high redshift (z) and the X–ray flux of these objects,
it follows that the majority of X–ray
detected EROs have high X–ray luminosities (L erg
s-1, see Fig. 7). Moreover, according to our analysis,
a large fraction of the objects analysed in this work
for which redshift information is available have X–ray
luminosities even larger than erg s-1, and
therefore well within the quasar regime.
The large intrinsic column densities further imply that AGN EROs,
selected at the brightest X–ray fluxes, have properties
similar to those of quasars 2 (QSO2), the high–luminosity,
high redshift type II AGNs predicted by X–ray background synthesis
models and necessary to reproduce the 2–10 keV source counts
at relatively bright fluxes (e.g. Comastri et al. 2001; Gilli, Salvati
& Hasinger 2001).
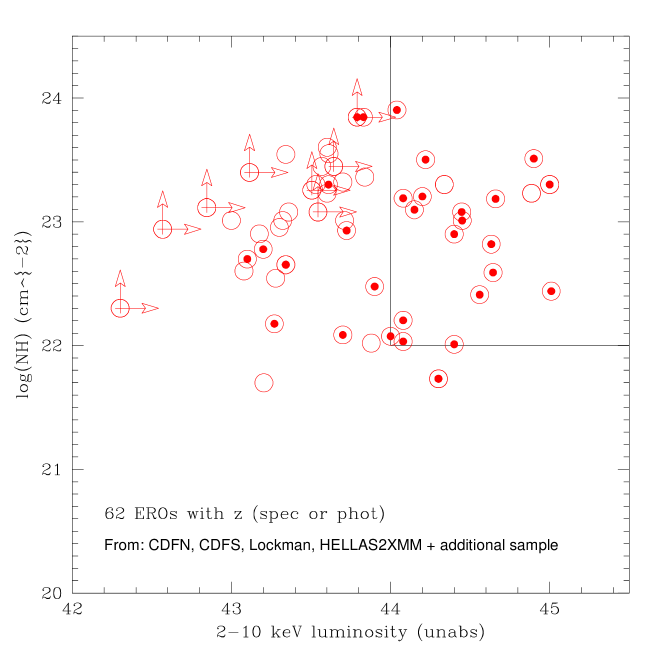
On the basis of unified schemes, type II quasars are expected to be luminous, narrow–line, high–redshift objects with substantial (N cm-2) X–ray column densities. However, at the faint fluxes/magnitudes of deep surveys the optical identifications of these objects is very difficult, unless one of the strong emission lines is present in the optical spectrum. Our analysis suggests that an efficient method to pick up this elusive population is the combination of medium–deep X–ray observations and K–band imaging: among hard X–ray sources, one must select those counterparts with an RK color — that is an indication of high redshift and obscuration — and with an X/O ratio — that is an indication of high column densities and high luminosity (see also Severgnini et al. 2004; Gandhi et al. 2004). This is shown in Fig. 7, where EROs with X/O are reported as filled symbols and populate the upper right region of the diagram (the “QSO2 locus”). The present work therefore confirms that a selection on the basis of X/O is a powerful tool to detect high–luminosity, highly obscured sources as already pointed out by Fiore et al. (2003), and it is even stronger when coupled with a previous selection on the basis of extremely red colors.
It is important to stress that
EROs with high X/O can be QSO2, but it is not true that all the QSO2
are EROs. As an example, the prototype of high–redshift QSO2,
CDFS_202 in Norman et al. (2002), has RK2.5.
In this case the rather blue observed colour is mainly due to the
presence of a strong emission line in the R filter.
When the line flux is
subtracted, the RK colour of CDFS_202 is RK4, which makes
this object appreciably red.
The close link between X–ray bright EROs and type 2 quasars
allows us to elaborate on the contribution of EROs to
the population of high luminosity, highly obscured quasars.
We have considered only the sources with redshift
information detected in the CDFN, CDFS, and in the Lockman Hole. In
addition, using the method
extensively discussed by Fiore et al. (2003)
based on the relation between the X/O and the X–ray luminosity,
we have derived the redshifts and luminosities also for the 9 hard
X–ray detected EROs in our XMM–Newton observation.
All but two have unabsorbed X–ray luminosities larger than 1044 erg
s-1 and lie in the redshift range z=1-3.
To estimate the contribution of EROs to the QSO2 population we
have chosen a 2–10 keV limiting flux of
erg cm-2 s-1, in order to ensure a flat and uniform
sky coverage down to fluxes where about half of the XRB flux is
resolved.
The most recent published determinations of the space density of type 2
quasars at fluxes brighter than this limit are in the range 40–50
deg2 (Perola et al. 2004; Padovani et al. 2004) while the
prediction from the Ueda et al. (2003) model is deg-2
(private communication).
From our analysis, a total of 6 EROs over an area of about 0.4
deg2 have been detected at fluxes erg cm-2 s-1 and
classified as QSO2, i.e. they have cm-2 and
unabsorbed L
1044 erg s-1.
Therefore, the surface density of luminous, obscured EROs
is about 15 deg-2, and it has to be regarded as a robust lower
limit given the lack of redshift information for some of the EROs in
the present sample.
This work therefore indicates that AGN EROs represent at least
20% of the type 2 quasars population, if compared to the Ueda et
al. (2003) predictions, and it can be as high as 40% when compared
with the recently published estimates (Padovani et al. 2004; Perola et
al. 2004).
5.2 X/K correlation and the accretion parameters of AGN EROs
While there is not a clear trend between the X–ray flux
and optical magnitude (left panel of Figure 4),
a linear correlation
characterized by a relatively small scatter
appears to be present between the X–ray and the K–band fluxes
(right panel of Figure 4).
This relation is present despite the large redshift range
(e.g. ) of our sources
and may reflect a proportionality also
between the luminosities, .
Such a correlation is reminiscent of the ones observed
locally between the BH mass and the global
galaxy properties (Magorrian et al.
1998; Gebhardt et al. 2000; Ferrarese & Merritt 2000; Marconi & Hunt
2003) and may be related to them.
In order to test such a possibility with a conservative approach
we have considered those EROs with a secure spectroscopic identification in
the comparison sample and the 9 EROs in our XMM–Newton
observation, using the Fiore et al. (2003) relation to
estimate their redshifts.
Although EROs and bluer AGN have similar
X/K ratio, a result somehow surprising given that both
the active nucleus and the host galaxies are contributing to the
-band light presumably in different ratios, we limit our analysis to EROs
since there are several indications that the near–infrared emission of
these X–ray selected obscured AGN is dominated by their host
galaxy starlight (see e.g. Mainieri et al. 2002; Mignoli et al. 2004).
The rest–frame K–band luminosities have been computed
using an evolving elliptical galaxy template
to properly account for the K–corrections666
Note that in the K–band the K–corrections are relatively insensitive to
galaxy type and fairly small up to z. (Bruzual & Charlot 2003).
The results are shown in Fig. 8.
The correlation between the near–infrared and
X–ray luminosities observed for these high–redshift EROs
(i.e. ) closely
resembles the one recently published by Marconi & Hunt (2003)
between the BH mass and the K band luminosity for a sample of local galaxies.
Assuming that the X–ray luminosity of our AGN EROs is proportional
to the BH mass (i.e. the Eddington ratio L/LEdd and the bolometric
correction 777The absorption corrected X–ray
luminosity can be translated into a bolometric luminosity assuming
a bolometric correction factor (L).
are not a strong function of the BH mass)
the observed correlation plotted in Fig. 8
implies L.
It is thus formally possible to
tentatively constrain the BH masses and the accretion parameters that
would follow if also the normalization of such relation does not
significantly evolve with redshift, if not for the expected change of
stellar mass to light ratio of the host galaxies due to the evolution
of the stellar populations (our AGN EROs sample being at –2).
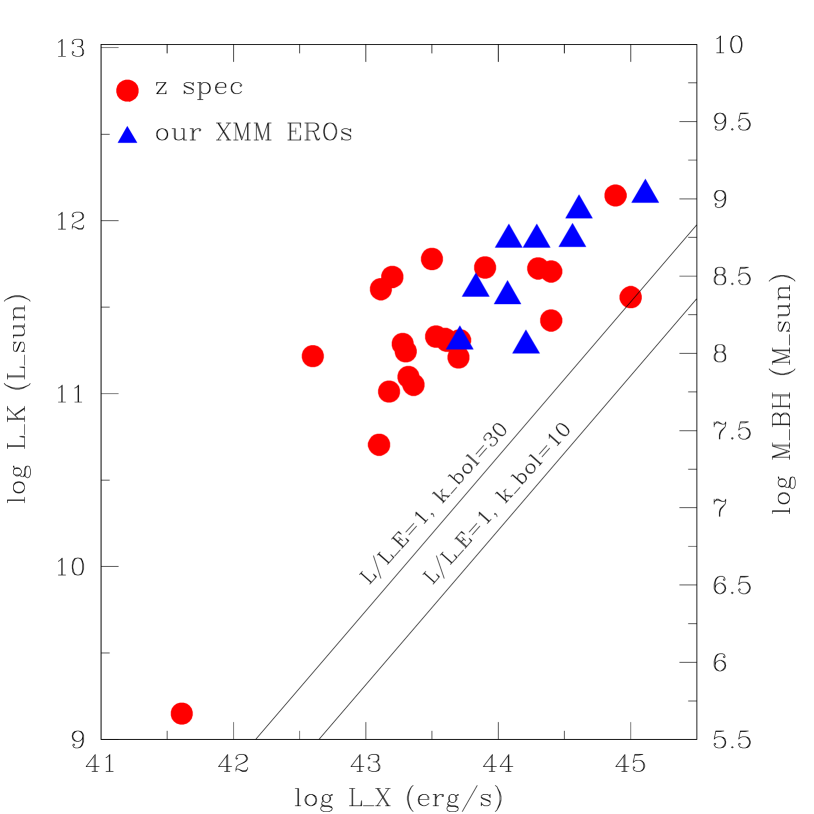
The resulting MBH are reported in the right axis of
Fig. 8.
The two continuous lines in Fig. 8 represent
the relation between the BH mass and X–ray luminosity
computed for Eddington limited accretion ()
and for two
different values (=30 and =10) of the bolometric
correction. The first value is from the Quasar SED compilation of
Elvis et al. (1994) and can be considered a reliable correction
for bright unobscured quasars.
The second appears to be appropriate for lower luminosities (L-1044 erg s-1) Seyfert like galaxies (Fabian 2004)
and a few heavily obscured, luminous sources (Comastri 2004).
The value observed for our objects can be reasonably well explained by
a spread in the Eddington ratios in the range
, with a median value of
for k and 30, respectively.
Both the BH masses and the Eddington ratios derived above
are consistent with a scenario in which X–ray detected
EROs are obscured quasars emitting in a radiatively efficient way,
in agreement with the results
of Merloni (2004) and McLure & Dunlop (2004).
These findings are broadly consistent with those obtained, with completely
different methods by Woo and Urry (2002) for a large sample of broad
line AGN (see their Figure 8).
Although the discussion above has been conducted only in a
qualitative way and neglecting the uncertainties and scatter
associated to the observed relations, it appears fully reasonable
that the close correlation that we have detected between the X–ray flux and
the K–band magnitude of AGN EROs is the high redshift analogous
of the correlations observed locally,
implying a close connection between the black hole
and AGN host galaxies also at earlier epochs ().
6 Summary
In this paper we have presented the results from an 80 ks XMM–Newton observation of the largest sample of near–infrared selected
EROs available to date down to a K–band magnitude limit of K=19.2
(Daddi et al. 2000).
The moderate–deep exposure and the high energy throughput of
XMM–Newton, coupled with its large field of view, allowed us to detect,
for the first time on a statistically significant sample,
AGN–powered EROs at relatively bright X–ray
fluxes.
At the limiting fluxes probed by our survey (F and ) the fraction of AGN EROs
within near–infrared selected ERO samples is 3.5%.
Conversely, a significant fraction of the optical counterparts of hard X–ray
selected sources are EROs and the fraction of extremely red objects among
the X–ray population is much higher (%).
The average hardness ratio of the hard X–ray detected EROs in the
XMM–Newton observation suggest substantial column densities at the source
redshift.
In order to place our results in a broader context,
we have also considered additional samples of X–ray detected EROs
available in the literature from published deep
and medium deep hard X–ray surveys.
A total of 128 X–ray detected EROs have been considered, and
for the first time the average X–ray, optical and near–infrared
properties of AGN–powered EROs have been derived on a statistically
significant sample.
The most important results of our analysis are summarized in the following:
-
The average X–ray to optical flux ratio of AGN EROs is about one order of magnitude larger than that observed for BL AGN. On the contrary, when the X–ray to near–infrared properties are considered, all the EROs in the comparison sample occupy a locus which is indistinguishable from that occupied by unobscured QSO.This results further corroborates the hypotheses that AGN EROs are obscured quasars.
-
High obscuration in X–ray detected EROs is also revealed in the X–ray band, in agreement with the results from the optical band: the majority of the sources with known redshifts of the comparison sample have N cm-2, and about half even in excess than 1023 cm-2. The observed X–ray fluxes and spectral shapes imply unabsorbed, rest frame X–ray luminosities in the range 1042–1045 erg s-1. At fluxes larger than 10-14 erg cm-2 s-1, we estimate that AGN EROs contribute at least 20% (and possibly up to 40%) to the QSO2 population. A selection criterion based on the X/O and the RK colour of hard X–ray selected sources has been proposed, to efficiently pick–up this elusive population of highly obscured quasars that are one of the key ingredient of XRB synthesis models.
-
Assuming that the observed X/K distribution of EROs is representative of the AGN EROs population, and combining our results with those of A02 and R03, we found an evidence of an increase of the fraction of AGN EROs in K–selected EROs samples as a function of the K–band magnitude, ranging from % at =19 to % at .
-
The close relation uncovered between the K- and X-ray band fluxes of AGN EROs suggests that the connection between the properties of the host galaxies and central black holes observed locally holds also at higher redshifts (). This allows an estimate of the BH masses and Eddington ratios for the sources with known redshift through reasonable assumptions. The results indicate that the majority of AGN powered EROs have BH masses larger than 5 M⊙, and are accreting with a median value of Lbol/L.
All the findings discussed above support the idea that
hard X–ray surveys coupled with near–infrared observations
provide an efficient method in detecting QSO2. Furthermore,
X–ray detected EROs can be used as lighthouses to
investigate the accretion paradigm at high redshifts to address the
issue of elliptical galaxy formation and the expected co-evolution
with the accreting black-holes.
In particular, systematic studies of the relationship
between EROs and QSO2 are needed
to quantitatively investigate the
link between the formation of massive elliptical galaxies and the
onset of AGN activity.
X–ray observations of large samples
of –selected EROs would be crucial to compute the fraction of
X–ray active EROs on the widest area possible (to avoid cosmic
variance). Conversely, deep optical and near–infrared follow–up of complete
samples of hard X–ray selected sources with extreme X/O
will definitively assess the fraction of reddened
sources among the XRB constituents.
The full exploitation of the COSMOS multiwavelength database
will be in the near future the best
strategy to investigate both these issues. The large
area covered ( deg2) will allow a detailed study of the
clustering properties of these objects and would shed new light on the
link between nuclear activity and galaxy evolution.
Acknowledgements.
We gratefully acknowledge the K20 team for providing their data, and Y. Ueda for providing his model predictions. MB and AC kindly acknowledge support by INAOE, Mexico, during the 2003 Guillermo-Haro Workshop where part of this work was performed. MB acknowledges partial support from the Deutscher Akademischer Austausch Dienst (DAAD, German Academic Exchange Service) under the project: “New Frontiers in Science”. The XMM-Newton Helpdesk and the entire XMM–Newton team, in particular B. Altieri, M. Guainazzi and G. Vacanti, are kindly acknowledged for their help with astrometry problems. The authors acknowledge partial support by ASI I/R/057/02 and MIUR COFIN–03–02–23 contracts, and INAF 270/2003 grant.References
- (1) Alexander, D.M., Brandt, W.N., Hornschemeier, A.E., et al. 2001, AJ, 122, 2156
- (2) Alexander, D.M., Vignali, C., Bauer, F.E., Brandt, W.N., Hornschemeier, A.E., Garmire, G.P., & Schneider, D.P., 2002, AJ 123, 1149 (A02)
- (3) Baldi, A., Molendi, S., Comastri, A., et al. 2002, ApJ, 564, 190
- (4) Barger, A.J., Cowie, L. L., Capak, P., et al. 2003, AJ, 126, 632
- (5) Brusa, M., Comastri, A., Daddi, E., Cimatti, A., Mignoli, M., & Pozzetti, L. 2002, ApJ, 581, L89
- (6) Brusa, M. 2003, AN, 324, 116;
- (7) Brusa, M., Comastri, A., Mignoli M., et al. 2003, A&A, 409, 65
- (8) Bruzual, A.G., & Charlot, S., 2003, MNRAS, 344, 1000
- (9) Cash, W. 1979, ApJ, 228, 939
- (10) Ciliegi, P., Zamorani, G., Hasinger, G., Lehmann, I., Szokoly, G., & Wilson, G. 2003, A&A, 398, 901
- (11) Cimatti, A., Daddi, E., Mignoli, M., et al. 2002, A&A 381, L68
- (12) Cimatti, A., Daddi, E., Cassata, P., et al. 2003, A&A, 412, L1
- (13) Cole, S., Norberg, P., Baugh, C.M., et al., 2001, MNRAS, 326, 255
- (14) Comastri, A., Fiore, F., Vignali, C., Matt, G., Perola, G. C., & La Franca, F., 2001, MNRAS, 327, 781
- (15) Comastri, A., Brusa, M., & Mignoli, M. 2003, AN, 324, 28
- (16) Comastri, A., 2004, in “Supermassive Black Holes in the Distant Universe”, Ed. A. J. Barger. Kluwer Academic Publishers, Chapter 8, in press, astro–ph/0403693
- (17) Crawford, C.S., Gandhi, P., Fabian, A.C., Wilman, R.J., Johnstone, R.M., Barger, A.J., Cowie, L.L., 2002, MNRAS, 333, 809
- (18) Daddi, E., Cimatti, A., Pozzetti, L., et al. 2000, A&A, 361, 535
- (19) Dickey, J.M., & Lockman, F.J. 1990 ARA&A, 28, 215
- (20) Elston, R., Rieke, G.H., & Rieke, M.J., 1988, ApJ 331, L77
- (21) Elvis, M., Wilkes, B.J., McDowell, J.C., et al. 1994, ApJS, 95, 1
- (22) Fabian, A.C., 2004, in ”Coevolution of Black Holes and Galaxies”, Carnegie Observatories Astrophysics Series, Vol. 1, pag. 447, ed. L.C. Ho (Cambridge Univ. Press), astro-ph/0304122
- Ferrarese & Merritt (2000) Ferrarese, L. & Merritt, D. 2000, ApJ, 539, L9
- (24) Fiore, F., Brusa, M., Cocchia, F. et al. 2003, A&A, 409, 79
- (25) Franceschini, A., Hasinger, G., Miyaji, T., & Malguori, D., 1999, MNRAS, 310, L5
- (26) Gandhi, P., Crawford, C.S., Fabian, A.C., & Johnstone, R.M., 2004, MNRAS, 348, 529
- Gebhardt et al. (2000) Gebhardt, K., et al. 2000, ApJ, 539, L13
- (28) Gilli, R., Salvati, M., & Hasinger, G. 2001, A&A, 366, 407
- (29) Granato, G.L., Silva, L., Monaco, P., Panuzzo, P., Salucci, P., De Zotti, G., Danese, L., 2001, MNRAS 324, 757
- (30) Granato, G.L., De Zotti, G., Silva, L., Bressan, A. & Danese, L., 2004, ApJ, 600, 580
- (31) Hall, P.B., Yee, H.K.C., Lin, H., et al., 2000, AJ120, 2220
- (32) Hasinger, G., Giacconi, R., Gunn, J.E. et al. 1998, A&A, 340, L27
- (33) Hornschemeier, A.E., Brandt, W.N., Garmire, G.P., et al. 2000, ApJ, 541, 49
- (34) Jansen, F., Lumb, D., Altieri, B. et al. 2001, A&A, 365, L1
- (35) Kauffmann, G., 2004, in “Star Formation Through Time”, ASP Conference Proceedings, Vol. 297, p. 439, edited by E. Perez, R. M. Gonzalez Delgado and G. Tenorio-Tagle.
- (36) Koekemoer, A. M., Alexander, D.M., Bauer, F.E. et al. 2004, ApJ, 600, L123
- (37) Lehmann, I., Hasinger, G., Schmidt, M., et al. 2001, A&A, 371, 833
- (38) Lehmann, I., Hasinge,r G., Murray, S.S. & Schmidt, M., 2002, in Proceedings of “X-rays at Sharp Focus Chandra Science Symposium”, ASP Conf. Proc. 262, p. 105
- Magorrian et al. (1998) Magorrian, J., et al. 1998, AJ, 115, 2285
- (40) Mainieri, V., Bergeron, J., Hasinger, G., et al. 2002, A&A, 393, 425
- (41) Mannucci, F., Pozzetti, L., Thompson, D., et al. 2002, MNRAS 329, L57
- (42) Marconi, A., & Hunt, L., 2003, ApJ, 589, L21
- (43) Marconi, A., Risaliti, G., Gilli, R., Hunt, L.K., Maiolino, R., & Salvati, M., 2004, MNRAS, 351, 169
- (44) McLure, R.J., & Dunlop. J.S., 2004, MNRAS, 352, 1390
- (45) Menci, N., Fiore, F., Perola, G.C., & Cavaliere, 2004, ApJ, 606, 58
- (46) Merloni, A., 2004, MNRAS, in press, astro–ph/0402495
- (47) Mignoli, M., Pozzetti, L., Comastri, A., et al. 2004, A&A, 418, 827
- (48) Miyazaki, M., Shimasaku, K., Kodama, T., et al. 2003, PASJ, 55, 1079
- (49) Norman, C., Hasinger, G., Giacconi, R., et al. 2002, ApJ, 571, 218
- (50) Padovani, P., Allean, M.G., Rosati, P., & Walton, N.A., 2004, A&A in press, astro–ph/0406056
- (51) Perola, G.C., Puccetti, S., Fiore, F., et al. 2004, A&A, 421, 491
- (52) Pierre M., et al., 2001, A&A 372, L45
- (53) Pozzetti, L. & Madau, P. 2000, in “The Extragalactic Infrared Background and its Cosmological Implications”, IAU Symposium 204, p. 71, eds. M. Harwitt & M. G. Hauser, astro–ph/0011359
- (54) Pozzetti, L., Cimatti, A., Zamorani, G., et al., 2003, A&A, 402, 837
- (55) Roche, N., Dunlop, J., & Almaini, O. 2003, MNRAS, 346, 803 (R03)
- (56) Rosati, P., Tozzi, P., Giacconi, R., et al. 2002, ApJ, 566, 667
- (57) Severgnini, P., Della Ceca, R., Braito, V. et al. 2003, proceedings of the Venice conference “Multiwavelength Mapping of Galaxy Formation and Evolution”, astro–ph/0312098
- (58) Smail, I., Owen, F.N., Morrison, G.E. et al. 2002, ApJ, 581, 844
- (59) Stevens, J.A., Page, M.J., Ivison, R.J., et al. 2003, MNRAS, 342, 249
- (60) Sutherland, W. & Saunders, W. 1992, MNRAS, 259, 413
- (61) Szokoly, G.P., Bergeron, J., Hasinger, G. et al. 2004, ApJS, in press, astro–ph/0312324
- (62) Thompson, D., Beckwith, S.V.W., Fockenbrock, R., et al. 1999, ApJ, 523, 100
- (63) Tozzi, P., Rosati, P., Nonino, M., et al. 2001, ApJ, 562, 42
- (64) Ueda, Y., Akiyama, M., Ohta, K., & Miyaji, T., 2003, ApJ, 598, 886
- (65) Vignali, C., Alexander, D.M., Bauer, F.E., Brandt, W.N., Hornschemeier, A.E., Garmire, G.P., & Schneider, D.P., proceedings of the 5th Italian AGN Meeting “Inflows, Outflows and Reprocessing around black holes” (2002), astro–ph/0209415
- (66) Willott, C., Rawlings, S., Jarvis, M.J., Blundell, K.M. 2003, MNRAS, 339, 397
- (67) Woo, J.H & Urry, C.M., 2002, ApJ, 579, 530
- (68) Yan, L., Thompson, D., & Soifer, B.T., 2004, AJ, 127, 1274
| ID | RA | DEC | 2–10 keV flux | hard counts | 0.5–2 keV flux | soft counts |
|---|---|---|---|---|---|---|
| (J2000) | (J2000) | (erg cm-2 s-1) | (erg cm-2 s-1) | |||
| 65 | 222.40211 | 9.14214 | 1.07e-13 | 823.4 38.1 | 7.07e-14 | 2685.5 65.2 |
| 246 | 222.52921 | 8.99011 | 5.54e-14 | 365.0 27.4 | 4.24e-14 | 1401.9 48.4 |
| 348 | 222.21439 | 8.89961 | 5.49e-14 | 350.6 27.0 | … | |
| 240 | 222.43640 | 8.99042 | 5.38e-14 | 524.5 31.3 | 4.03e-14 | 1873.8 55.1 |
| 300 | 222.29083 | 8.87070 | 4.58e-14 | 361.0 27.2 | 1.31e-14 | 508.1 30.9 |
| 321 | 222.42348 | 8.92257 | 3.93e-14 | 398.8 27.9 | 7.01e-15 | 349.3 26.7 |
| 226 | 222.35175 | 8.99408 | 3.13e-14 | 424.2 28.6 | 1.95e-14 | 1273.3 46.4 |
| 72 | 222.24762 | 9.12793 | 2.93e-14 | 205.8 22.3 | 7.03e-15 | 243.7 23.5 |
| 148 | 222.40685 | 9.05575 | 2.89e-14 | 332.3 26.0 | 1.52e-14 | 848.8 38.3 |
| 296 | 222.36632 | 8.94443 | 2.70e-14 | 328.0 25.7 | 1.01e-14 | 595.8 33.0 |
| 247 | 222.49405 | 8.98667 | 2.62e-14 | 214.5 22.5 | 1.44e-14 | 585.8 32.7 |
| 195 | 222.23718 | 9.02275 | 2.52e-14 | 228.2 22.9 | 5.13e-15 | 225.8 23.0 |
| 338 | 222.44652 | 8.90643 | 2.50e-14 | 175.3 20.7 | 1.92e-14 | 643.5 34.3 |
| 258 | 222.16916 | 8.97851 | 2.02e-14 | 119.7 19.4 | 1.75e-14 | 515.0 31.4 |
| 67 | 222.40207 | 9.13641 | 2.02e-14 | 146.0 19.7 | 1.60e-14 | 571.8 30.4 |
| 138 | 222.26871 | 9.06119 | 1.67e-14 | 157.3 19.8 | 9.36e-15 | 426.3 28.9 |
| 369 | 222.41972 | 8.87781 | 1.61e-14 | 115.2 18.4 | 6.06e-15 | 218.8 22.3 |
| 370 | 222.46298 | 8.87898 | 1.55e-14 | 110.3 18.7 | 9.65e-15 | 343.7 26.4 |
| 254 | 222.45338 | 8.98117 | 1.54e-14 | 127.7 18.5 | 1.14e-14 | 454.5 29.3 |
| 217 | 222.45128 | 8.99983 | 1.48e-14 | 156.2 19.6 | 9.91e-16 | 51.1 15.2 |
| 170 | 222.27676 | 9.04376 | 1.40e-14 | 144.9 19.5 | 6.31e-15 | 314.7 25.6 |
| 269 | 222.24794 | 8.96716 | 1.37e-14 | 128.3 19.2 | 8.73e-15 | 398.3 28.0 |
| 337 | 222.35938 | 8.90312 | 1.35e-14 | 102.2 17.3 | 5.91e-15 | 223.4 22.8 |
| 177 | 222.48996 | 9.03878 | 1.33e-14 | 95.3 16.9 | 1.13e-14 | 393.5 27.4 |
| 169 | 222.35056 | 8.83613 | 1.21e-14 | 74.8 16.7 | 4.76e-15 | 143.8 19.5 |
| 350 | 222.28494 | 8.89601 | 1.17e-14 | 97.3 17.4 | 7.32e-15 | 296.4 25.2 |
| 361 | 222.40059 | 8.89156 | 1.15e-14 | 96.0 17.3 | … | |
| 326 | 222.31322 | 8.87259 | 1.11e-14 | 90.7 17.7 | 3.80e-15 | 153.3 20.5 |
| 367 | 222.39218 | 8.88237 | 1.02e-14 | 91.5 17.6 | 4.84e-15 | 213.2 22.5 |
| 66 | 222.41061 | 9.13401 | 1.02e-14 | 81.4 16.7 | 6.70e-15 | 262.6 24.1 |
| 150 | 222.29356 | 9.05019 | 1.00e-14 | 110.7 18.3 | … | |
| 219 | 222.49629 | 8.99483 | 9.95e-15 | 80.7 16.9 | 4.52e-15 | 181.8 20.9 |
| 209 | 222.39635 | 9.00872 | 9.48e-15 | 121.3 18.1 | 6.61e-15 | 408.4 27.8 |
| 293 | 222.35324 | 8.94158 | 9.13e-15 | 109.7 17.7 | … | |
| 181 | 222.45479 | 9.03205 | 9.01e-15 | 90.8 17.1 | 2.19e-15 | 108.0 18.3 |
| 239 | 222.30937 | 8.85337 | 8.90e-15 | 63.4 16.7 | 2.63e-15 | 93.1 17.8 |
| 362 | 222.43134 | 8.88969 | 8.86e-15 | 69.1 15.9 | 1.89e-15 | 73.9 16.7 |
| 23 | 222.37926 | 9.17607 | 8.59e-15 | 54.5 16.4 | 1.72e-15 | 53.9 16.1 |
| 328 | 222.49466 | 8.91315 | 8.15e-15 | 57.8 16.3 | … | |
| 255 | 222.35718 | 8.97293 | 8.03e-15 | 105.8 17.6 | 6.89e-15 | 438.1 29.6 |
| 310 | 222.38539 | 8.87228 | 8.02e-15 | 68.0 16.4 | 4.95e-15 | 207.2 22.1 |
| 288 | 222.33345 | 8.94491 | 8.00e-15 | 95.1 17.3 | 2.97e-15 | 171.2 20.8 |
| 175 | 222.32428 | 9.03741 | 7.91e-15 | 98.6 17.5 | 1.30e-15 | 77.9 16.6 |
| ID | RA | DEC | 2–10 keV flux | hard counts | 0.5–2 keV flux | soft counts |
|---|---|---|---|---|---|---|
| (J2000) | (J2000) | (erg cm-2 s-1) | (erg cm-2 s-1) | |||
| 360 | 222.33759 | 8.88898 | 7.85e-15 | 73.7 16.6 | … | |
| 357 | 222.42833 | 8.88944 | 7.54e-15 | 56.0 15.2 | 2.30e-15 | 86.2 17.1 |
| 152 | 222.36366 | 9.05004 | 7.49e-15 | 93.9 17.1 | … | |
| 330 | 222.45470 | 8.91179 | 7.43e-15 | 58.1 15.7 | 2.91e-15 | 111.0 18.2 |
| 168 | 222.26262 | 9.04336 | 7.20e-15 | 61.4 15.1 | 3.36e-15 | 136.8 18.7 |
| 186 | 222.39972 | 9.03090 | 7.19e-15 | 89.4 16.8 | 4.66e-15 | 280.5 25.5 |
| 244 | 222.26265 | 8.98473 | 7.10e-15 | 63.9 16.1 | 2.13e-15 | 94.5 17.6 |
| 178 | 222.27762 | 9.03575 | 6.99e-15 | 61.0 15.2 | 6.03e-15 | 257.4 23.4 |
| 249 | 222.29012 | 8.97873 | 6.57e-15 | 75.3 16.1 | 3.80e-15 | 210.7 22.3 |
| 146 | 222.41490 | 9.05666 | 6.48e-15 | 67.2 14.9 | 1.32e-15 | 65.9 16.1 |
| 210 | 222.39804 | 9.01260 | 6.01e-15 | 76.016.8 | 3.51e-15 | 21622.6 |
| 189 | 222.26312 | 9.02621 | 5.82e-15 | 56.8 15.3 | … | |
| 250 | 222.43520 | 8.97954 | 5.77e-15 | 65.0 15.9 | … | |
| 154 | 222.39172 | 9.05019 | 5.36e-15 | 64.7 16.0 | … | |
| 263 | 222.36026 | 8.97151 | 4.97e-15 | 65.1 15.9 | 6.59e-15 | 417.1 29.1 |
| 176 | 222.42131 | 9.03696 | 4.94e-15 | 48.4 13.4 | 4.02e-15 | 186.4 21.1 |
| 251 | 222.29750 | 8.97501 | 4.61e-15 | 53.8 14.7 | … | |
| 287 | 222.29202 | 8.94793 | … | 1.73e-14 | 917.7 40.0 | |
| 130 | 222.53807 | 9.07928 | … | 9.39e-15 | 270.6 25.0 | |
| 315 | 222.23370 | 8.92656 | … | 7.25e-15 | 277.1 24.3 | |
| 207 | 222.48463 | 9.01196 | … | 4.66e-15 | 173.4 20.4 | |
| 179 | 222.17657 | 9.03417 | … | 3.86e-15 | 118.9 18.2 | |
| 242 | 222.35513 | 8.98782 | … | 3.73e-15 | 242.6 24.0 | |
| 344 | 222.23007 | 8.90152 | … | 3.49e-15 | 120.8 19.1 | |
| 236 | 222.32793 | 8.85341 | … | 3.10e-15 | 116.4 18.3 | |
| 118 | 222.18839 | 9.08308 | … | 3.05e-15 | 55.2 14.5 | |
| 68 | 222.31238 | 9.12831 | … | 3.01e-15 | 123.7 18.9 | |
| 103 | 222.27232 | 9.09741 | … | 2.95e-15 | 112.3 18.1 | |
| 94 | 222.43176 | 9.10102 | … | 2.81e-15 | 106.3 17.6 | |
| 363 | 222.46669 | 8.88736 | … | 2.71e-15 | 98.7 17.9 | |
| 157 | 222.23582 | 9.04881 | … | 2.45e-15 | 93.6 18.1 | |
| 289 | 222.44258 | 8.85969 | … | 2.39e-15 | 83.0 16.9 | |
| 273 | 222.18602 | 8.96340 | … | 2.35e-15 | 79.0 17.2 | |
| 301 | 222.32642 | 8.93808 | … | 2.29e-15 | 127.4 18.3 | |
| 125 | 222.37196 | 9.07913 | … | 2.27e-15 | 123.3 19.2 | |
| 259 | 222.34473 | 8.97245 | … | 2.26e-15 | 141.7 20.5 | |
| 198 | 222.49577 | 9.01764 | … | 2.07e-15 | 59.0 15.4 | |
| 77 | 222.34190 | 9.11713 | … | 2.05e-15 | 92.5 17.6 | |
| 139 | 222.39677 | 9.06015 | … | 2.03e-15 | 114.3 18.8 | |
| 107 | 222.23544 | 9.09159 | … | 2.02e-15 | 77.3 16.9 | |
| 28 | 222.27783 | 9.16305 | … | 2.01e-15 | 65.5 16.5 | |
| 298 | 222.30969 | 8.94036 | … | 1.96e-15 | 106.5 18.3 | |
| 319 | 222.28975 | 8.92027 | … | 1.84e-15 | 71.6 16.1 | |
| 180 | 222.31946 | 9.03277 | … | 1.82e-15 | 92.5 17.5 |
| ID | RA | DEC | 2–10 keV flux | hard counts | 0.5–2 keV flux | soft counts |
|---|---|---|---|---|---|---|
| (J2000) | (J2000) | (erg cm-2 s-1) | (erg cm-2 s-1) | |||
| 203 | 222.31351 | 9.01312 | … | 1.72e-15 | 103.6 17.3 | |
| 73 | 222.26277 | 9.12213 | … | 1.64e-15 | 60.9 15.6 | |
| 122 | 222.48824 | 9.08229 | … | 1.63e-15 | 58.4 15.8 | |
| 158 | 222.25018 | 9.04792 | … | 1.45e-15 | 56.6 15.2 | |
| 61 | 222.33221 | 9.13775 | … | 1.43e-15 | 57.5 15.7 | |
| 282 | 222.22620 | 8.94736 | … | 1.41e-15 | 49.5 15.2 | |
| 303 | 222.36115 | 8.93673 | … | 1.38e-15 | 79.3 17.7 | |
| 129 | 222.40413 | 9.07376 | … | 1.32e-15 | 70.3 16.3 | |
| 241 | 222.21678 | 8.98637 | … | 1.27e-15 | 50.5 15.6 | |
| 237 | 222.33328 | 8.98678 | … | 1.03e-15 | 65.0 16.3 |
Notes: ID = X–ray source identifications; RA, DEC = X–ray coordinates.
| ID | RA(X) | DEC(X) | (X-O) | R | K | LR(R) | LR(K) |
|---|---|---|---|---|---|---|---|
| 65 | 222.40211 | 9.14214 | 1.68 | 19.74 | 17.94 | 39.98 | 15.98 |
| 246 | 222.52922 | 8.99011 | 2.22 | 19.55 | 17.15 | 29.14 | 13.19 |
| 348 | 222.21437 | 8.89961 | 0.60 | 21.37 | 16.93 | 10.64 | 24.27 |
| 240 | 222.43642 | 8.99043 | 1.37 | 18.48 | 15.48 | 102.81 | 17.78 |
| 300 | 222.29082 | 8.87071 | 0.71 | 19.55 | 16.72 | 56.62 | 23.78 |
| 321 | 222.42348 | 8.92257 | 0.83 | 21.46 | 17.37 | 10.13 | 24.93 |
| 226 | 222.35179 | 8.99408 | 0.17 | 21.21 | 18.39 | 15.81 | 19.31 |
| 72 | 222.24759 | 9.12793 | 2.72 | 21.73 | 17.43 | 3.70 | 9.10 |
| 148 | 222.40681 | 9.05575 | 0.37 | 24.71 | 18.72 | 0.12 | 15.78 |
| 296 | 222.36630 | 8.94443 | 0.06 | 21.12 | 17.34 | 15.87 | 27.63 |
| 247 | 222.49402 | 8.98667 | 1.26 | 20.52 | 17.35 | 20.30 | 21.78 |
| 195 | 222.23720 | 9.02275 | 1.73 | 22.63 | 17.86 | 2.42 | 15.58 |
| 338 | 222.44647 | 8.90643 | 1.39 | 20.62 | 18.86 | 19.28 | 12.05 |
| 258 | 222.16920 | 8.97851 | 0.31 | 19.57 | 17.55 | 60.51 | 22.52 |
| 369 | 222.41971 | 8.87782 | 0.22 | 22.78 | 18.78 | 3.77 | 15.99 |
| 370 | 222.46300 | 8.87898 | 1.21 | 20.96 | 18.87 | 12.75 | 12.93 |
| 254 | 222.45340 | 8.98117 | 1.30 | 21.16 | 17.63 | 12.32 | 21.45 |
| 217 | 222.45132 | 8.99983 | 1.04 | 23.30 | 0.65 | 0.00 | |
| 170 | 222.27676 | 9.04376 | 1.10 | 21.84 | 17.52 | 5.27 | 23.05 |
| 337 | 222.35941 | 8.90313 | 1.10 | 22.79 | 18.38 | 3.17 | 16.17 |
| 177 | 222.48997 | 9.03878 | 2.28 | 20.66 | 17.68 | 11.81 | 11.19 |
| 169 | 222.35057 | 8.83613 | 1.49 | 23.71 | 1.18 | 0.00 | |
| 350 | 222.28493 | 8.89601 | 1.73 | 20.03 | 17.54 | 20.59 | 17.64 |
| 361 | 222.40059 | 8.89156 | 1.61 | 21.62 | 17.90 | 7.61 | 16.55 |
| 326 | 222.31325 | 8.87259 | 0.11 | 24.19 | 0.88 | 0.00 | |
| 367 | 222.39220 | 8.88237 | 0.76 | 23.14 | 19.01 | 2.96 | 14.77 |
| 66 | 222.41061 | 9.13401 | 3.71 | 21.81 | 19.10 | 0.80 | 2.04 |
| 150 | 222.29356 | 9.05019 | 0.93 | 23.90 | 0.77 | 0.00 | |
| 219 | 222.49631 | 8.99483 | 2.15 | 20.77 | 18.57 | 12.87 | 9.67 |
| 209 | 222.39636 | 9.00872 | 0.64 | 23.01 | 18.05 | 3.03 | 22.96 |
| 293 | 222.35330 | 8.94158 | 2.81 | 22.60 | 19.14 | 1.16 | 4.92 |
| 181 | 222.45479 | 9.03205 | 1.21 | 18.60 | 15.75 | 109.39 | 13.63 |
| 239 | 222.30940 | 8.85337 | 0.40 | 23.36 | 17.98 | 1.61 | 23.84 |
| 328 | 222.49463 | 8.91316 | 2.70 | 19.73 | 17.36 | 20.44 | 9.25 |
| 310 | 222.38542 | 8.87228 | 1.43 | 22.22 | 18.89 | 4.65 | 11.85 |
| 175 | 222.32431 | 9.03741 | 1.44 | 23.85 | 0.65 | 0.00 | |
| 360 | 222.33760 | 8.88899 | 1.21 | 18.29 | 15.33 | 220.04 | 18.91 |
| 330 | 222.45471 | 8.91179 | 0.65 | 24.62 | 0.12 | 0.00 |
| ID | RA(X) | DEC(X) | (X-O) | R | K | LR(R) | LR(K) |
|---|---|---|---|---|---|---|---|
| 186 | 222.39970 | 9.03090 | 0.28 | 23.30 | 18.70 | 1.63 | 15.92 |
| 244 | 222.26262 | 8.98473 | 0.84 | 25.22 | 0.00 | 0.00 | |
| 178 | 222.27762 | 9.03575 | 1.11 | 19.90 | 18.19 | 26.82 | 16.12 |
| 249 | 222.29007 | 8.97873 | 0.83 | 21.33 | 10.13 | 0.00 | |
| 146 | 222.41489 | 9.05666 | 2.31 | 24.98 | 19.11 | 0.00 | 7.23 |
| 210 | 222.39806 | 9.01260 | 0.40 | 23.88 | 0.86 | 0.00 | |
| 189 | 222.26312 | 9.02621 | 2.02 | 23.76 | 19.04 | 0.89 | 8.73 |
| 250 | 222.43523 | 8.97954 | 1.36 | 23.19 | 18.41 | 2.45 | 14.69 |
| 263 | 222.36024 | 8.97151 | 2.47 | 15.07 | 11.76 | 105.64 | 93.10 |
| 176 | 222.42137 | 9.03696 | 2.11 | 20.28 | 18.26 | 16.54 | 9.94 |
| 251 | 222.29749 | 8.97502 | 2.66 | 20.25 | 16.70 | 11.15 | 8.86 |
| 287 | 222.29201 | 8.94793 | 2.22 | 14.61 | 11.86 | 50.25 | 111.02 |
| 315 | 222.23370 | 8.92656 | 1.82 | 20.84 | 18.97 | 9.66 | 9.79 |
| 242 | 222.35516 | 8.98782 | 1.51 | 21.61 | 17.89 | 7.98 | 17.33 |
| 236 | 222.32794 | 8.85342 | 0.89 | 21.74 | 19.33 | 9.98 | 12.88 |
| 118 | 222.18840 | 9.08309 | 1.45 | 21.92 | 18.21 | 4.61 | 14.40 |
| 68 | 222.31241 | 9.12831 | 1.75 | 21.03 | 19.04 | 10.03 | 10.17 |
| 94 | 222.43179 | 9.10102 | 2.64 | 22.11 | 17.81 | 2.22 | 8.57 |
| 363 | 222.46667 | 8.88736 | 2.22 | 23.33 | 0.79 | 0.00 | |
| 289 | 222.44257 | 8.85969 | 3.16 | 22.18 | 18.36 | 1.41 | 4.33 |
| 273 | 222.18602 | 8.96341 | 1.67 | 23.73 | 18.06 | 1.09 | 16.06 |
| 301 | 222.32642 | 8.93809 | 1.06 | 20.94 | 17.58 | 13.42 | 23.35 |
| 125 | 222.37196 | 9.07913 | 1.85 | 14.90 | 12.56 | 142.06 | 81.20 |
| 259 | 222.34471 | 8.97245 | 0.41 | 22.31 | 3.70 | 0.00 | |
| 77 | 222.34190 | 9.11713 | 0.97 | 23.50 | 1.43 | 0.00 | |
| 139 | 222.39679 | 9.06015 | 0.58 | 22.56 | 18.61 | 3.61 | 18.44 |
| 319 | 222.28973 | 8.92027 | 3.30 | 20.67 | 16.98 | 5.02 | 5.00 |
| 180 | 222.31947 | 9.03277 | 1.37 | 22.65 | 2.86 | 0.00 | |
| 203 | 222.31352 | 9.01312 | 2.90 | 20.01 | 18.47 | 9.13 | 5.49 |
| 73 | 222.26274 | 9.12213 | 0.39 | 22.20 | 6.18 | 0.00 | |
| 122 | 222.48824 | 9.08229 | 0.90 | 23.18 | 19.00 | 2.86 | 14.26 |
| 158 | 222.25020 | 9.04792 | 2.84 | 19.17 | 15.56 | 30.30 | 7.02 |
| 282 | 222.22620 | 8.94736 | 3.23 | 21.39 | 18.43 | 2.34 | 4.05 |
| 303 | 222.36116 | 8.93674 | 2.67 | 22.23 | 17.90 | 2.17 | 8.37 |
| 129 | 222.40411 | 9.07376 | 1.63 | 24.73 | 0.04 | 0.00 |
| ID | RA(X) | DEC(X) | (X-O) | R | K | LR(R) | LR(K) |
| 67 | 222.40207 | 9.13641 | 1.67 | 22.74 | 2.50 | 0.00 | |
| 3.86 | 21.70 | 18.89 | 1.20 | 1.72 | |||
| 138 | 222.26871 | 9.06119 | 1.57 | 22.48 | 18.61 | 2.62 | 13.40 |
| 2.15 | 20.92 | 18.24 | 7.93 | 9.69 | |||
| 168 | 222.26259 | 9.04336 | 1.77 | 22.44 | 18.78 | 2.37 | 10.06 |
| 1.56 | 21.01 | 11.02 | 0.00 | ||||
| 103 | 222.27232 | 9.09741 | 3.85 | 20.75 | 17.12 | 2.78 | 2.77 |
| 2.38 | 21.17 | 1.04 | 0.00 | ||||
| 198 | 222.49577 | 9.01765 | 4.04 | 22.90 | 18.49 | 0.28 | 1.67 |
| 1.75 | 23.55 | 1.04 | 0.00 | ||||
| 298 | 222.30972 | 8.94036 | 4.37 | 22.28 | 19.15 | 0.36 | 0.82 |
| 1.54 | 23.00 | 2.26 | 0.00 | ||||
| 3.05 | 23.35 | 0.41 | 0.00 | ||||
| 61 | 222.33224 | 9.13775 | 4.10 | 23.58 | 0.13 | 0.00 | |
| 4.84 | 23.75 | 18.90 | 0.05 | 0.48 | |||
| 237 | 222.33333 | 8.98678 | 1.87 | 24.64 | 19.11 | 0.07 | 9.53 |
| 3.26 | 21.96 | 18.94 | 1.28 | 3.26 | |||
| 362 | 222.43140 | 8.88969 | 5.71 | 23.13 | 0.02 | 0.00 | |
| 23 | 222.37933 | 9.17607 | 3.95 | 23.31 | 0.07 | 0.00 | |
| 3.47 | 23.17 | 0.00 | 0.00 | ||||
| 357 | 222.42833 | 8.88944 | 4.69 | 23.79 | 0.06 | 0.00 | |
| 4.87 | 24.89 | 0.00 | 0.00 | ||||
| 157 | 222.23581 | 9.04881 | 4.31 | 23.55 | 0.10 | 0.00 | |
| 5.23 | 20.32 | 16.47 | 0.42 | 0.19 | |||
| 107 | 222.23543 | 9.09159 | 1.55 | 25.76 | 0.00 | 0.00 | |
| 2.39 | 25.24 | 0.00 | 0.00 | ||||
| 28 | 222.27785 | 9.16305 | 3.84 | 24.14 | 0.10 | 0.00 | |
| 0.86 | 25.38 | 0.00 | 0.00 | ||||
| 4.35 | 24.96 | 0.00 | 0.00 | ||||
| 269 | 222.24790 | 8.96716 | – | – | – | – | – |
| 255 | 222.35733 | 8.97293 | – | – | – | – | – |
| 288 | 222.33347 | 8.94492 | – | – | – | – | – |
| 152 | 222.36362 | 9.05004 | – | – | – | – | – |
| 154 | 222.39186 | 9.05019 | – | – | – | – | – |
| 207 | 222.48463 | 9.01196 | – | – | – | – | – |
| 179 | 222.17659 | 9.03417 | – | – | – | – | – |
| 344 | 222.23007 | 8.90152 | – | – | – | – | – |
| 241 | 222.21679 | 8.98637 | – | – | – | – | – |
Notes: ID = X–ray source identifications; RA(X), DEC(X) = X–ray coordinates; R,K = R–band and K–band magnitudes; LR(R), LR(K)= Likelihood ratio in the R and K bands.
| ID | RA(X) | DEC(X) | (X-O) | R (2′′) | K (2′′) | R-K | F2-10keV | HR | log(X/O) | log(X/K) | LR(K) |
|---|---|---|---|---|---|---|---|---|---|---|---|
| (J2000) | (J2000) | ′′ | erg cm-2 s-1 | ||||||||
| 5 ERO sample | |||||||||||
| 148 | 222.40681 | 9.05575 | 0.37 | 25.24 | 18.76 | 6.48 | 2.9e-14 | -0.44 | 2.06 | 0.97 | 15.78 |
| 195 | 222.23720 | 9.02275 | 1.73 | 24.11 | 18.32 | 5.79 | 2.5e-14 | 0.00 | 1.54 | 0.73 | 15.58 |
| 209 | 222.39636 | 9.00872 | 0.64 | 23.27 | 18.08 | 5.19 | 9.5e-15 | -0.54 | 0.78 | 0.21 | 22.96 |
| 293 | 222.35330 | 8.94158 | 2.81 | 24.26 | 19.13 | 5.13 | 9.1e-15 | 1.16 | 0.61 | 4.92 | |
| 239 | 222.30940 | 8.85337 | 0.40 | 23.96 | 18.23 | 5.73 | 8.9e-15 | -0.19 | 1.03 | 0.24 | 23.84 |
| 146 | 222.41489 | 9.05666 | 2.31 | 25.63 | 19.10 | 6.53 | 6.5e-15 | 0.01 | 1.56 | 0.45 | 7.23 |
| 189 | 222.26312 | 9.02621 | 2.02 | 24.40 | 19.04 | 5.36 | 5.8e-15 | 1.02 | 0.38 | 8.73 | |
| 250 | 222.43523 | 8.97954 | 1.36 | 23.50 | 18.47 | 5.03 | 5.8e-15 | 0.66 | 0.15 | 14.69 | |
| 3 ERO sample | |||||||||||
| 175 | 222.32430 | 9.03741 | 1.44 | 24.39 | 19.35 | 5.04 | 7.9e-15 | 0.12 | 1.24 | 0.43 | – |