The ELODIE Planet Search: Synthetic View of the Survey and its Global Detection Threshold
Abstract
In this paper, we give a synthetic view of the ELODIE Planet Search programme: a short description of our instrument and the surveyed sample as well as a brief review of our detections. Moreover, we have obtained, through numerical simulations, the global survey sensitivity: a detection probability map in the versus diagram. We use this map for correcting our total number of detections for observational biases. Finally we derive the fraction of our sample stars hosting at least one giant planet.
keywords:
Planets: exoplanets – Techniques: radial velocities1 The ELODIE survey: quick view
The search for extra-solar planets with the ELODIE echelle spectrograph ([\astronciteBaranne et al.1996]) mounted on the 193–cm telescope at Observatoire de Haute-Provence (OHP) started in 1994. The initial sample contained 142 stars, out of which \object51 Peg (\objectHD 217014), the star hosting the first detected extra-solar planet ([\astronciteMayor & Queloz1995]). The sample was largely modified in 1997. The to-date survey sample size amounts to 330 stars. 18 extra-solar planet candidates have been detected with ELODIE. 15 of these candidates are orbiting a star in our sample. The three other detections (\objectGl 876 b, \objectHD 80606 b and \objectHD 178911 Bb) result from other programmes. Here are the main characteristics of our survey:
-
•
ELODIE: = 42 000 echelle spectrograph mounted on the 193–cm telescope at OHP (CNRS, France). A detailed description of the instrument can be found in [\astronciteBaranne et al.1996].
-
•
Instrumental precision: 6.5 m s-1 (see [\astroncitePerrier et al.2003]) using the simultaneous Thorium-Argon technique.
-
•
Sample: 330 solar-type stars brighter than =7.65 in the northern hemisphere. The fast rotators ( 4 km s-1) and the binaries were removed according to CORAVEL ([\astronciteBaranne et al.1979]) radial-velocity data (see [\astroncitePerrier et al.2003] for details).
-
•
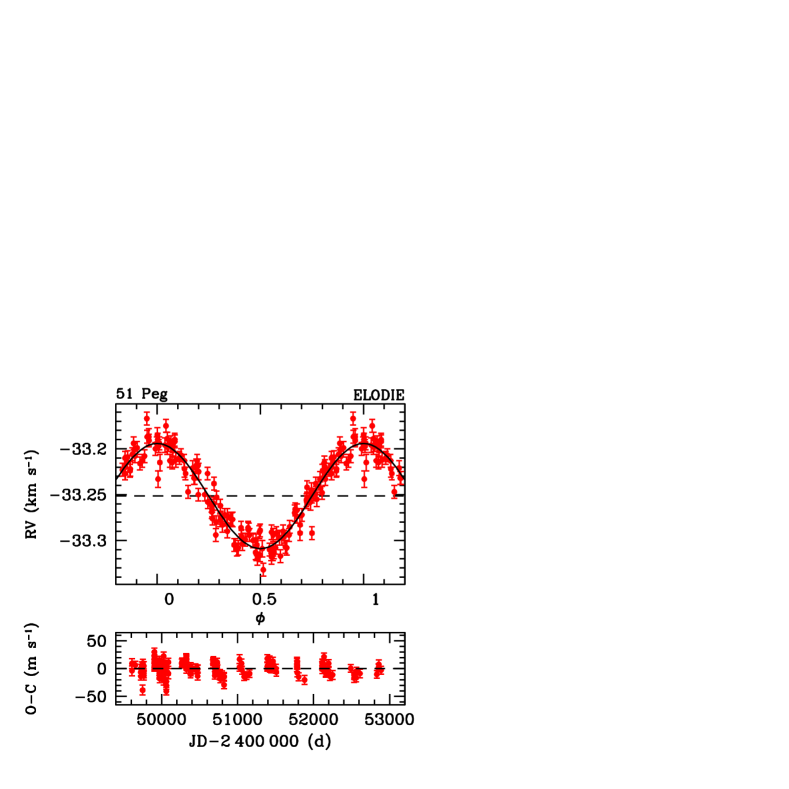
Detections: 18 planets detected (15 within the above described planet-search sample). Some of these planets are in multiple systems: \objectHD 37124 c ([\astronciteUdry et al.2002]); \objectHD 74156 b and c ([\astronciteNaef et al.2004]). The complete list of the to-date ELODIE detections and the corresponding references are presented in table 1. As an example of detection, Fig. 1 shows the ELODIE updated orbital solution for \object51 Peg published in [\astronciteNaef et al.2004].
-
•
Confirmations: Using ELODIE, we have confirmed the orbital solution for planet candidates around \objectUps And (\objectHD 9826, [\astronciteButler et al.1997], [\astronciteButler et al.1999]) \object55 Cnc (\objectHD 75732, [\astronciteButler et al.1997], [\astronciteMarcy et al.2002]), \object47 UMa (\objectHD 95128, [\astronciteButler & Marcy1996]), \object70 Vir (\objectHD 117176, [\astronciteMarcy & Butler1996]) and \objectHD 187123 ([\astronciteButler et al.1998]). These confirmed planetary companions are also listed in table 1.
2 Global ELODIE survey sensitivity
We have determined, via numerical simulations, the global ELODIE survey sensitivity, i.e. the probability of detection in the secondary mass versus orbital period diagram. We give some details about these simulations in Sect. 2.1. In Sect. 2.2, we describe how we accounted for non-photonic error sources. We study the impact of various stellar properties on the sensitivity in Sect. 2.3. Finally, we present our results in Sect. 2.4.
2.1 Numerical simulations
We have computed, through numerical simulations, the detection probabilities for a grid in the versus diagram. The secondary mass and orbital period considered intervals are: 0.025 20 MJup and 0.8 6000 d. The total number of grid points is 3534. We have generated 5000 random orbits for each grid point using the following distributions:
-
•
uniform distribution for (instant of periastron passage) and (longitude of the periastron)
-
•
(orbital eccentricity): we have used the eccentricity distribution observed for the known extra-solar planet candidates
-
•
(inclination of the orbital plane): the probability density we have used for is proportional to
Our simulation algorithm accounts for:
-
•
the stellar content of our sample (i.e. the , , , Fe/H and distributions for our sample)
-
•
the real timing of the radial-velocity observations
-
•
weather and seeing conditions at OHP
-
•
the presence of non-photonic error sources such as stellar activity jitter (see Sect 2.2)
2.2 Non-photonic error sources
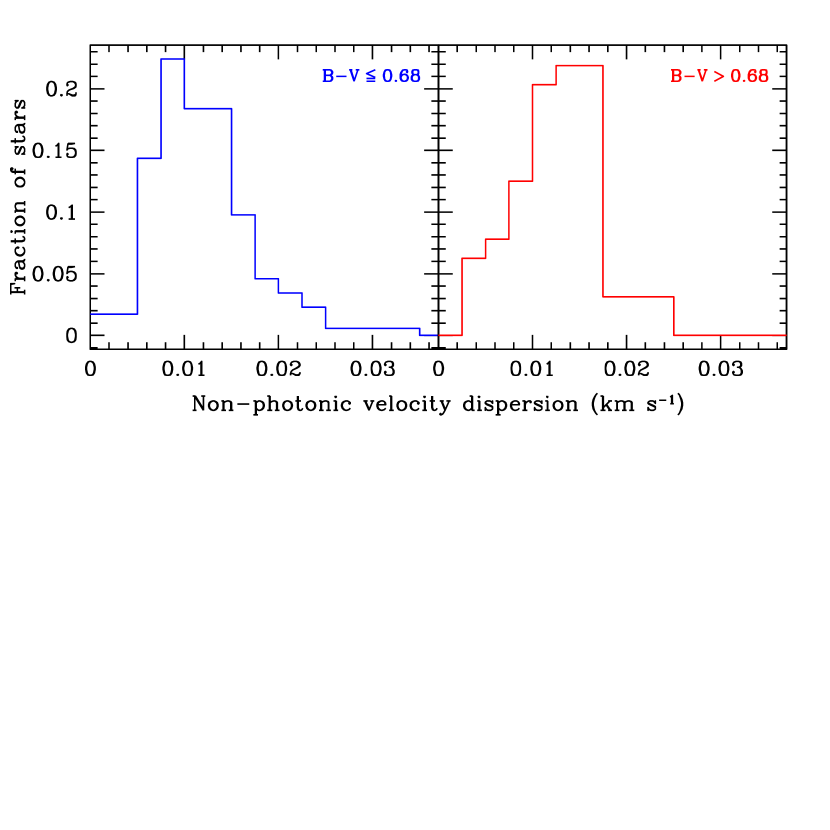
In order to account for the presence of non-photonic velocity error sources, we have determined the distribution of the observed velocity dispersion corrected for the photon noise for a subsample of target stars. This subsample contains the non-variable stars and the micro-variable stars for which the variability origin is unknown. The stars with planetary companions, the spectroscopic binaries (SB1 or SB2), the stars with close visual companions and the stars with blended spectra have been removed.
Figure 2 shows the distributions of the velocity dispersion for the remaining targets (240 stars). Their velocity dispersions have been quadratically corrected for their mean photon noise for building the displayed distributions. The remaining velocity dispersion sources present in these distributions are: the instrumental error, the stellar jitter, the stellar oscillations, the non-detected (or not yet characterized) light planets and the non-detected blended spectra. Non-photonic error contributions have been randomly generated in our simulations using these two distributions.
2.3 Impact of colour, metallicity and rotation
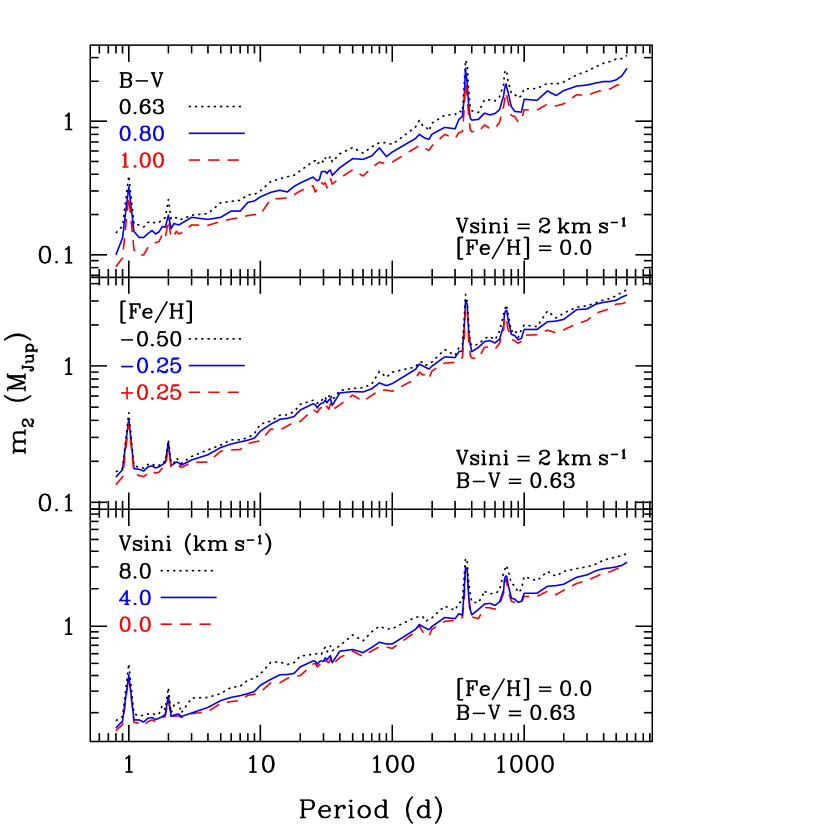
Figure 3 shows the impact of the colour index, the metallicity Fe/H and the projected rotational velocity on the 90% detection limit obtained using the measurement dates and signal-to-noise ratios obtained for one of our sample stars. The photon noise errors have been computed using cross-correlation function parameters corresponding to the simulated stellar characteristics.
The impact of rotation is negligible up to = 4 km s-1, the value we have used for selecting our sample of slow rotators. The impact of metallicity is very weak whereas the impact of colour is higher but mostly due to primary mass differences. The absence of metallicity impact on the detection limits further demonstrates that the observed difference between the metallicity distributions for stars with and without planets ([\astronciteSantos et al.2001], [\astronciteSantos et al.2003], [\astronciteSantos et al.2004]) does not result from an observational bias.
2.4 Results
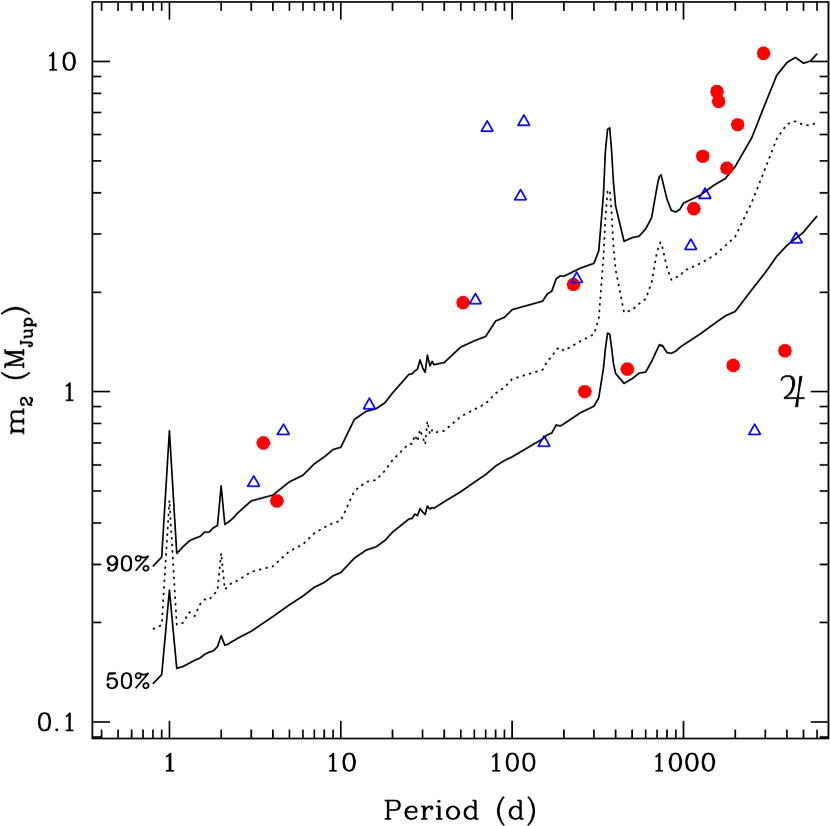
Figure 4 shows the 50 and 90% typical detection limits for the ELODIE survey. The dotted curve is the 90% detection limit we would obtain without the presence of any non-photonic error source but the instrumental error (here set to 6.5 m s-1). The filled dots are the planet detected around stars in our sample. Open triangles are used for planets detected with ELODIE outside our sample and for planets confirmed with ELODIE. The main trend of these curves is proportional to as expected from Kepler’s laws. We note the enormous sensitivity decrease at =1 and 2 days and 1 and 2 years.
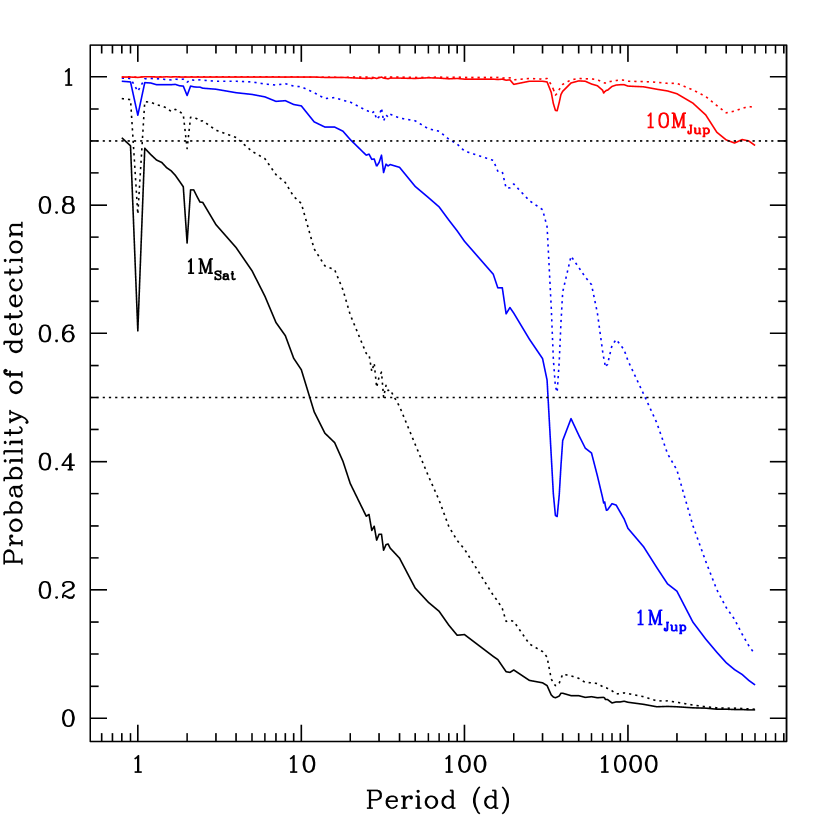
Probabilities of detection versus orbital period for different secondary masses (1 MSat, 1 MJup and 10 MJup) are displayed in Fig. 5. The presence of non-photonic error sources is taken into account. 90% of the Jupiter-mass planets are detected up to 20 d and 50% up to = 300 d. The probability of detection for brown-dwarf companions is above 90% for all the period interval. The daily and yearly features are also clearly visible here. The dotted curves are obtained without including the contribution of non-photonic error sources except for the 6.5 m s-1 instrumental error. These curves clearly show the dramatic impact of stellar jitter (and other error sources) on the detection sensitivity.
We find no sensitivity decrease between 1 and 2 days. Thus, planets in this period range, the so-called ”very hot Jupiters” (see e.g. [\astronciteKonacki et al.2003], [\astronciteBouchy et al.2004], [\astronciteKonacki et al.2004]), would be easily detected if present around our sample stars.
3 Fraction of stars hosting a giant planet
Following our obtained ELODIE detection limits, we can correct our effective detections for all the observational biases. We can also derive, by inverting the detection probability map, the fraction of stars in our sample hosting at least one giant planet (the outer planets of the two systems are not considered here) with 0.47 MJup and for different period intervals. We find:
= 0.7 0.5% for 5 d = 4.0 1.1% for 1500 d = 7.3 1.5% for 3900 d
Details about our numerical simulations and these results on the global ELODIE survey sensitivity will be published in a forthcoming paper (Naef et al. 2004 in prep.).
Acknowledgements.
We acknowledge support from the Swiss National Research Found (FNS), the Geneva University and the French CNRS. We are grateful to the Observatoire de Haute-Provence for the generous time allocation and for the constant support during the last ten years.References
- [\astronciteBaranne et al.1979] Baranne A., Mayor M., Poncet J.L., 1979, Vistas in Astron. 23, 279
- [\astronciteBaranne et al.1996] Baranne A., Queloz D., Mayor M. et al., 1996, A&AS 119, 373
- [\astronciteButler & Marcy1996] Butler R.P., Marcy G.W., 1996, ApJ 464, L153
- [\astronciteButler et al.1997] Butler R.P., Marcy G.W., Williams E. et al., 1996, ApJ 474, L115
- [\astronciteButler et al.1998] Butler R.P., Marcy G.W., Vogt S.S. et al., 1998, PASP 110, 1389
- [\astronciteButler et al.1999] Butler R.P., Marcy G.W., Fischer D.A. et al., 1996, ApJ 526, 916
- [\astronciteBouchy et al.2004] Bouchy F., Pont F., Santos N.C. et al., 2004, A&A 421, L13
- [\astronciteDelfosse et al.1998] Delfosse X., Forveille T., Mayor M. et al., 1998, A&A 338, L68
- [\astronciteKonacki et al.2003] Konacki M., Torres G., Jha S. et al., 2003, Nature 421, 507
- [\astronciteKonacki et al.2004] Konacki M., Torres G., Sasselov D. et al., 2004, ApJ 609, l37
- [\astronciteMayor & Queloz1995] Mayor M., Queloz D., 1995, Nature 378, 355
- [\astronciteMarcy & Butler1996] Marcy G.W., Butler R.P, 1996, ApJ 464, L147
- [\astronciteMarcy et al.2002] Marcy G.W., Butler R.P, Fischer D.A., et al., 2002, ApJ 581, 1375
- [\astronciteMazeh et al.2000] Mazeh T., Naef D., Torres G. et al., 2000, ApJ 532, L55
- [\astronciteNaef2003] Naef D., 2003, PhD Thesis, Geneva Observatory
- [\astronciteNaef et al.2001] Naef D., Latham D., Mayor M. et al., 2001, A&A 375, L27
- [\astronciteNaef et al.2003] Naef D., Mayor M., Korzennik S. et al., 2003, A&A 410, 1051
- [\astronciteNaef et al.2004] Naef D., Mayor M., Beuzit J.L. et al., 2004, A&A 414, 351
- [\astroncitePerrier et al.2003] Perrier C., Sivan J.P., Naef D. et al., 2003, A&A 410, 1039
- [\astronciteSantos et al.2001] Santos N.C., Israelian G., Mayor M., 2001, Nature 411, 163
- [\astronciteSantos et al.2003] Santos N.C., Israelian G., Mayor M. et al, 2003, A&A 398, 363
- [\astronciteSantos et al.2004] Santos N.C., Israelian G., Mayor M., 2004, A&A 415, 1153
- [\astronciteUdry et al.2002] Udry S., Mayor M., Queloz D., 2003, in ”Scientific Frontiers in Research on Extrasolar Planets”
- [\astronciteZucker et al.2002] Zucker S., Naef D., Latham D.W. et al., 2002, ApJ 568, 363