Deep Field Surveys - A Radio View
Abstract
I present an introductory review text, focusing on recent deep field studies using radio telescopes, including high-resolution, wide-field VLBI observations. The nature of the faint radio source population is discussed, taking into account complimentary data and results that are now available via the sub-mm, IR, optical and X-ray wave-bands. New developments regarding the increased sensitivity of VLBI and an expansion in the instruments field-of-view are also presented. VLBI may be an important tool in recognising distant, obscured AGN from the “contaminant” star forming galaxies that now dominate lower-resolution, sub-arcsecond and arcsecond radio observations.
1 Introduction - How many radio sources are in the sky ?
On a sweltering July summer’s day in 1987, in the midst of the rural Cheshire plains, Sir Bernard Lovell gave a rousing speech, commemorating the 30th anniversary of the completion of the MkI radio telescope at Jodrell Bank (renamed on that day the Lovell Telescope, see Gunn this volume). The precise date was 3 July 1987, surrounding the telescope a great Jodrell party was in full-flow, involving several hundred VIPs, plus a few new (and by late afternoon very happy) Jodrell Bank PhD students. In his speech, Sir Bernard made a simple statement, but it was one that shocked and inspired all at once. Quite simply he stated:
There are 4 million radio sources in the Sky!
For some of the students this was something of a revelation, 4 million was a big number, much more than most of us had expected. At the same time, we were naive enough to wonder just how Sir Bernard could be so sure of his facts and figures - had he counted all 4 million sources himself ?! The size of the number also brought hope - 4 million sources must surely mean that there was enough interesting objects to share between even the largest group of aspiring (and as I was beginning to realise) very competitive students, not to mention satisfying the criteria for a successful PhD and thesis defence.
But Sir Bernard’s statement also raised a few doubts, at least in my mind. For example, why, if there really were 4 million radio sources out there, did the discussion during afternoon-tea at Jodrell Bank, always revolve around the same objects — all with inexplicable names that were now becoming all too familiar - 3C 273, SS 433, Cyg-A, the “Double Quasar” and one or two others with long telephone numbers attached. While I was to embark on a thesis focussed on one of these “famous sources”, in this paper I am glad to return to the 4 million others, Sir Bernard originally inspired us with.
1.1 Radio Source Counts
In the mid-1980s, the Westerbork Synthesis Radio Telescope (e.g. [Windhorst et al. 1985], [Oort (1987)]) and the Very Large Array (e.g. [Mitchell & Condon (1985)]) had already begun to shed light on the source counts at the milliJansky and sub-milliJansky flux density levels. By observing particular and relatively small areas of sky, the sub-mJy source counts were found to be fairly consistent between different fields, and were thus well established by the time of the Lovell Telescope’s 30th birthday party.
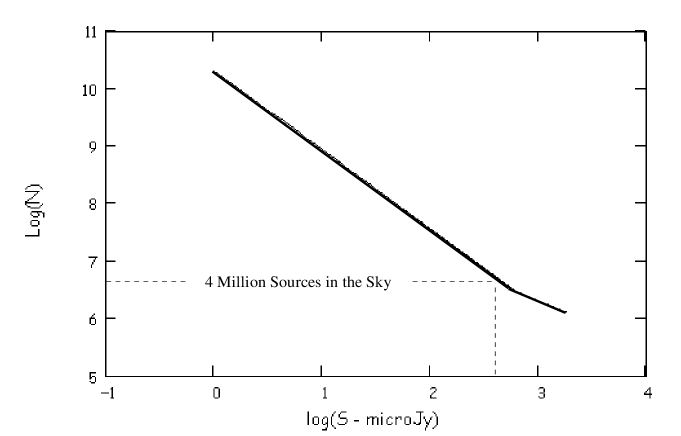
The integral radio source counts, , are usually represented as a power-law fit in , ), but often what is plotted are the differential radio source counts (e.g. Condon this volume, Fig. X). While these are more useful in terms of studies of source evolution or cosmological tests, the integral counts directly predict the number of sources we can expect to observe for a given flux density threshold (telescope sensitivity) and area of sky. Today, recent deep field radio source surveys (e.g. [Richards (2000)]) provide good estimates of the source count down to a few tens of microJy:
| (1) |
where N is the expected number of sources per square arcminute of sky, above a specific flux density level, S (in microJansky).
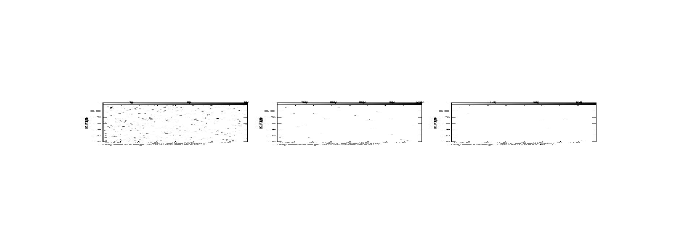
For an r.m.s. noise level of say Jy, you expect to detect (at the 5-sigma level i.e. Jy) about 1 radio source per square arcminute. Fig. 1 plots this fit of the integral counts over the whole sky at 1.4 GHz. As recognised by Sir Bernard in 1987, the sub-mJy flux densities (then being routinely explored by the best radio telescopes of the day), correspond to all-sky source counts of several million radio sources. Note that the slope of the integral source counts begins to steepen at sub-mJy flux densities (), suggesting the emergence of a new population of radio sources at faint flux density levels. At the typical detection thresholds routinely probed today ( microJy), the total number of sources in the sky thus rises to 100 million radio sources. As shown pictorially in Fig. 2, at mJy flux density levels the radio sky is virtually empty, at microJy flux density levels, the radio sky literally lights-up.
2 Nature of the microJy Radio Source Population
2.1 Potential sources of microJy radio emission
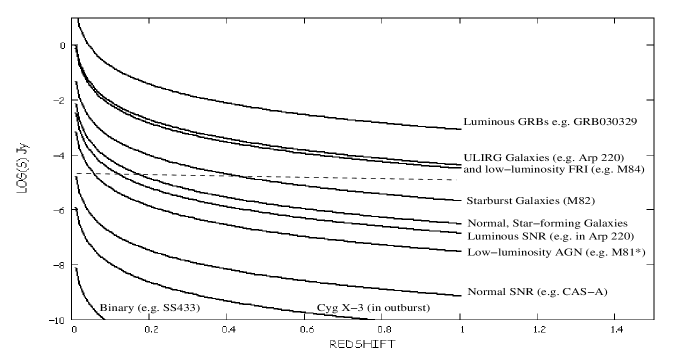
It is instructive to consider what kind of radio emitting object (or source population) might be responsible for the up-turn in the faint microJy radio source counts, as revealed in deep field radio studies. Fig. 3 plots the observed radio flux density as a function of increasing redshift for several types of well-studied radio sources (excluding the very luminous, , but rare radio galaxies and quasars that are known to dominate the bright ( mJy) source counts [Condon (1984)]. The sources include:
-
•
low-luminosity AGN as observed in the local Universe (e.g. M84, W/Hz),
-
•
normal, spiral star forming galaxies like our own Milky Way ( W/Hz) and nearby starburst systems such as M82 & Arp 220 (in which the radio emission is generated via star formation processes, ),
-
•
very luminous but rare and transient GRB radio after-glows - e.g. GRB030329 ( W/Hz),
-
•
individual luminous hypernovae in starburst galaxies such as Arp 220 (),
-
•
Supernovae remnants/event such as Cas-A SN1993J ( W/Hz),
-
•
radio binary star systems during outburst e.g. Cyg-X3 ( W/Hz).
Figure 3 shows, that of the commonly known continuum radio emitting objects, the most likely contributors to the microJy radio source counts (at moderate redshift, ) include AGN (low-luminosity FRI radio sources) and Ultra-Luminous Infra-Red Galaxies (ULIRG) i.e. very luminous starburst galaxies, such as Arp 220. In principle, GRBs can be detected within these microJy samples too, but they are much too rare and short-lived to contribute in any substantial way. Moderate starburst galaxies, such as M82, can be detected at moderate redshifts, out to . The largest, “normal” star-forming galaxies (e.g. galaxies similar to our own Milky Way) might contribute to the source counts, but at current sensitivity levels they can only be detected over a limited region of redshift space (). It is interesting to note that luminous SNR (similar to the brightest examples detected in Arp 220, [Smith et al.(1998)]) can be detected individually but again over a very restricted redshift range (). Galactic objects such as Cas-A, SS433 and Cyg-X3 (in outburst) are not luminous enough to be detected in current deep radio surveys. However, next generation radio instruments (such as the SKA - see section 4), should be able to detect systems like Cyg-X3 (in outburst) out to significant distances (). Dwarf irregular galaxies are considered to be the most common type of galaxy in the universe, but with radio luminosities comparable to Cas-A, they are unlikely to dominate the microJy source counts.
2.2 Optical & Infra-Red counterparts to faint radio sources in the HDF-N
Significant progress has been made over the last 5 years in identifying optical, Infra-red, sub-mm and X-ray counterparts to the faint microJy radio sources detected in the Hubble Deep Field North (HDF-N, [Williams et al. 1996]). The great advantage of the original HST image of the HDF-N, was not just its depth () but the excellent angular resolution achieved. For the first time it became possible to discern the optical morphology of relatively distant galaxies. On inspection it immediately became clear that the most distant galaxies in the HDF-N were also the most morphologically disturbed. For example, familiar “grand design” spirals observed locally, all but disappear beyond . In terms of morphology, these distant, disturbed systems are most akin to nearby Ultra Luminous Infrared Galaxies (ULIG) and interacting starburst systems ([Abraham& van den Bergh 2001]).
While the brightest radio sources in the sky are usually associated with stellar identifications (quasars), as one moves to fainter flux density thresholds, an increasing fraction of the identifications are with galaxies, including bright elliptical galaxies with red colours. Indeed at the mJy level, around half of the identifications are with galaxies ([McMahon et al. (2001)]). The microJy radio source population continues this trend – in the HDF-N the optical counterparts are usually (but not always - see section 2.5), identified with galaxies brighter than ([Richards et al. 1998, Fomalont et al. (2002), Muxlow et al. 2004]).
2.2.1 Radio morphology, angular size
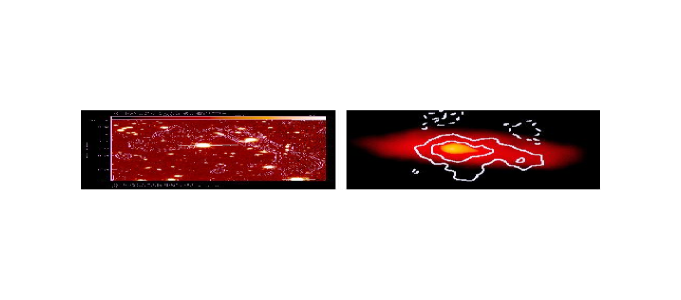
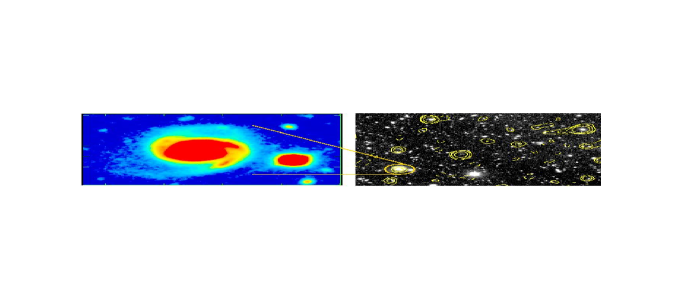
The galaxies associated with the microJy radio source population are usually identified with major disk galaxies (rather than elliptical galaxies), and the radio emission is often sub-galactic in size, i.e. the scale of the radio emission usually fits within the entire optical extent of the galaxy ([Muxlow et al. 2004]). This can also be seen in the WSRT 1.4 GHz deep field observations presented in Fig. 2 - the vast majority of the sources are unresolved at 15 arcsecond resolution. The VLA also does not fully resolve these faint radio sources ([Richards (2000)]), however, combined MERLIN-VLA 1.4 GHz observations are able to measured sizes for the radio sources typically in the range of less than a few arcseconds (e.g. Muxlow et al. 2004). This should be compared with the median angular size of arcseconds for the brighter, mJy radio source population ([Coleman & Condon (1985)]). Figure 4 presents WSRT and MERLIN-VLA radio contour maps of 2 radio sources projected on top of their respective optical backgrounds. The bright ( mJy) radio-loud AGN extends across the optical field, spanning some 5 arcminutes ([Morganti et al. 2004]). In this case the extent of the radio source is so large, it is quite difficult to guess which of the galaxies in the field can be identified with it. The much fainter microJy radio source ( Jy) is only a few arcseconds across, with most of the radio emission lying within the optical emission associated with host galaxy. Note the scales in both images are very different, as are the radio source sizes. In terms of detailed morphology ([Muxlow et al. 2004]), there are very few (if any), microJy radio sources that exhibit the familiar and often spectacular “classical” radio structures associated with bright radio galaxies and quasars (e.g. widely separated steep spectrum radio lobes straddling an unresolved, usually fainter, flat spectrum central radio core).
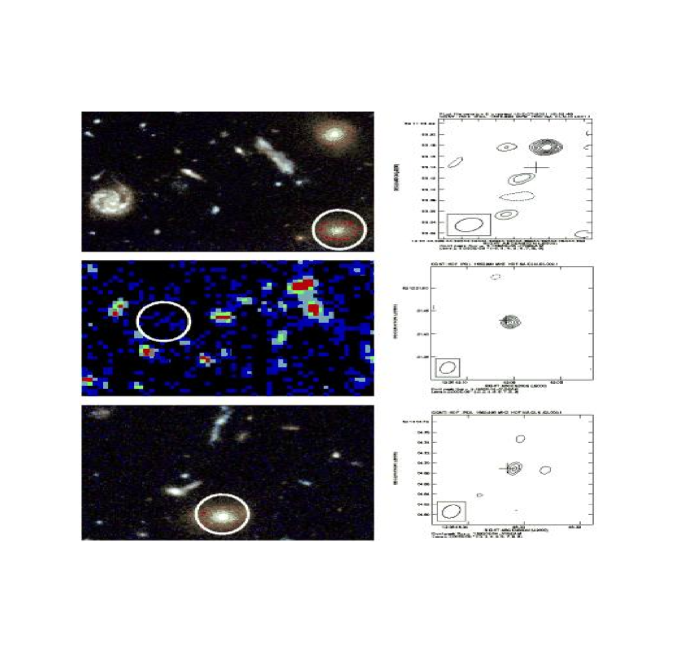
Nevertheless, it should be noted that the VLA and MERLIN observations (e.g. Muxlow et al. 2004) probably miss some (%) of the extended sources detected by the lower-resolution WSRT observations ([Garrett et al.(2001)]) - these probably include some extended AGN but also local (and therefore extended) star-forming disk galaxies. Fig. 5 shows the optical identification ([Barger et al. 1998]) of a faint but extended radio source (Jy) that is detected by the WSRT but not by the VLA or VLA-MERLIN. The galaxy shows clear spiral structure in the optical and is located nearby (z=0.106), corresponding to a distance of Mpc. At this distance, the typical optical extent of a major disk galaxy is kpc, thus subtending an angle of arcseconds on the sky. The detection of this system by the WSRT (and non-detection by the VLA or VLA-MERLIN combination) suggests that in this case the radio emission covers a large fraction of the optical disk. While high resolution is essential for uncovering the radio morphology of distant galaxies, it is wise to remember that even moderate resolution observations ( arcseconds), can potentially resolve-out the radio emission from local galaxies. Deep surveys therefore require observations that span a range of resolution, if they are to be considered complete.
2.3 Redshift Distribution
Fortunately, the HDF-N is also well served in terms of spectroscopic data (e.g. [Cohen et al. (2000)]), so for most radio sources in the HDF-N, a redshift is also known. Here again there is a significant difference between the redshift distribution of the brighter mJy and microJy source populations. The former are typically located at cosmological distances (), whereas the microJy source population show a fairly continuous distribution of moderate redshifts, from
2.3.1 The FIR-Radio Correlation at high-z
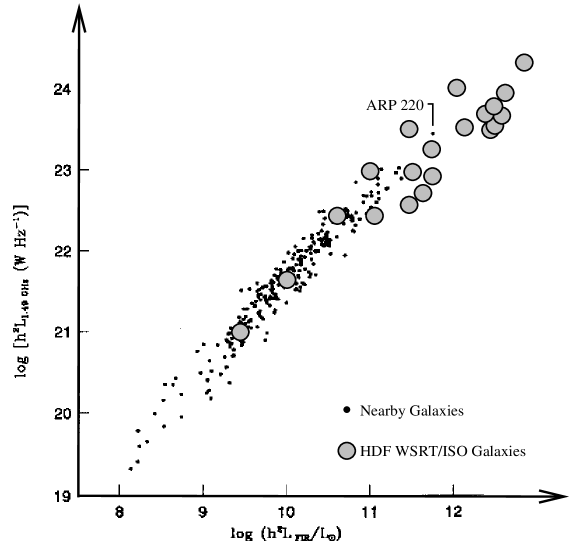
Another important clue to the nature of the bulk of the microJy radio source population is the strong correspondence between the Mid-IR ISO detections (Aussel et al. 1999) and the WSRT radio detections ([Garrett(2002)]). The obvious conclusion is that the FIR-radio correlation (well established for nearby star forming galaxies e.g. [Helou & Bicay (1993)]) also applies at cosmological distances. Fig. 6 shows a logarithmic plot of the FIR vs Radio Luminosity for local galaxies ([Condon (1992)]) presented together with addition points (large circles) from the (generally) higher luminosity/higher redshift ISO/WSRT HDF-N sample. After applying appropriate k-corrections to both the Mid-IR and radio data, the majority of radio sources appear to closely follow the FIR-radio correlation out to at least ([Garrett(2002)]).
The fact that the bulk of the microJy source population follow the FIR-radio correlation, together with their optical identification and steep spectrum radio morphologies, strongly suggests that for most systems the radio emission is generated by star formation processes, rather than the accretion of matter onto super-massive black holes (AGN). It should be stressed that star formation only begins to dominate at the faintest levels probed by deep surveys ( Jy), indeed even at the sub-mJy level Jy) AGN still compose a significant fraction of the source counts. However, at the faintest levels probed by deep surveys ( microJy at 1.4 GHz), star formation processes (star forming galaxies) appear to account for of all sources of radio emission.
In all these discussions of AGN vs Starburst classification, it should be made clear that we are attempting to characterise the nature of the dominant process that gives rise to the faint radio emission in sub-mJy and microJy radio sources. Hybrid systems, presenting both AGN and star forming characteristics are possible. For example, since AGN are usually radio quiet, it’s quite possible that in any individual galaxy, radio emission being generated by star formation may also be accompanied by emission at other wave-bands (e.g. X-rays) being generated by accretion associated with an (embedded) AGN. It’s also possible that the radio emission is generated by both star formation and AGN processes simultaneously. The fact that the FIR-radio correlation appears to apply to so many of the sub-mJy and microJy radio source population, however, suggests that star formation is the dominant process by which radio emission arises in these faint radio sources.
2.4 Radio and FIR emission processes
It should also be noted that the linear relationship between the non-thermal radio emission and the star formation rate is not understood in detail. Neither is the remarkable tightness of the FIR-radio correlation, a relation that now spans over 6 orders of magnitude in radio luminosity! Even the source of the electrons that produce the bulk of the radio emission is unclear - the most widely accepted scenario is that electrons are accelerated to relativistic velocities in supernova remnants. A typical supernova associated with a massive star, releases around Joule almost instantaneously. The ejecta and the circumstellar medium in the immediate vicinity of the SNe is swept up into a supersonic shell ( km/s) of dense circum-stellar material, causing a shock wave which in turn heats the surrounding matter with which it collides. The resulting expanding and cooling structure of ejecta and shock-heated material is known as a supernova remnant. It is within these SNR shocks that electrons (and other ions associated with low-energy cosmic rays) are believed to be accelerated as the supernova remnant expands into the ISM. The favoured model suggests that magnetic turbulence in the ISM scatters electrons (and the other ions) back and forth across shocks in the SNR. The electrons continually gain energy at each crossing, in a process known as Fermi acceleration. This picture of diffuse shock electron acceleration is supported by the detection of non-thermal x-ray emission in the SN 1006 and other supernova (e.g. [Koyama et al.(1995)]).
The process of electron acceleration lasts well beyond the typical lifetime over which SNR can usually be detected by current radio telescopes. Over time scales of many tens of thousands of years, the electrons eventually find themselves distributed throughout the host galaxy, radiating synchrotron radio emission as they spiral through the large-scale galactic magnetic field. Another source of radio emission is free-free emission associated with thermal bremstraalung in ionised HII regions, plus prompt and compact synchrotron radio emission from young SNe and SNR. In most luminous star forming galaxies, the latter discrete sources only represents about 10% of the total radio emission, the remainder being dominated by the distributed cosmic ray electrons. The exact division between thermal and non-thermal radio emission is complex, at high frequencies GHz thermal emission dominates, at lower frequencies ( GHz) synchrotron emission dominates. It’s sobering to note, that the total radio continuum emission, only accounts for less than of a typical star forming galaxies bolometric luminosity.
In this scenario, the radio emission is then essentially proportional to the supernova rate of massive stars, which in turn is proportional to the massive star formation rate. Since massive stars have short lives, the radio emission is a reasonable estimate of the current, on-going star formation rate. By assuming some reasonable mass function for stars (e.g. a classical Salpeter Inititial Mass Function, IMF) the total star formation rate can be estimated by integrating over the assumed IMF. While the SFR for massive stars can be determined reasonably well, estimates of the total star formation rate are less reliable, in particular the form of the IMF is less well constrained for low-mass stars.
Both evolved, massive stars, and most recently SNR (e.g. [Dunne et al. (2003)], see also Fig. 6) are also thought to be responsible for generating the cold dust that pervades distant star forming galaxies. This very fine dust is composed of carbon and silicates, that optimally scatter and absorb radiation with a wavelength comparable or smaller than the individual grain size (m) i.e. optical (blue light) and uv radiation. If the column density of dust is high enough, even x-ray emission can be absorbed. This can happen in regions with high star-formation rates, or in the central region around AGN, where large amounts of dust also appear to reside. In addition, for galaxies at high-z, near-IR observations can also suffer from dust obscuration, since these photons were emitted in the rest frame of the galaxy at optical wavelengths. Fortunately at longer wavelengths (e.g. radio, sub-mm, FIR), dusty star-forming systems and the central regions of AGN, remain transparent.
The uv-radiation that is emitted by young, massive stars is not only responsible for producing ionised HII regions, but also gets absorbed by cold dust, heating the grains in the process. These grains then re-radiate with a a modified blackbody spectrum ( K) for which the spectral energy distribution (SED) peaks in the FIR at a few hundred microns. Just as in the radio, a measure of the FIR emission is a direct measure of the massive star formation rate. This partially explains why both the radio and FIR emission are so well correlated, though the tightness of the relation requires considerable (perhaps unlikely) fine-tuning of various inter-related physical parameters. A definitive understanding of this complex correlation is still awaited.
2.5 Sub-mm Galaxies and Optically faint microJy radio sources
At high redshift (), the peak of the modified blackbody curve associated with star forming galaxies is shifted (by a factor ) from the Far-IR to sub-mm wavelengths. This more than compensates for the dimming effect of increasing luminosity distance, such that the apparent luminosity of a dusty star forming galaxy at sub-mm wavelength remains constant over a large range of redshift . This so called “negative k-correction” has been used to great advantage by the SCUBA instrument installed on the JCMT in Hawaii [Hughes et al. (1998)]. Deep radio observations have been crucial in pin-pointing the location of the dust enshrouded sub-mm galaxies and identifying their very faint optical counterparts (e.g. [Dunlop et al. 2004]).
Another interesting aspect of these studies, is that about 10-20% of the faint radio source population remain unidentified to ([Richards (1999)]). This optically faint radio source population seems to have a significant overlap with the sub-mm SCUBA source population ([Chapman et al. (2001)]), suggesting that they are distant, massive galaxies, obscured by the presence of large amounts of dust. However, around 1/2 of the optically faint radio sources () have no sub-mm counterpart. [Chapman et al. (2004)] argue that these radio sources represent a new population of galaxies - an extension of the high-redshift sub-mm galaxy population, but with hotter characteristic dust temperatures, shifting the peak of their far-IR emission to shorter wavelengths and reducing the sub-mm flux below the sensitivity of current instruments such as SCUBA. Chapman et al. have concluded that up to 1/2 of the high-redshift ultra-luminous star forming galaxies are missed by current sub-mm surveys alone. This is probably an upper-limit, since some of the optically faint radio sources also show evidence of AGN activity, for example in their optical spectra. Whether the faint radio emission arises purely from star formation processes or also (perhaps partially) from AGN activity is difficult to tell from the limited information available. As we shall see in the next section, rapid developments in very high resolution radio astronomy (e.g. VLBI) should be able to address this question directly.
3 VLBI Observations of Deep Field Survey Regions - distinguishing between Star forming and AGN systems
As we have seen in section 2.2.1, the faint microJy radio source population are resolved at sub-arcsecond resolutions ([Muxlow et al. 2004]), limiting the maximum brightness temperature of star forming galaxies to K at frequencies above 1 GHz ([Condon (1992)]). High-resolution (milliarcsecond) VLBI observations resolve out these extended star forming galaxies and, currently, any compact radio sources in these galaxies, such as luminous Type IIn SNe ([Smith et al.(1998)]), would be too faint to detect at cosmological distances. On the other hand, VLBI is very well matched to detect the very compact radio emission associated with the relativistic outflows generated by accretion onto massive black holes in active galaxies.
High sensitivity VLBI observations, covering a large fraction of sky, thus provide a simple and direct method of identifying these faint, and possibly distant, radio-loud active galaxies. Free from the effects of dust obscuration, deep and wide-field VLBI studies can therefore contribute to the cosmic census of active galaxies (and their energising massive black holes), and together with redshift information, can potentially probe the accretion history of the early Universe. In addition, the positions of the compact VLBI detections can be measured very accurately, via the use of standard phase-referencing techniques. Astrometric precision at the mas level can be achieved routinely (e.g. [Wrobel et al. 2004]), and cross identification with sources detected at other wave-bands can anchor these non-radio observations to the International Celestial Reference Frame (ICRF). In crowded and deep fields, such precision astrometry may be useful in identifying the counterparts of faint or obscured sources at other wavelengths.
3.1 EVN Observations of the HDF-N
The first deep, wide-field, VLBI observations were conducted by the European VLBI Network ([Garrett et al.(2001)]) at 1.6 GHz. Using wide-field, phase-reference techniques, 3 sources were simultaneously detected (from a total of 6 potential targets, Jy) over a limited radial field-of-view of 3.5 arcminute. Figure 8 shows the VLBI detections and their optical identification. One of the sources detected by the EVN (VLA J123642+621331) is not detected in I-band () and is only just detected in the near-IR in H & J-band ([Waddington et al. 1999]). Given (and assuming the K-z relation holds for these faint systems), Waddington et al. (1999) identified a single spectral-line detected by the Keck telescope as Ly at a redshift of . Although the radio emission is extended over a scale of 0.6 arcseconds ([Muxlow et al. 2004]), the detection of an unresolved radio-loud component by the EVN places a limit on the brightness temperature of the source, K, strongly suggestive of an AGN origin for the radio emission. This system is also detected in the ISO 15 supplemental catalogue ([Aussel et al. (1999)]) and is an obvious out-lier in the K-corrected and extrapolated FIR-Radio correlation derived by Garrett (2002). There is little doubt that this is an optically faint radio source for which the radio emission is very much dominated by AGN processes.
The ability to use the FIR-radio correlation as a starburst/AGN diagnostic is likely to improve substantially with the successful launch and operation of the Spitzer Space Telescope. Already [Appleton et al. (2004)] have confirmed the FIR/MIR-radio correlation out to using a matched sample of over 500 sources in the region of the Spitzer First Look Survey. However, recent studies ([Orienti (2004)]) show that about 1/3 of the faint radio source population have no identification in the Spitzer verification strip at 24 microns.
3.2 Deep VLBA-GBT Observations: probing the AGN content of the NOAO-N Boötes Deep Field.
Building on the original EVN Deep Field study of the HDF-N, the VLBA and 100-m GBT telescopes have been used to produce the deepest, wide-field VLBI images yet - reaching an unprecedented 1 rms noise level of Jy beam-1 ([Garrett, Wrobel & Morganti(2004)]). Figure 9 shows the Boötes field observed by the VLBI array. The survey covered a total of 1017 arcmin2 0.28 deg2 divided into several annular fields.
Nine sources were simultaneously detected out of 61 potential targets (see Figure 9). All the sources located in the survey region have brightness temperatures in excess of K, and are likely to be powered by AGN. For the sample as a whole, the VLBI detection rate for sub-mJy WSRT radio sources is 8%. The VLBI detection rate for mJy WSRT sources is higher, 29%. While these values are lower limits on the AGN content in the field, this trend of a falling detection rate with decreasing flux density is consistent with a rapidly evolving radio source population. This direct result supports the MERLIN-VLA and WSRT/ISO observations presented in previous sections, with the sub-mJy and microJy source population typically being identified with moderate redshift star forming galaxies.
Several of the VLBI sources detected in the Boötes field have no or only very faint optical counter-parts. Limits on their K-band magnitudes suggest some significant fraction of these compact radio sources may also be dust obscured AGN, located at (similar to VLA J123642+621331 in the HDF-N). Figure 9 also presents the I-band optical images for the VLBI detections [Jannuzi et al.(2004)].
3.3 Short-term Developments in Deep Field VLBI
The simultaneous detection of several sub-mJy and mJy radio sources in both the EVN and VLBA-GBT deep field observations, suggests that the combined response of sources detected within the primary beam of individual VLBI antennas, may also be used to provide continuous and accurate phase corrections (via self-calibration of all sources in the field-of-view) to wide-field VLBI data. Currently this technique of “full-beam” VLBI self-calibration is most likely to work well at 1.4 GHz, but with improvements expected at higher frequencies (as larger recorded bandwidths are employed), the technique might also be applicable at higher frequencies too. Certainly at 1.4 GHz, it now appears that self-calibration ought to be possible towards any random direction on the sky. Projects such as the PCInt system being developed at JIVE ([van Langevelde et al. 2004]), will enable the full primary beam to be imaged out in VLBI observations minimising the losses due to time and bandwidth smearing. Wide-field, “full-beam” VLBI self-calibration techniques may also be of benefit to standard, singular faint target projects. One potential problem is that the computing resources required for the self-calibration of the huge data sets associated with wide-field (unaveraged) VLBI data sets is considerable. The use of cluster (or GRID) computing resources is probably required (Garrett 2004, in prep).
Another important technical development in VLBI is the introduction of high capacity disk recording systems ([Whitney(2003)]) and even optical fibre connections - eVLBI and the e-EVN (e.g. [Parsley et al. 2004]). Disk systems are currently deployed across the EVN and should be available globally in the astronomical community over the course of the next few years. MicroJy sensitivity levels can be achieved with a global VLBI array using these new systems, opening up many new possibilities, particularly in continuum VLBI.
The surface density of AGN as observed by a high sensitivity, wide-field VLBI array compare very favourably with other instruments over equal integration times e.g. Chandra. Just as there are optically faint radio sources that are not detected by SCUBA as sub-mm galaxies ([Chapman et al. (2004)]) or by Spitzer in the Mid-IR ([Orienti (2004)]), there are also a significant number that are not detected by Chandra in X-rays, even in the deepest 2 Msec HDF-N observations ([Brandt et al. 2004]). As we are aware in everyday life, hard x-rays are not easily absorbed and these so-called Compton-thick sources require extremely high column densities along the line-of-sight towards the obscured AGN ( cm-2). It seems then that deep radio surveys can still be an important source of discovering AGN, that would not otherwise be detectable at other wavelengths. And high sensitivity VLBI observations may be an important tool in distinguishing between AGN and the other “contaminant” radio source populations e.g. the numerous star forming galaxies that dominate the sources detected detected by lower-resolution radio instruments.
4 Future Developments: Pin-pointing AGN with the Square Km Array
Recent studies conducted by [Haiman et al. (2004)], suggest that a significant fraction of the faint radio source population may be located at high redshift. Indeed at the level of 10 Jy they predict, in their simplest models, source surface densities of 10 deg-2 at . The deep field VLBI studies presented earlier, also suggest that at least some fraction of the compact faint radio sources are located at . At these sub-mJy and microJy sensitivity levels, VLBI can play a crucial role in identifying and pin-pointing the location of these distant radio-loud active galaxies, though it will be difficult to confirm the redshift of these systems, especially in the case of optically faint sources.
Next generation radio instruments such as the eVLA/e-MERLIN/eVLBI and the SKA (Square Km Array) will reach microJy and nanoJy sensitivity levels respectively. Star forming galaxies are still likely to be an important component of the source counts at the nanoJy levels probed by the SKA, but if a significant fraction of the array’s collecting area is located on long baselines ( km), it will be possible to pin-point the location of AGN systems over a field-of-view of at least 1 square degree. In particular, the SKA should be able to distinguish between star forming galaxies and AGN on the basis of their radio structure. For example, star forming galaxies will probably be heavily resolved, perhaps revealing multiple unresolved components (SNR, SNe) embedded in extended emission or even more compact clumpy patches of emission associated with recent merger or nuclear starburst activity.
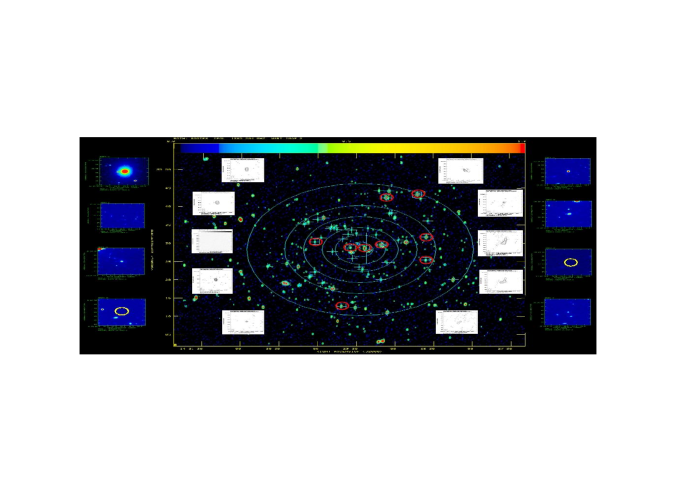
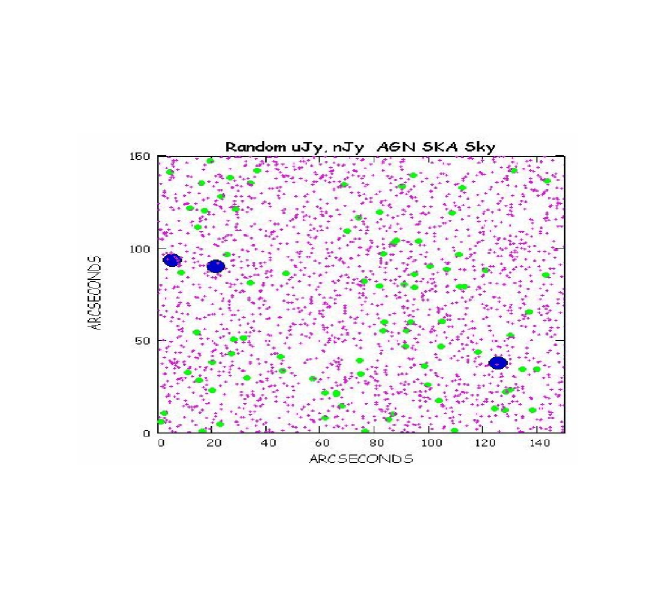
Figure 10 shows a random simulation of what the filtered “AGN sky” might look like generally, as seen by the SKA in a typical integration time of 8 hours. The extent of the field is similar to the original HDF-N region. Star forming galaxies are not represented in this plot, and the limiting sensitivity is nanoJy (). The simulation assumes (simplistically) that the microJy radio sources counts can be extrapolated to these sub-microJy flux densities, and that the fraction of AGN (compared to the total source counts) is the same as that measured in the Boötes field at sub-mJy levels i.e. . A more detailed analysis of the fraction of AGN at these flux density levels is presented by [Prandoni et al. (2004)]. They argue that the AGN fraction will begin to increase again, at sub-microJy and nanoJy levels.
Finally, to return to where we started, it’s exciting to note, that at the 100 nanoJy detection levels routinely enjoyed by the SKA, there are over a 100 billion radio sources in the sky!
Acknowledgements.
I’d like to thank Drs. Loretta Dunne, Raffaella Morganti, Tom Muxlow and Joan Wrobel for permitting me to present some of their images and results as figures in the text. I’d also like to thank Mrs. Janet Eaton for recollecting the exact date of the 57-87 celebrations of the Lovell Telescope (Mk1a) at Jodrell Bank. “I know why you can’t remember!” she remarked.References
- [ Abraham& van den Bergh 2001 ] Abraham, R.G. & van den Bergh, S. 2001, Science, 293, 1273.
- [Appleton et al. (2004)] Appleton, P., Fadda, D., Marleau, F. et al. 2004, ApJS in press.
- [Aussel et al. (1999)] Aussel, H., Cesarsky, C.J., Elbaz, D. et al. 1999, A&A, 342, 313.
- [Barger et al. 1998] Barger, A.J., Cowie, L.L., Trentham, et al. 1998, AJ 117, 102.
- [Brandt et al. 2004] Brandt W.N., Alexander D.M., Bauer F.E., et al. 2004, In “Physics of Active Galactic Nuclei at All Scales”, Alloin D., Johnson R., Lira P., eds, Springer-Verlag, Berlin, in press (astro-ph/0403646).
- [Braun et al. (1987)] Braun, R., Gull, S.F., Perley, R.A. 1987, Nature 327, 395.
- [Chapman et al. (2001)] Chapman, S. C., Richards, E. A., Lewis, G. F. et al. 2001, ApJ, 548, L147
- [Chapman et al. (2004)] Chapman, S. C., Smail, I., Blain, et al. 2004, ApJ in press (astro-ph/0406596).
- [Cohen et al. (2000)] Cohen, J.G., Hogg, D.W., Blandford et al. 2000, ApJ, 538, 29.
- [Coleman & Condon (1985)] Coleman, P. H., & Condon, J. J. 1985, AJ, 90, 1431
- [Condon (1984)] Condon, J. J. 1984, ApJ, 287, 461
- [Condon (1992)] Condon, J. J. 1992, ARA&A, 30, 575
- [Dunlop et al. 2004] Dunlop, J. S., McLure, R. J., Yamada, T. et al. 2004, MNRAS, 350, 769.
- [Dunne et al. (2003)] Dunne, L., Eales, S., Ivison, R. et al. 2003, Nature 424, 285.
- [Fomalont et al. (2002)] Fomalont, E. B., Kellermann, K. I., Partridge, R. B. et al. 2002, AJ, 123, 2402
- [Garrett et al.(2000)] Garrett, M. A., de Bruyn, G., Giroletti, M. et al. 2000, A&A, 361, L41.
- [Garrett et al.(2001)] Garrett, M. A., Muxlow, T.W.B., Garrington, S.T. et al. 2001, A&A, 366, L5.
- [Garrett(2002)] Garrett, M. A., 2002, A&A, 384, L19 (astro-ph/0202116)
- [Garrett, Wrobel & Morganti(2004)] Garrett, M. A., Wrobel, J.M. & Morganti, R. 2004, ApJ, submitted (see also astro-ph/0403642 & astro-ph/0301465)
- [Haiman et al. (2004)] Haiman, Z., Quataert, E. & Bower, G. C., 2004, ApJ submitted (astro-ph/0403014)
- [Helou & Bicay (1993)] Helou, G. & Bicay, M. D. 1993, ApJ, 415, 93
- [Hughes et al. (1998)] Hughes, D., Serjeant, S., Dunlop, J., et al. 1998, Nature 394, 241.
- [Jannuzi et al.(2004)] Jannuzi, B. T., et al. 2004, ApJ, submitted
- [Koyama et al.(1995)] Koyama, K., Petre, R., Gotthelf, E. V. et al. 1995, Nature 378, 255.
- [Mitchell & Condon (1985)] Mitchell, K. M., & Condon, J. J. 1985, AJ, 90, 1957
- [Muxlow et al. 2004] Muxlow T.W.B. et al. 2004, MNRAS submitted.
- [McMahon et al. (2001)] McMahon, R.G., Helfand, D.J., White, R.L. & Becker, R.H. 2001, ApJ, XXX
- [Morganti et al. 2004] Morganti, R., Garrett, M.A., Chapman, S. et al. 2004, A&A in press (astro-ph/0405418).
- [Orienti (2004)] Orienti, M. et al. 2004, in preparation.
- [Oort (1987)] Oort, M. J. A. 1987, A&AS, 71, 221
- [Parsley et al. 2004] Parsley, S. et al. 2004. IVS 2004 General Meeting Proceedings, edited by N. R. Vandenberg and K. D. Baver, NASA/CP-2004-212255.
- [Prandoni et al. (2004)] Prandoni, I. et al. 2004, “Exploring the Cosmic Fronteir”, ESO Astrophysics Symposia series, Springer-Verlag (astro-ph/0407499).
- [Richards et al. 1998] Richards, E.A., Kellermann, K.I., Fomalont, E.B., et al. 1998, AJ 116, 1039
- [Richards (1999)] Richards, E. A.; Fomalont, E. B.; Kellermann, K. I. et al. 1999, ApJ 526, 73.
- [Richards (2000)] Richards, E. A. 2000, ApJ, 533, 611
- [Smith et al.(1998)] Smith, H. E., Lonsdale, C. J., Lonsdale, C. J. et al. 1998, ApJL, 493, 17
- [van Langevelde et al. 2004] van Langevelde H.J., Olnon F., Verkouter H., et al. 2003, ADASS 2003, Strasbourg, France, (astro-ph/0401014).
- [Waddington et al. 1999] Waddington, I., Windhorst, R.A., Cohen, S.H., et al. 1999, ApJ 526, L77.
- [Whitney(2003)] Whitney, A. R. 2003, New Technologies for VLBI, ed. Y.C. Minh, ASP Conference Series, 306, 123.
- [Windhorst et al. 1985] Windhorst, R. A., Miley, G. K., Owen, F. N., et al. 1985, ApJ 289, 494
- [Williams et al. 1996] Williams, R.E., Blacker, B, Dickinson, M. et al. 1996, AJ, 112, 1335.
- [Wrobel et al. 2004] Wrobel, J.M., Garrett, M.A., Condon, J.J. & Morganti, R. 2004, AJ submitted (astro-ph/0404007)