Test results of a prototype designed to detect horizontal cosmic ray flux
Abstract
In this paper we report test results from a prototype designed to detect muons from horizontal air shower at large zenith angle, . To detect horizontal tracks and their directions we select them according the muon vertical equivalent charge and we measure the time of flight with a time resolution of 800 ps. Several measurements are collected at different zenith angles. The background studies performed with two modules show that the main source is due to tracks crossing the module at the same time. The upper limit of background flux for a single twin module is estimated to be . We estimated the size of the surface array necessary to detect the shower flux of the order of if originated by Tau Air-Showers secondaries of GZK neutrino Tau below the horizons.
1 Introduction
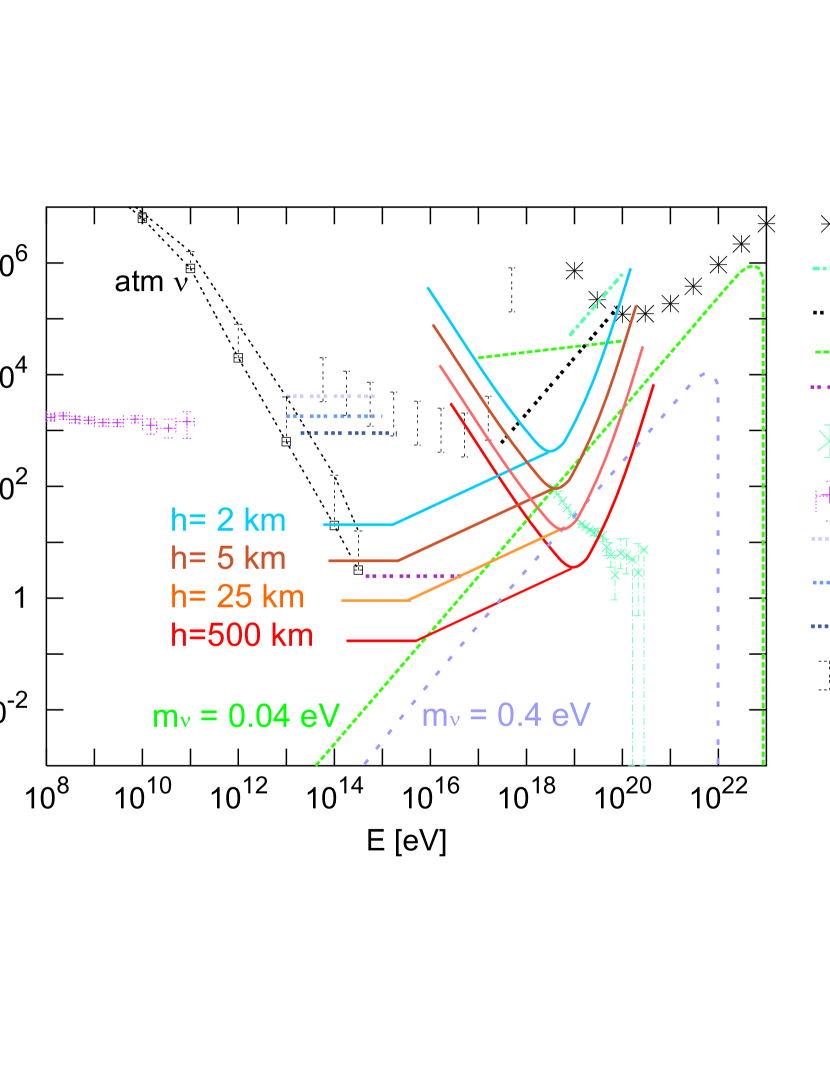
One of the interesting subject in Astroparticle Physics is the understanding of the origin and the composition of the energy spectrum of Ultra High Energy Cosmic rays (UHE) that exceed eV. These UHECR are just near the so called GZK cut-off opacity due to cosmic black body radiation. These UHECR should be also source of secondary neutrinos by photopion production made by GZK cut-off. Many experiments detect neutrinos by looking for showers or tracks from charged leptons produced by charged current interaction of neutrinos of eV. At present time there are several measurements of cosmic ray flux made with several techniques [1, 2, 4, 5, 6]. Next generation experiment above eV is sensitive to neutrinos typically from the near horizontal air-showers. These projects include the Southern site of Pierre Auger Observatory able to detect by photo-luminescent lights along the horizontal showers (). Recently several authors have pointed the interest to the horizontal showers produced by the interaction of ultra high energy (UHE) neutrinos on the Earth crust [7, 8, 11, 9]. A measurement of horizontal showers provides a test of the GZK model as an indirect constraints of the ultra-high energy neutrino fluxes [13]. Fig. 1 shows the neutrino fluxes per flavour as predicted by Top-Down model with p=1 and GeV/ and compared to future experimental sensitivity, [13].
In this paper we present a prototype module designed to detect horizontal cosmic ray flux and we show the test results obtained in laboratory for a single module as for two modules. We discuss also a possible engineering array to reach a sensitivity of the order of .
2 A unit of the detector
The basic idea is to measure the flux of particles from a shower produced horizontally in the atmosphere by the interaction of ultra high energy (UHE) neutrinos on the Earth’s crust. The air shower is a complex chain of interactions resulting in a large number of particles. The predicted transverse length of the shower at ground level should be about . The best solution to detect muons produced by horizontal air shower consists in assembling several detectors pointing the horizon from the top of a mountain in an large surface array. A good time correlation of the signals of about 20 ns provides the time structure of muonic showers and a time resolution along the shower propagation of about 1 ns provides the background rejection as discussed in next section. The array will be discussed in section 5. The elementary module, called “tower” throughout this paper, tested is composed by three tiles of Bicron scintillator of 12.5 12.5 and of thickness put parallel in a frame shown in Fig.2.

The three tiles in the paper are called C1, C2 and C3 and they are apart between them . Two of them, C1 and C2, located at coordinate equal and coordinate equal respectively, are used to define the electronic coincidence; the third tile, located between them, is used to study and to remove the background. The distance of the centers of the tiles can be varied from to . The scintillators are read by a Hamamatsu Photo-Multiplier coupled to the scintillator by an optical connector. The PM has a transit time spread of less than and a low-voltage power supply. This choice requires a simple power supply system. To measure horizontal cosmic ray flux we need know the time arrow, i.e. select the muons from the horizon and remove particles from other directions. That requires the measurement of the time of flight between two tiles (C1,C2). The results shown were performed with a setup where the distance between C1 and C2 was and the data were taken at different zenith angles and at ground level. One test was performed also with the C3 tile to understand the backgroud.
2.1 The background
The measurement of a cosmic particle passing through two tiles distant is affected by three kinds of background:
-
•
a) a pair of different particles cross at the same time the two tiles (C1,C2).
-
•
b) a particle crosses one tile and the noise of second tile gives a coincidence
-
•
c) two particles from different mini-showers cross the first (C1) and 3rd (C2) tile at different time.
The background a) can be removed by a good timing: ; the background b) can be removed appling a cut on the charge deposited into the scintillators; The background c) must be evaluated and it cannot be removed. That defines our response in term of signalnoise.
2.2 Detector calibration and definition of an horizontal track
We calibrated the detector using and radioactive sources and the cosmic rays. For and we used the end-point of the spectrum, even for , because of the poor energy resolution; for cosmic rays we assumed mimimum ionization particles and changed the mean crossing length altering the angle of the central tile with the others, from parallel () to orthogonal (, corresponding to path length in the scintillator). Fig.3 shows the charge deposited into the scintillator as function of the energy lost.

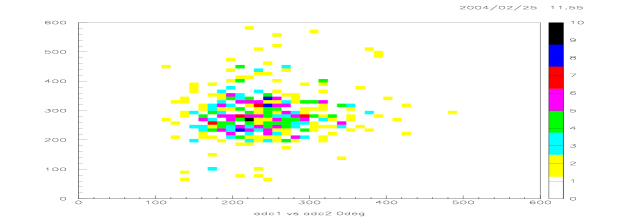
To isolate the particle crossing orthogonal the detector we registered a sample of cosmic rays with the detector positioned at zenith angle equal degrees. Analyzing the charge deposited into the scintillator we found a set of cuts to define a particle crossing the detector within a solid angle of . The sample of events selected by these cuts is still contaminated by a background of type a), described above. The time of flight and the information of the energy deposited in C2 will remove this contribution. Fig.4 shows the charge deposited into tile C1 and C2 by a vertical muon of energy greater than 1 . The poor energy resolution is due to the light collection method: to enhance our time resolution we decided to remove any light yield enhancement technique and take only the light that travels on a straight line, from the interaction point to the photocathode; more precisely, we observed that any further reflection is harmful for time resolution, so we decided to loose the energy resolution to make direct light collection dominant. The charge of vertical equivalent muon (CVEM), as discussed before, is used to define a set of cuts ( 2.5 nC around the average deposited charge) to select horizontal charged tracks. It also let us remove events falling in regions of the scintillator affected by a large time spread in light collection, giving us an enhancement in time resolution; this has been proved by testing the light collection time uniformity of a single tile, by coincidence with a thin plastic scintillator of signals from a source.
2.3 The time resolution
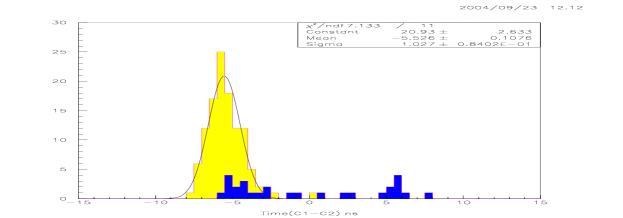
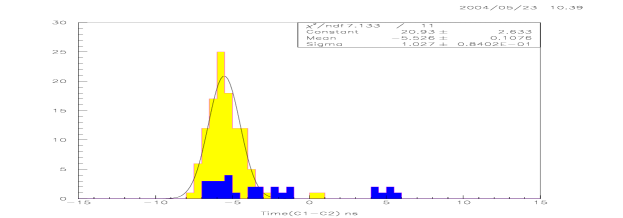
To evaluate the time resolution of the apparatus we put the centers of two tiles at a distance of . The distribution obtained, shown in Fig.5, has a . Then an event with is not a single track passing through C1 and C2.

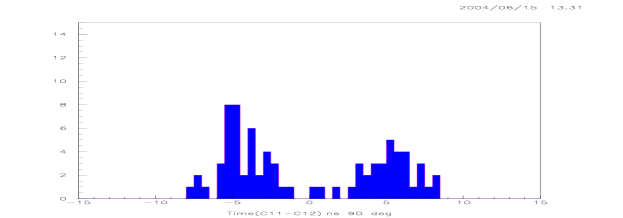
Fig.6 shows the time response when the detector is at zenith angle equal (yellow). Being the distance between the centers of the two tiles the time of flight is ns. The distribution with the detector oriented at zenith equal is also plotted (blue). The peaks at correspond to horizontal tracks crossing C1 then C2 or viceversa. The events at are generated by two tracks that cross at the same instant the two tiles.
3 Angular detection of muon flux by one tower and evaluation of the background
The results of about 400 hours live time recorded at lowest of a four floor building are summarized in Table 1. At that place we are screened by most of the direct gamma shower secondaries in open air.
| deg | Run time | C1 10-3Hz | C2 10-3Hz | Fig | |
|---|---|---|---|---|---|
| 0 | 29h:48m | 6.440.05 | 0.002 | 7.90.9 | 6 |
| 86.5-93.5 | 65h:26m1 | 0.0340.010 | 0.042 0.010 | 4.21.5 | 6 |
| 86.5-93.5 | 125h:00m2 | 0.0250.01 | 3.21.5 | 9 | |
| 86.5-93.5 | 125h:00m2 | 0.020 0.01 | 2.51.3 | 9 | |
| 81.6-88.8 | 111h:11m 2 | 0.045 0.01 | 6.61.5 | 10 | |
| 81.6-88.8 | 111h:11m 2 | 0.015 0.01 | 2.20.9 | 10 | |
| 75.5-81.8 | 111h:11m | 0.130 0.002 | 1.90.3 | 11 | |
| 75.5-81.8 | 111h:11m | 0.00250.0025 | 3.73.7 | 11 |
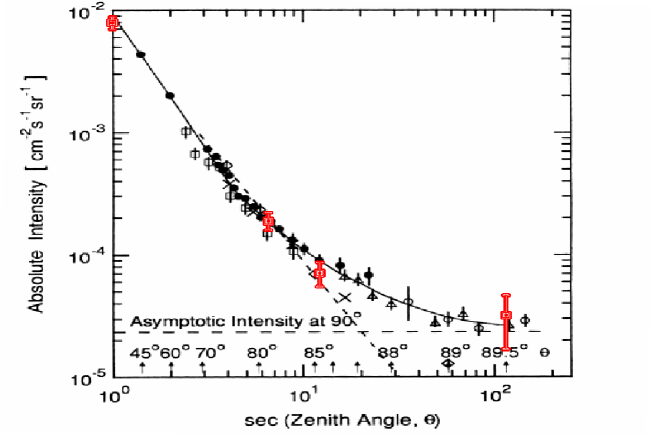
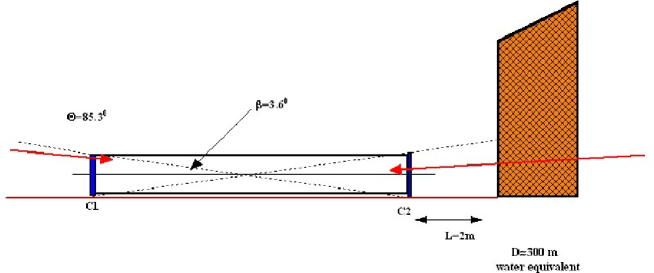
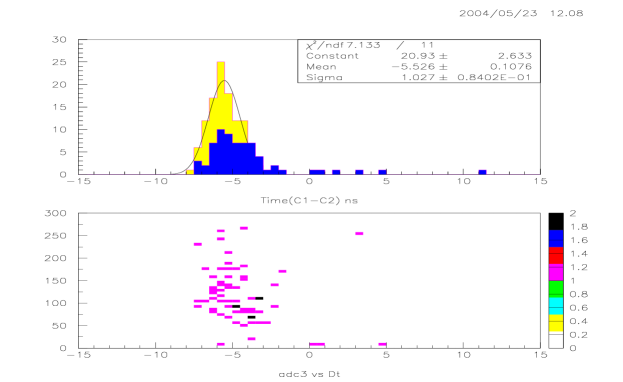
In table 1 is evaluated the intensity of muon as function of zenith angle corrected by detector efficiency. The last six raw give the results obtained pointing the detector to a step of concrete as shown in Fig.7. The step drawn on right side (South-West) of the layout permits to the muons at large zenith angle (greater than 88 degrees) cross at least 50 m of concrete. On the left side (North) muons cross the detector at angle smaller than 85 degrees directly from the atmosphere. The measured difference of the muon flux from North and from South corresponds to about 100 m water equivalent. Fig.10 shows the C1-C2 time difference (blue histogram) for zenith angle 88.80-81.60 . Yellow histogram is obtained with the detector at zenith equal . The measured difference of factor 2 in flux is due to the change of acceptance. Fig.11a shows the results with the detector at zenith angle equal to 75.50-81.80. At this angle the cosmic rays hit before C1 tile than C2 tile hence the time difference defined is negative. The plot in Fig. 11b shows the ADC counts of the C3 tile located between C1 and C2 versus the . By this plot we estimate an upper limit to background (type c, cfr. 2.1) of order of for each module. The results of Table 1 are plotted in fig.7.
4 Test results with two towers
To study the background and optimize the distance of C1 and C2 tile we have inserted a second module in the trigger gate.
4.1 Setup at zenith angle
We recorded the ADC counts and the TDC signals from the two modules set at zenith and located at distance , and . The rate of two particles crossing vertically both modules, distant , in the trigger gate was 3.7 Hz. No events were found when the second module was set vertically at distance and . These measurements tell us no background from vertical is present when the tiles are distant or more.
4.2 Setup at zenith angle to evaluate the sensitivity
To complete these tests, due to the fact our detector works horizontally ,we performed the same measurement with the two modules at zenith angle and set parallel at distance of . In this setup we have measured a rate of 1.5 Hz of events when one track crosses one module and only one tile of the second module was hit by another track at the same time. The two modules were set at a distance of running for s (20 days) to estimate the background upper limit. During this data taking we did not see events, then the sensitivity is , being our gate of about , in agreement with muon bundles flux reported in Ref.[15].
5 The of the event and estimate of detector sensitivity
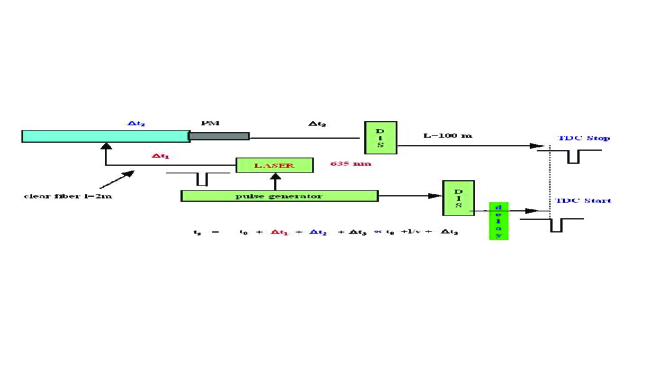
The of the events recorded by each module can be obtained using clear fibers connected to the tiles and transporting a pulse of monochromatic laser light. Fig.12 shows the setup used to evaluate the time resolution with two modules 300 m apart. It results to be less that 10 ns. The measurement of the time of the signal transmitted from the PM to the DAQ is evaluated recording the arrival time and subtracting the time spent by the pulse to reach each tile: the time resolution results to be less than 10 ns.
The flux detection limit can be estimated by
where is the number of the events. the live time, the effective surface observed by the detector, the solid angle and the neutrino efficiency conversion. Neglecting the energy dependence of and assuming, for simplicity, for Earth skimmed events, we obtain a detector sensitivity, for frontal showers originated at about , of 1.7 events/year with a flux of and a total detector live surface of . This is actually an upper limit because of neglected geometrical and physical effects determined by the actual in situ configuration and has to be interpreted as a fraction of the total flux, limited to Earth skimmed events; it gives, for a observer, a corresponding sensitivity of about , obtained by rescaling for the ratio , that estimates a correction for the assumption of frontal showers. The assumption that of live surface is enough to achive this level of discrimination is based on phenomenological studies [8].
6 SUMMARY
In conclusion the background measured for a single module is sufficient for a reliable detection of muons from horizontal showers if the distance of the tiles is between to . This setup permits also to have a detector sensitivity of , by an array with a live surface of . At this flux level the Tau-Air Showers by GZK neutrinos might be already able to pollute above the atmospheric muon fluxes [14]. Therefore a small size array at top of the mountains would be able to reach neutrino astronomy at minimal guaranteed GZK fluence.
Acknowledgments
M. I. thanks G. Boca for many discussions and the authors are indebted for invaluable technical support from F. Pulcinella.
References
References
- [1] M. Tekedat et al. Agasa Collaboration, Astropart. Phys. 19 447 2003
- [2] see http://icecube.wisc.edu
- [3] Niessen P. Amanda Collaboration astro-ph/0306209
- [4] T. Abu-Zayyad et al. High Resolution Fly’s Eye Collaboration, astro-ph/0208243
- [5] The Pierre Auger Project Design Report by Auger Collaboration FERMILAB-PUB-96-024
- [6] D. DeMuth et al. submitted to Phys. Lett B March 5 2003;
- [7] Fargion D., Mele B. and Salis A. astro-ph/9710029, 1999 Ap. J. 517, 725;
- [8] D. Fargion; astro-ph/0002453: The Astrophysical Journal 570 2002;
- [9] J. L. Feng et al. Phys. Rev. Lett. 88 16 22 ;
- [10] J.F. Beacom et al. Phys. Rev. D 66 021302 2002
- [11] D. Fargion,P.G.De Sanctis Lucentin,M.De Santis,M.Grossi; hep-ph/0305128; Ap.J.613, 2004
- [12] Kalashev O. E., Kuzmin V. A., Semikoz D.V. and Sigl G. 2002 Phys. Rev. D 66 063004
- [13] D. V. Semikoz and Gunter Sigl hep-ph/0309328
- [14] Fargion, D., Khlopov, M., Konoplich, R., De Sanctis Lucentini, P. G., De Santis, M., and Mele, B., 2003, Recent Res. Devel.Astrophysics., 1, 395
- [15] I.I. Yashin Proceeding IV Int. Conf. NANP’03 23 June 2003 Dubna
- [16] L. Cazon et al. arXiv:astro-ph/0311223 10 Nov 2003
- [17] S. Yoshida et al. astro-ph/0312078
- [18] A. M. Anokhima et al. Phys. Rev. D 60 033004 1999
- [19] Cosmic Rays