The Complex Interstellar Na i Absorption toward h and Persei
Abstract
Recent high spatial and spectral resolution investigations of the diffuse interstellar medium (ISM) have found significant evidence for small-scale variations in the interstellar gas on scales pc. To better understand the nature of small-scale variations in the ISM, we have used the KPNO WIYN Hydra multi-object spectrograph, which has a mapping advantage over the single-axis, single-scale limitations of studies using high proper motion stars and binary stars, to obtain moderate resolution ( km s-1) interstellar Na i D absorption spectra of 172 stars toward the double open cluster h and Persei. All of the sightlines toward the 150 stars with spectra that reveal absorption from the Perseus spiral arm show different interstellar Na i D absorption profiles in the Perseus arm gas. Additionally, we have utilized the KPNO Coudé Feed spectrograph to obtain high-resolution ( km s-1) interstellar Na i D absorption spectra of 24 of the brighter stars toward h and Per. These spectra reveal an even greater complexity in the interstellar Na i D absorption in the Perseus arm gas and show individual components changing in number, velocity, and strength from sightline to sightline. If each of these individual velocity components represents an isolated cloud, then it would appear that the ISM of the Perseus arm gas consists of many small clouds. Although the absorption profiles vary even on the smallest scales probed by these high-resolution data (; pc), our analysis reveals that some interstellar Na i D absorption components from sightline to sightline are related, implying that the ISM toward h and Per is probably comprised of sheets of gas in which we detect variations due to differences in the local physical conditions of the gas.
1 Introduction
Observations of optical interstellar absorption lines toward early-type Galactic stars have long been used to investigate the structure of the interstellar medium (ISM) in the Milky Way. For example, Münch (1953; 1957) examined interstellar Na i and Ca ii absorption lines in the spectra of 112 distant, bright, early-type stars to determine if the velocity profiles showed any systematic features that would provide evidence for the large-scale distribution of interstellar clouds. These observations revealed substantial concentrations of interstellar gas toward Perseus and Cepheus that were coincident with the recently recognized spiral arm features of the Milky Way (Morgan, Sharpless, & Osterbrock 1952). In addition to recognizing the advantage of using interstellar absorption lines toward clusters and associations to map large-scale ( pc) interstellar structures in the Galaxy, Münch (1953) also remarked that interstellar absorption line spectra show appreciable variation for stars within the same cluster. Thus, interstellar absorption lines could also be used to examine the small-scale variations of interstellar structures ( pc) in the diffuse ISM.
Recently, high spatial resolution radio and optical studies of the diffuse ISM have found significant evidence for small-scale structures in the ISM. Observations of H i 21-cm absorption toward extended extragalactic radio sources (Dieter, Welch, & Romney 1976; Diamond et al. 1989; Faison et al. 1998; Faison & Goss 2001) and high-velocity pulsars (Frail et al. 1994) have suggested the presence of structure in diffuse clouds on scales of tens of AUs. The ubiquity of such structures, however, has been called into question (Deshpande 2000; Johnston et al. 2003; Stanimirović et al. 2003). High-resolution 21-cm emission-line aperture synthesis maps reveal a diverse population of H i self-absorbing clouds with apparent diameters pc in the Perseus spiral arm (Gibson et al. 2000). In the optical, studies have focused on high proper motion stars (Crawford et al. 2000; Lauroesch, Meyer, & Blades 2000; Welty & Fitzpatrick 2001; Crawford 2002; Lauroesch & Meyer 2003; Rollinde et al. 2003), binary stars (Meyer & Blades 1996; Watson & Meyer 1996; Lauroesch et al. 1998; Lauroesch & Meyer 1999; Price, Crawford, & Barlow 2000; Price, Crawford, & Howarth 2001a), and globular clusters (Bates, Kemp, & Montgomery 1993; Kennedy, Bates et al. 1995; Kennedy, Bates, & Kemp 1996; Kennedy, Bates, & Kemp 1998; Meyer & Lauroesch 1999; Andrews, Meyer, & Lauroesch 2001; Smoker et al. 2001), typically using the Na i D, K i, and Ca ii K lines. These observations have revealed interstellar structure on scales of AU for high proper motion stars, AU for binary stars, and AU for globular clusters.
At present, the precise nature of these small-scale features is not well understood. Assuming spherical geometries, the H i volume densities of the small-scale clouds detected in 21-cm absorption are (H i) cm-3 with inferred thermal pressures of P cm-3 K (Heiles 1997). Thus, these small-scale features are significantly over-pressured with respect to the ambient ISM and should dissipate on time-scales of yrs. Consequently, they should not be a frequently detected component of the ISM. In order to resolve this discrepancy, several alternatives have been proposed. Heiles (1997) suggested that the small-scale absorbing features may be cylinders seen face-on or disks seen edge-on, instead of having spherical geometries. Deshpande (2000) has suggested that the small-scale H i absorbers represent the tail-end of hierarchical structure in the ISM and that the measured transverse size of the absorbing clouds is not necessarily indicative of the depth through the absorbing clouds. In the optical, studies of small-scale structure in the ISM using interstellar Na i D absorption are hindered by the fact that Na i is not a dominant ion in diffuse clouds. Thus, it is possible that the structures detected using interstellar Na i D absorption are not changes in the physical structure of the gas but rather caused by fluctuations in the physical conditions of the gas such as cloud temperature, pressure, electron density, and/or radiation field. Thus, it is uncertain if the variations detected on small scales are caused by changes in the density of the interstellar gas, changes in the ionization balance, cloud geometry or a combination of all these effects (Pan, Federman, & Welty 2001).
In order to further investigate the small-scale structure of the ISM, we have used the Hydra multi-object spectrograph on the 3.5-m WIYN111The WIYN Observatory is a joint facility of the University of Wisconsin-Madison, Indiana University, Yale University, and the National Optical Astronomy Observatories. at Kitt Peak National Observatory (KPNO) to obtain moderate resolution ( km s-1) interstellar Na i D absorption spectra of 172 stars toward the double open cluster h and Persei (NGC 869 and NGC 884, respectively). This sightline is interesting because it passes through higher velocity gas ( km s-1) associated with the Perseus spiral arm (Münch 1957) as well as the more local gas associated with the Orion spiral arm. Furthermore, we have obtained high-resolution ( km s-1) interstellar Na i D absorption spectra toward 24 stars in the double open cluster. Using stars in an open cluster or OB association as background sources to probe intervening small-scale structure has a mapping advantage over the single-axis, single-scale limitation of a high-proper motion or binary stars. In effect, it is possible to obtain an absorption line map of interstellar Na i using this method of multi-object spectroscopy.
This paper is organized as follows. Section 2 provides details of the observations that are used for this study and their reductions. The analysis of these data is described in §3. We interpret our results in §4. In §5, we summarize our results.
2 Observations and Data Reduction
2.1 KPNO WIYN Hydra Multi-Object Spectra
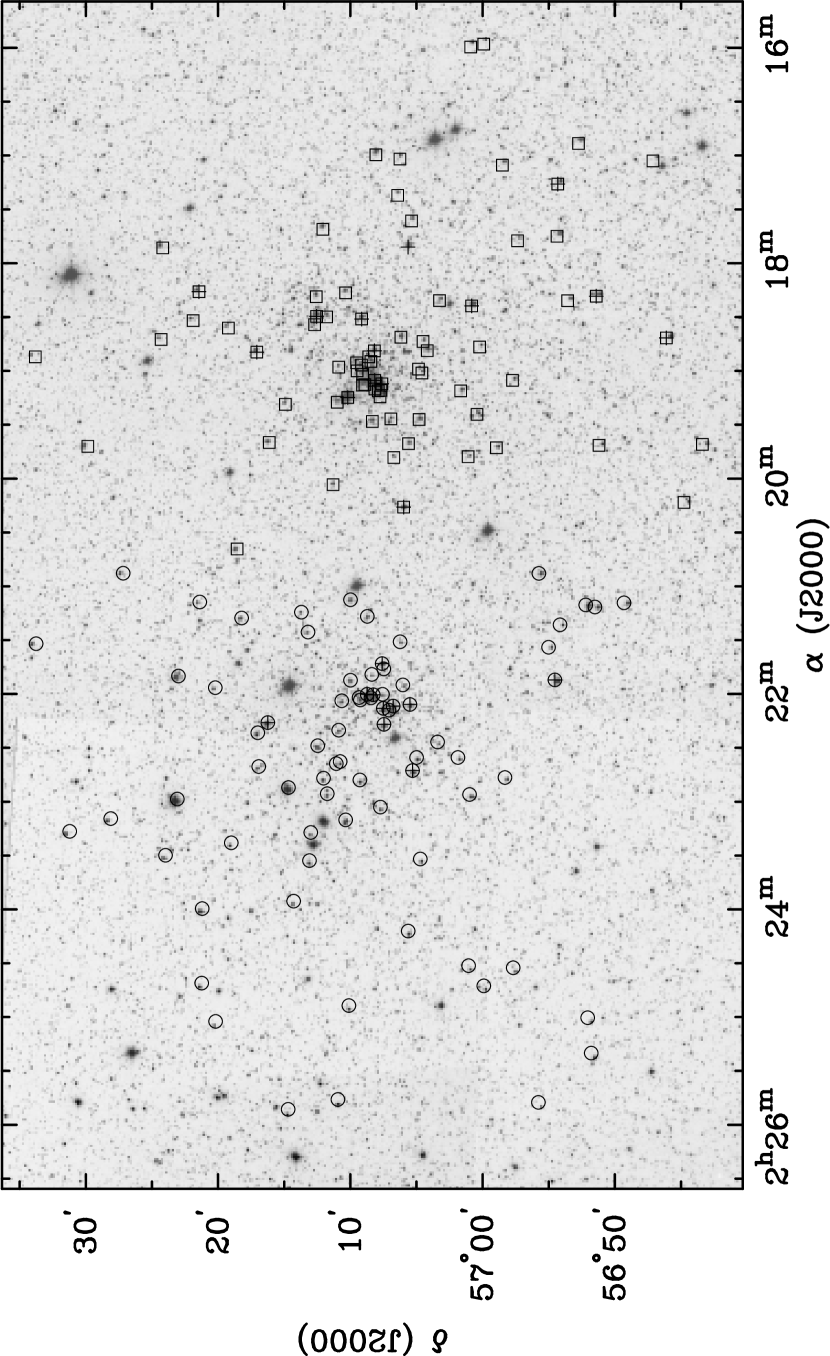
The KPNO WIYN observations of h and Per were obtained in 1998 September and October using the Hydra multi-object spectrograph in queue mode. Using the red cable fibers (2 diameter), Hydra can observe up to about 90 objects at a time over a 60 diameter field with a minimum fiber separation of 37. Two Hydra configurations per cluster were observed in order to circumvent this minimum spacing limitation. As shown in Figure 1, a total of 172 stars were observed with angular separations ranging from 11.5 to 4950 which would correspond to linear separations ranging from about 0.1 pc to 50 pc at the double cluster distance of 2000 pc. The spectrograph was configured with the Red Bench camera, a Tek 2048 CCD (T2KC), the echelle grating, and an interference filter (X17) providing spectral coverage from 5725 to 5965 Å at a 2.0 pixel resolution of 0.24 Å or 12 km s-1. We present the 150 moderate resolution (12 km s-1) spectra along the sightlines that show interstellar Na i D2 absorption in Perseus spiral arm gas in Figure 2.
Utilizing this instrumental setup, net exposures ranging from 1800 to 3600 s were taken of the h and Per stars under clear sky conditions characterized by 1–2 seeing. The individual CCD frames were background-corrected, flat-fielded, combined, and wavelength-calibrated using the NOAO IRAF222IRAF is distributed by the National Optical Astronomy Observatories, which are operated by the Association of Universities for Research in Astronomy, Inc., under cooperative agreement with the National Science Foundation. data reduction package in order to extract the net stellar spectrum yielded by each illuminated fiber. Based on previous observations with this spectrograph and on data comparisons with the KPNO Coudé Feed spectrograph, the uncertainty in the zero level of these spectra due to uncorrected scattered-light effects should be less than 3%. In order to remove the telluric absorption in the vicinity of the Na i D2 5889.951 and D1 5895.924 lines, these spectra were all divided by an atmospheric template based on observations of several rapidly rotating early-type stars with little intervening interstellar matter. The resulting Na I spectra of the 172 stars observed toward h and Per have pixel-to-pixel S/N ratios ranging from 40 to 300.
2.2 KPNO Coudé Feed Spectra
The KPNO Coudé Feed spectrograph observations of stars in h and Per were obtained in 2001 November and 2002 November using Camera 5 with the echelle grating and a Ford 30001000 pixel CCD chip. The resolution of the data was measured using the ThAr lamp emission lines and is 3.4 km/s at the position of the Na i D lines. A total of 24 stars were observed with spectra covering the region between 5400 and 6800Å. Except for the very brightest stars (for which exposure times of 1800 and 2700s were used) individual exposures were 3600s long, with total exposure times ranging up to 5 hours. For the majority of the stars exposures were taken on different nights at different grating tilts to reduce the effect of any flaws in the CCD chip. However, due to poor weather it was not possible to get more than one exposure for 6 of the brighter stars in the sample. Exposures of blank sky were obtained during each run for background subtraction purposes, and in addition observations of the stars Aql and Leo were obtained each night as a template for dividing out telluric absorption. These 24 stars were selected from the larger WIYN sample to provide good coverage of the clusters, and because they had sufficiently large ultra-violet fluxes (as well as large ) to be observed using the Far-Ultraviolet Spectroscopic Explorer (FUSE) satellite.
Reduction of the data was done with the NOAO IRAF echelle data reduction package. The individual frames were first bias-subtracted and flat-fielded, then the scattered light was removed. The individual orders were then optimally extracted and cleaned of cosmic-ray hits using the variance weighted extraction method (Horne 1986; Marsh 1989). All of the resulting one-dimensional spectra then had the night sky background (including Na i D emission lines) removed using appropriately scaled exposures of blank sky taken during each run. The sky-subtracted one-dimensional spectra were then wavelength calibrated, corrected for telluric absorption, shifted to heliocentric coordinates, summed, and finally continuum fitted using low-order polynomials. Figures 3 and 4 show the final Na i D2 line profiles. The resulting signal-to-noise (S/N) ratios for these observations are typically 40–50 per pixel, with two faint stars having S/N-ratios of 30–35, and some of the brighter stars having S/N-ratios of 60–80 per pixel.
3 Analysis
Our analysis includes a discussion of the identification of stars used as background sources in our sample and an assessment of their cluster membership. We then describe the observed trends in the interstellar Na i D absorption of the Perseus spiral arm gas ( km s-1) toward h and Per as revealed by our moderate resolution WIYN data and our high-resolution Coudé Feed data. In the discussion and figures we primarily focus on examining the interstellar Na I D2 absorption toward h and X Per in order to better show the weaker features in the gas associated with the Perseus spiral arm, although in our analysis we have also considered the weaker D1 profile.
3.1 Stellar Identification
Before identifying the stars in our WIYN sample, we first examined the spectra and removed the stars which showed no interstellar Na i D absorption in the Perseus arm gas. After this was completed, 150 of 172 stars remained in our sample. The identification of these 150 stars was then made by searching the SIMBAD database for stars within a 1′′ radius of the positions of the Hydra spectrograph fibers and yielded the identities of 88 stars in our sample. This search was subsequently repeated using search radii of 2′′ and 4′′. Even when the search radius relaxed to 4′′, the majority of stars (125 stars) only have one designation in the SIMBAD database. The remaining stars have either two (22 stars) or three (3 stars) possible designations. In order to determine which of the multiple stellar identifications were more likely, we examined the Digital Sky Survey plates toward h and Per and determined the stellar identification based on the positions and brightness of the stars.
After the stars used as background sources in this study were identified, we investigated the cluster membership of the stars by comparing our list of identifications with that of Slesnick, Hillenbrand, & Massey (2002). In this manner, we determined a cluster membership of h Per, Per, or neither for the stars in our sample. For stars in our sample that Slesnick et al. (2002) do not recognize as members of either h Per or Per, we assigned the stars to either an h Per or Per “field” based on the stars’ projected distances to the cluster cores (h Per: , ; Per: , ). This resulted in 74 stars in our sample as being projected toward h Per and 76 stars lying projected toward Per.
3.2 Moderate Resolution Spectra
After stars in our moderate ( km s-1) resolution Hydra sample were identified and assigned to one of the clusters, we can begin to examine the interstellar Na i D2 (5889Å) absorption toward each cluster. To investigate the variations in interstellar Na i D2 absorption toward each cluster, we sorted the spectra into declination bins and arranged them from east to west, roughly corresponding to their position on the sky. We present the interstellar Na i D2 absorption spectra toward and h Per in Figures 2a & b, respectively. In Figure 2 we have labeled the spectra with the appropriate stellar identifications from the Henry Draper (HD; Cannon & Pickering 1918), Bonner Durchmusterung (BD; Argelander 1903), and Oosterhoff (Oo; Oosterhoff 1937) catalogs. The eleven unlabeled spectra in Figure 2 have identifications, but they are not listed in the three aforementioned catalogs. Where applicable, we have designated the cluster memberships of stars in Figure 2, as determined by Slesnick et al. (2002), and also labeled stars within a radius of the respective cluster cores.
Our Hydra interstellar Na i D2 absorption line profiles reveal a very complex velocity structure from point-to-point over the spatial extent of and h Per. In addition to the saturated interstellar Na i D2 absorption by local, low velocity gas ( km s-1) in the Orion spiral arm, the spectra toward and h Per show interstellar Na i D2 absorption at intermediate ( km s-1) and higher ( km s-1) velocities that is associated with the Perseus spiral arm. As seen in Figure 2, all of these spectra show different interstellar Na i D2 absorption profiles for gas in the Perseus spiral arm, i.e., no two profiles are identical.
The moderate resolution interstellar Na i D2 absorption line spectra toward and h Per can be classified as having one of three different shapes: (1) blended with no distinct peaks in the Perseus arm gas (e.g., Oo 2794, Oo 892); (2) one distinct peak in the Perseus arm gas with an extended wing suggesting more components (e.g., BD56°560, HD 14162); and (3) two distinct peaks in the Perseus arm gas (e.g., BD56°610, HD 14186). The vast majority of the absorption line spectra () toward h and Per fall into the second classification category. As we discuss in §3.3, higher resolution ( km s-1) KPNO Coudé Feed spectra reveal a multitude of interstellar Na i D2 absorption components along any particular sightline. Therefore, some care must be exercised to avoid over-interpreting the moderate resolution ( km s-1) spectra. We discuss the moderate resolution interstellar Na i D2 absorption spectra toward each cluster in more detail below.
3.2.1 Per
The interstellar Na i D2 absorption line profiles toward Per (Figure 2a) reveal a very chaotic structure in terms of both velocity and intensity variations in the Perseus arm gas. As previously mentioned, we have arranged the spectra in Figure 2a so that their location in the figure approximates the spatial distribution of the stars toward the cluster. Thus, we will discuss variations in the interstellar Na i D2 absorption line profiles in terms of their strength, or optical depth (), in a given velocity range as a function of their spatial distribution across the cluster.
In the northeastern region of Per, the interstellar Na i D2 absorption profiles are asymmetric. The interstellar absorption associated with the higher velocity ( km s-1) gas appears as an extended blue wing in the line profile and the intermediate velocity ( km s-1) gas appears as a bump on the line profile between the higher velocity component and the saturated low velocity Orion arm gas. In contrast, the interstellar Na i D2 absorption of Perseus arm gas is more apparent toward the rest of the stars in this field. Toward the core of Per the interstellar Na i D2 absorption is stronger in both the higher and intermediate velocity components of the Perseus arm gas. Consequently, the majority of spectra along these sightlines seem to be double-peaked where the higher and intermediate velocity Perseus arm components appear blended together as one component and the low velocity Orion arm gas appears as the other component. An examination of Figure 2a reveals one trend in these “double-peaked” spectra. In the upper left quadrant of Figure 2a (northeast region of Per), the blended Perseus arm component has a local minimum to the blue of km s-1. In the lower right section of Figure 2a (southwest region of Per), the local minimum lies to the red of km s-1. This suggests that absorption due to the intermediate velocity gas in the Perseus arm becomes stronger with respect to the higher velocity Perseus arm gas in the southwest. The interstellar Na i D2 absorption profiles toward Per that show two distinct peaks in the Perseus arm gas in addition to the low velocity Orion arm gas (e.g., BD56°549 and BD56°610) are primarily located away from the cluster core.
3.2.2 h Per
Our moderate resolution interstellar Na i D2 absorption line spectra toward h Per (Figure 2b) also reveal complex structure in the Perseus arm gas. Similar to our analysis of the interstellar Na i D2 absorption line profiles toward Per, we have arranged the spectra shown in Figure 2b so that their location in the figure approximates the spatial distribution of our sightlines toward the cluster.
Although the interstellar Na i D2 absorption profiles toward h Per (Figure 2b) are similar to those seen toward Per (Figure 2a), they generally show stronger interstellar Na i D2 absorption in the Perseus arm gas. In the northern and eastern regions of h Per the line profiles reveal very strong interstellar Na i D2 absorption where the higher and intermediate velocity Perseus arm gas are blended into one component that has a line depth comparable to the Orion arm gas. Furthermore, there is little separation between the peak of the blended Perseus arm component and the Orion arm gas, indicating a substantial amount of intermediate velocity Perseus arm gas. Toward the core of h Per a noticeable separation appears between the Perseus arm gas and the Orion arm gas and the peak of the higher and intermediate velocity gas blend has shifted to the blue, suggesting that the intermediate velocity Perseus arm component is decreasing in strength with respect to the higher velocity Perseus arm gas. This apparent trend continues along the southwestern periphery of h Per. The gap between the Perseus arm gas and the Orion arm gas is even more pronounced than toward the core of h Per. It is also apparent in Figure 2b that the interstellar Na i D2 absorption in the higher velocity Perseus arm gas in the southwestern region is strong and is very likely saturated.
3.3 High Resolution Spectra
In order to better understand the variations in intensity and velocity of interstellar Na i D2 absorption, we have also obtained high-resolution ( km s-1) spectra toward 24 of the brightest stars projected along the line-of-sight to h and Per. In Figure 3, we present the high-resolution interstellar Na i D2 absorption spectra of stars toward h and Per. We have arranged the spectra in Figure 3 to show the relative positions of the background target stars, similar to our method of analysis for the moderate resolution data. The coordinate offsets provided in the lower left of each panel indicate the relative position of any particular sightline with respect to HD 14250, which lies approximately between the cluster cores. Thus, stars to the west of HD 14250 are projected toward h Per and stars to the east of it are projected toward Per. To aid in the comparison between the high-resolution and moderate resolution data, we have plotted the high-resolution spectra in Figure 3 on the same intensity and velocity scale as the spectra presented in Figure 2.
The interstellar Na i D2 absorption line spectra presented in Figure 3 show the vast complexity of interstellar gas toward h and Per that was first noted by Münch (1953; 1957). These high-resolution data reveal variations in interstellar Na i D2 absorption in an even more dramatic fashion than the moderate resolution data. The individual components change in number, velocity, and strength from sightline to sightline. For example, the moderate resolution interstellar Na i D2 spectra of BD56°578 and BD56°571, separated by 25, are quite similar (see Figure 2a); the most apparent difference is slightly more interstellar absorption at intermediate velocities toward BD56°571. It is difficult to discern from the moderate resolution data if this subtle variation is the result of a change in the relative intensity and/or velocity of the intermediate velocity gas in front of these stars or if the variation is indicative of an additional intermediate velocity component that is present toward BD56°571, but not toward BD56°578. The high-resolution Coudé Feed spectra (see Figure 3) clearly reveal the presence of an extra intermediate velocity absorption component toward BD56°571. Thus, the moderate resolution ( km s-1) spectra provide a gross description of interstellar Na i D2 absorption toward the double open cluster, but the higher resolution spectra are necessary to understand the details of the interstellar absorption.
The high-resolution spectra shown in Figure 3 do not reveal any apparent patterns in the interstellar Na i D2 absorption toward h and Per. In general, the high-resolution spectra reveal a multitude of interstellar absorption components along any given sightline and no two high-resolution spectra are identical. Toward Per, eight of the ten sightlines lie within a ( pc) radius of the cluster core. These sightlines have angular separations that range from ( pc) to ( pc), with an average angular separation of ( pc). Even these closely-spaced sightlines overwhelmingly show the chaotic interstellar absorption structure in the Perseus arm gas with individual components varying in velocity and strength on the smallest angular scales probed. For example, BD56°574 and BD56°575 have an angular separation of ( pc at the distance to Per), yet the interstellar absorption of intermediate velocity Perseus arm gas toward BD56°574 is much more pronounced. In contrast to Per, only four of the fourteen sightlines toward h Per are projected within a ( pc) radius of the cluster core with angular separations ranging from ( pc) to ( pc) and an average angular separation of ( pc). Of these four stars, HD 14134 and BD56°524 have the smallest angular separation of ( pc at the distance to h Per). The moderate resolution spectra toward these two stars are vaguely similar and show fairly strong interstellar Na i D2 absorption in the intermediate and higher velocity Perseus arm gas. The high-resolution spectra, however, show dramatic differences. The interstellar Na i D2 absorption spectrum toward HD 14134 shows two saturated components at and km s-1 as well as a fairly well-defined gap between the Perseus and Orion arm gas. The interstellar Na i D2 absorption spectrum toward BD56°524, on the other hand, shows relatively strong absorption at all velocities associated with Perseus arm gas such that no gap is apparent between it and the Orion arm gas.
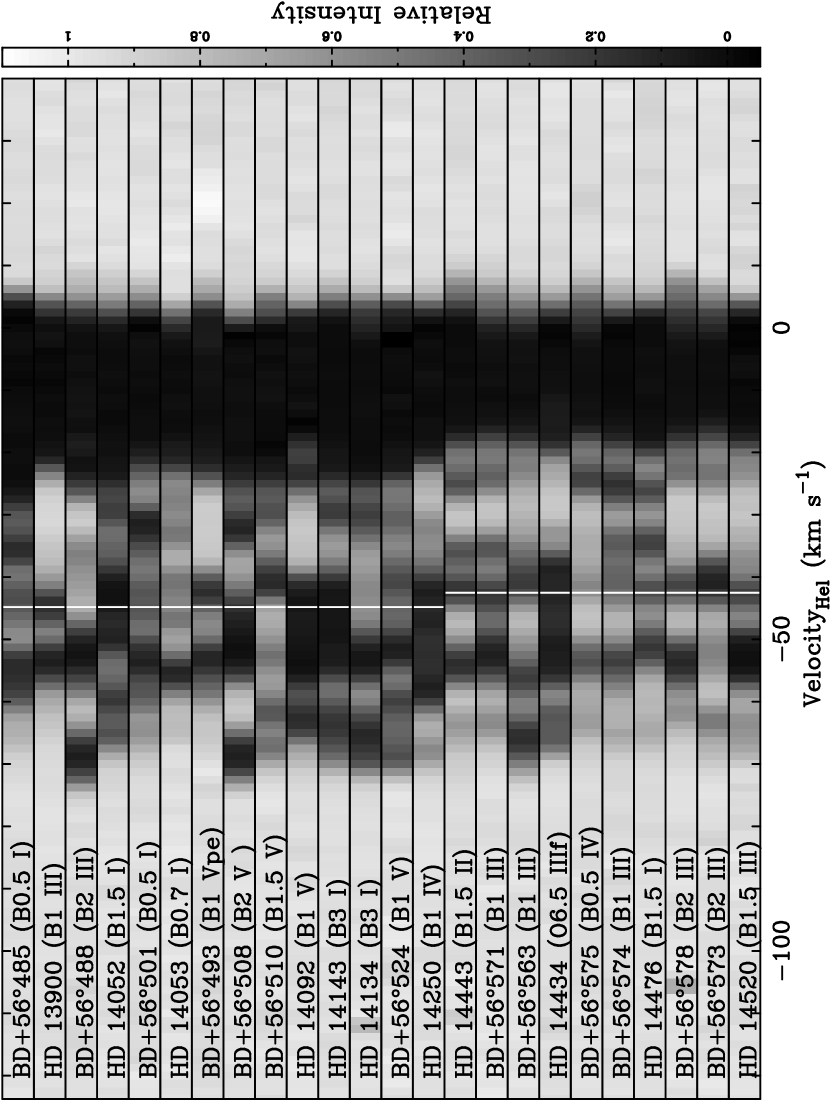
A comparison between the interstellar Na i D2 absorption spectra toward Per with respect to the spectra toward h Per does not reveal many obvious trends. It appears as if the interstellar Na i D2 absorption toward h Per is generally more saturated than toward Per. To further examine these spectra for any discernible patterns in the interstellar Na i D2 absorption, we created gray-scale images of the high-resolution spectra and arranged them spatially from west to east as shown in Figure 4. In this figure, we also indicate the average heliocentric velocities of h and Per at and km s-1 (Liu, Janes, & Bania 1989), respectively. In this image, strong Na i D2 absorption is black, more moderate absorption is gray, and low absorption is white. These absorption line images confirm the impression that there is more interstellar Na i D2 absorption toward h Per. The most noticeable feature in the spectral line images shown in Figure 4 is the presence of enhanced interstellar Na i D2 absorption toward h Per at km s-1 that is not seen toward Per. We discuss the nature of this km s-1 absorption in more detail in §4.3. In addition to the km s-1 component that is only detected toward h Per, we also notice a component that in present in most, if not all, of our high-resolution spectra between and km s-1. This velocity component may be indicative of a large-scale interstellar structure toward h and Per associated with the Perseus spiral arm.
4 Discussion
Many observations have been reported that detail the structure seen in interstellar Na i absorption toward high proper motion stars, binaries, open clusters, and globular clusters. In this section, we compare the interstellar Na i absorption toward h and Per with observations toward other open clusters and OB associations where it may be possible to use multi-object spectroscopy to investigate interstellar absorption toward a large number of sightlines. These comparisons may allow us to discern common properties of interstellar Na i absorption toward clusters of early-type stars. Then, we investigate the question of what characteristics define an interstellar cloud. Finally, we discuss the nature and origin of the km s-1 interstellar Na i D2 absorption component that is detected toward h Per, but not toward Per.
4.1 Interstellar Na i Absorption Toward Open Clusters and OB Associations
Among the first “stationary” or interstellar lines reported (Heger 1919), Na i D observations have a long history of being used to probe the structure of the ISM. Furthermore, the interstellar Na i D absorption lines are among the strongest optical interstellar absorption lines typically detected. Thus, we begin our discussion of the complex interstellar structure toward h and Per by examining past studies of interstellar Na i D absorption toward open clusters and OB associations. Through this, we can examine whether the velocity and intensity variations in interstellar Na i D absorption toward h and Per are commonly seen toward clusters of early-type stars and how this affects our understanding of the ISM in the Galaxy.
4.1.1 h and Per (NGC 869 and NGC 884)
As mentioned previously, moderate resolution ( km s-1) interstellar Ca ii and Na i absorption observations toward 112 stars in the northern Milky Way were obtained by Münch (1953; 1957) as part of a larger program to determine if the interstellar lines in distant stars might reveal the large-scale structure of interstellar gas in the Galaxy. Of these stars, 16 are members of the Perseus OB1 association and are projected toward h and Per. Münch (1953; 1957) determined that the interstellar Na i D absorption line spectra toward h and Per showed two distinct components: (1) a blue-shifted “V” component associated with interstellar gas in the Perseus spiral arm and (2) a highly saturated “R” component associated with the local Orion spiral arm gas. In particular, Münch (1953) noted that the shape of the line profiles of the Perseus arm gas suggested that this “V” component resulted from the superposition of a number of fainter narrow lines and that the the shape of the “V” component varied widely from star to star in both velocity and intensity. The detailed analysis of these data shows that some of the interstellar Na i absorption in the “V” component with radial velocities that are comparable to those of the background stars and a component in the Perseus arm gas that is systematically shifted to the violet with respect to stars by km s-1. As seen in Figure 4, this component is detected in our high-resolution KPNO Coudé Feed spectra toward h and Per as an interstellar Na i D absorption feature at heliocentric velocities between and km s-1. Münch (1957) has suggested that this blue-shifted velocity component could be indicative of a coherent expansion of interstellar gas around the OB associations and open clusters in the Perseus spiral arm.
In order to better understand the nature of the Na i absorption toward the Perseus arm, Münch (1957) compared the interstellar Na i D profiles with H i 21-cm emission line data. Münch (1957) determined that the peaks seen in 21-cm emission had similar velocities to the troughs seen in Na i absorption, leading him to conclude that the observed Na i lines must predominantly arise in H i regions. Furthermore, Münch (1957) noted that the optical absorption line profiles show more variations on smaller scales than the 21-cm emission line profiles because the beam size of the radio observations () samples many more interstellar clouds along the line-of-sight than an individual interstellar absorption sightline. Thus, the H i data may be able to provide information on the large-scale structure of the ISM and absorption line studies are better suited to examine small-scale variations.
4.1.2 Carina Nebula (NGC 3372)
As much as h and Per are among the most studied nearby Galactic clusters accessible to northern telescopes, the Carina Nebula (NGC 3372) and its associated open clusters Trumpler 16 and Collinder 228 (hereafter Tr 16 and Cr 228, respectively) are among the most studied southern objects. The discovery of complex interstellar absorption line structure toward the Carina Nebula was first reported by Walborn & Hesser (1975) on the basis of Ca ii observations. Subsequent Na i observations toward stars in Tr 16 and Cr 228 (Whiteoak & Gardner 1980; Walborn 1982; García & Walborn 2000) have revealed complex interstellar Na i D absorption toward the Carina Nebula in which none of the line profiles are identical.
Whiteoak & Gardner (1980) investigated the interstellar Na i D absorption toward nine early-type stars that are associated with or behind the Carina Nebula using the Coudé spectrograph on the Mt. Stromlo 74-in telescope with a velocity resolution of km s-1. The nine stars in their survey have angular separations ranging from 1′ to , which corresponds to projected physical separations of 0.6 to 21.5 pc at a distance to Carina of 2.2 kpc (Walborn 1995). These interstellar Na i absorption spectra reveal a wide saturated feature centered on km s-1 which analogous to the Orion arm gas component that is seen toward h and Per. Another noticeable feature in these spectra is a prominent absorption component near km s-1 that may be associated with H2CO (Gardner, Dickel, & Whiteoak 1973) and OH (Dickel & Wall 1974) absorption detected at km s-1.
Walborn (1982) examined interstellar Na i absorption toward 22 stars within the Carina nebula using the CTIO 4-m telescope and echelle spectrograph with a velocity resolution km s-1. The stars in Walborn’s (1982) investigation, which included 8 of the 9 stars surveyed by Whiteoak & Gardner (1980), have angular separations ranging from to which corresponds to projected physical separations of to 26.6 pc at the distance to Carina. Using this somewhat larger number of sightlines, Walborn (1982) concluded that the interstellar Na i D absorption at intermediate velocities ( km s-1) could be interpreted as arising in the front side of an expanding shell because these velocity components are similar to those seen in nebular emission lines. The higher velocity ( km s-1) interstellar Na i D absorption line components, however, show relatively little systematic structure and most are different from sightline to sightline. Based on the rapid spatial variations in interstellar absorption between closely separated stars, Walborn (1982) concluded that the variations must be formed relatively near the stars.
García & Walborn (2000) continued the investigation of interstellar structure in the Carina nebula with Ca ii and Na i observations of an additional 24 stars in Tr 16 and Cr 228 with a velocity resolution of km s-1. They also report that the structure of the interstellar absorption line profiles change on very small angular scales that may be attributed to small differences in distance to the stars. Furthermore, García & Walborn (2000) find that there are fewer higher velocity components toward fainter, less massive cluster members and suggest that the higher velocity components are produced in interactions between the stellar winds and the ambient medium.
4.1.3 Ara OB1
Whiteoak & Gardner (1985) investigated the kinematics of interstellar gas toward a molecular cloud/H ii region at , . In addition to obtaining 4.8 GHz H2CO absorption observed against 5 GHz continuum emission, they obtained high-resolution ( km s-1) interstellar stellar Na i observations toward 28 stars in the stellar association Ara OB1 (, ). The stars in this study have angular separations ranging from to which corresponds to projected physical separations of 0.65 to pc at a distance of 1.4 kpc to Ara OB1.
The interstellar Na i D absorption line profiles toward these stars reveal a complex interstellar structure; all of the line profiles are different. Most of the Na i D absorption profiles show several features that are highly saturated and blended together. The optical depths in the individual components are high () with column densities, (Na i) cm-2, that are typical of dense clouds (Whiteoak & Gardner 1985). The interstellar Na i absorption line spectra show three predominant groupings of components at heliocentric velocities of , , and km s-1 that appear to be related to large-scale galactic features, such as the local Orion arm at km s-1 and the Carina-Sagittarius spiral arm at km s-1 (Georgelin & Georgelin 1976).
4.1.4 Sco OB1
In addition to noting that the interstellar absorption profiles toward open clusters and OB associations were complex, Münch (1957) also reported the detection of gas with unusually high negative velocities that could be indicative of large scale expansion. This work has inspired numerous higher resolution investigations of interstellar absorption toward clusters and OB associations in the Galaxy. The Sco OB1 association, at a distance of 1900 pc (Humphreys 1978) and containing many luminous massive stars, provides an excellent opportunity to probe interstellar absorption line structure over a range of physical scales.
Crawford, Barlow, & Blades (1989) investigated the interstellar Na i and Ca ii absorption lines toward 22 stars in and around Sco OB1 at high spectral resolution ( – 3.0 km s-1). The stars in their sample included 13 association members, eight nearby stars, and one foreground star that range in angular separation from to 165, corresponding to physical distances of to 500 pc assuming a 1900 pc distance to the association. The interstellar Na i D absorption profiles toward the distant stars in this sample are complex and resemble the high-resolution interstellar Na i D absorption profiles toward h and Per. In fact, the interstellar Na i D absorption spectra toward the two most closely-spaced stars, HD 152233 and HD 152234, show dramatically different velocity profiles (see Figures 2d and 3c of Crawford et al. 1989). The Na i D spectra show complex interstellar Na i D absorption profiles at at velocities less than km s-1, saturated interstellar Na i D absorption heliocentric velocities km s-1, and absorption components at positive velocities ( km s-1) in four of the interstellar Na i D absorption spectra. The interstellar gas with velocities km s-1 is interpreted as arising from absorption in the Sagittarius spiral arm with the most negative velocity components representing the front side of an expanding shell around Sco OB1. The saturated interstellar absorption detected at velocities km s-1 is most likely caused by absorption from local, foreground clouds. The positive velocity components that were only detected in four of the Na i D spectra may represent either the receding parts of an expanding shell or low-density intercloud material.
Crawford (2001) obtained ultra-high resolution ( km s-1) interstellar Na i and K i absorption profiles toward 3 of the sightlines investigated by Crawford et al. (1989). These ultra-high resolution spectra show even more remarkable structure in the interstellar Na i D absorption line profiles than were revealed in the high resolution data of Crawford et al. (1989). In general, the ultra-high resolution spectra show approximately twice the number of interstellar absorption line components than seen the high-resolution data.
4.1.5 The Pleiades (M 45)
White at al. (2001) investigate the interstellar Na i D absorption toward 36 stars in and around the Pleiades to better understand the kinematics of interstellar gas as it interacts with the Pleiades at high spectral resolution ( km s-1) and at high signal-to-noise. The sightlines in this sample had angular separations ranging from to 8° which corresponds to physical scales from to 16 pc, respectively, at a distance to the Pleiades of 118 pc (van Leeuwen 1999). In general, these interstellar Na i D absorption spectra have simpler line profiles than those seen toward more distant clusters and OB associations with the vast majority of spectra (75%) only showing one or two velocity components, typically at km s-1.
Although most of the spectra in this investigation have relatively simple absorption profiles, the spectra do show some complexity. The two sightlines with the smallest angular separation (; 0.07 pc), toward the Pleiades members HD 23629 and HD 23630, show two and three absorption components, respectively. This additional velocity component detected toward HD 23630 at km s-1 may be indicative of a small scale physical structure in the ISM. The next closest sightline to HD 23630 is toward cluster member HD 23642 which lies N ( pc) and shows only one absorption component at km s-1, further indicating that the component at km s-1 covers only a small region on the sky. Those sightlines which show more than two velocity components (25% of the sample) are randomly distributed across the region surveyed and include sightlines to both member and non-member cluster stars. Furthermore, the number of interstellar absorption components detected does not depend on the distance to the background star. The spectra toward the two most distant stars in the White et al. (2001) sample, HD 25201 ( pc) and HD 26128 ( pc), show three and one absorption component, respectively.
4.1.6 Orion
Price et al. (2001b) obtained ultra-high resolution ( km s-1) interstellar Na i, Ca ii, K i, CH, and CH+ absorption spectra toward 12 stars in Orion, including four stars in M 42. The individual absorption components detected toward each sightline were then used to examine the kinematics of the Orion region as well as that of the ISM. Because the stars in this sample lie at distances ranging from to pc and have angular separations ranging from 02 – 2025 ( – pc, assuming a common distance of 450 pc), it is possible to examine both the small and medium scale structure of the intervening material.
These ultra-high resolution data have revealed the presence of up to 16 absorption components per sightline which more than doubles the number of interstellar components previously reported along these sightlines (e.g., Hobbs 1978; O’Dell et al. 1993; Welty, Morton, & Hobbs 1996). The detailed comparison of absorption components detected in Na i, Ca ii, and K i were used to identify individual interstellar clouds; clouds with similar physical parameters were then grouped into absorption systems. The observations along sightlines with small angular separations (e.g., toward M 42 and Ori) have revealed variations in the absorption line profiles that imply the presence of structure down to 0.03 pc. Furthermore, comparison of the interstellar Na i absorption spectrum toward Ori obtained by Price et al. (2001b) with one obtained by Welty, Hobbs, & Kulkarni (1994) shows evidence for temporal variations in the line profile over a 6 yr time period, indicating structure in the ISM down to scales of au, given a proper motion of Ori of 4.73 mas yr-1 (ESA 1997). This temporal variation in the line profile is similar to that which has been detected toward Ori (Price, Crawford, & Barlow 2000; Price et al. 2001a) and toward HD 32039/40 (Lauroesch, Meyer, & Blades 2000). Even though temporal variations are detected in the interstellar Na i absorption profiles, they are not seen in the interstellar Ca ii absorption along this sightline.
4.1.7 Comparison With Our Results
The previous studies, as well as our current investigation of interstellar Na i D absorption toward early-type stars reveal complex, multiple-component line profiles. All of the sightlines toward any particular open cluster or OB association show different interstellar Na i D absorption line profiles. The differences in the absorption line profiles are most apparent for gas that is located in other spiral arms of the Galaxy, however, nearby sightlines toward the Pleiades and stars in Orion also show considerable variations in the interstellar Na i D profiles. Furthermore, significant differences among the line profiles toward stars in each cluster can be seen down to the minimum projected stellar separations of pc (e.g., see Figures 2 & 3). Thus, it would seem that the variations observed in interstellar Na i D absorption toward stars in open clusters and OB associations are a relatively common phenomenon. As previously discussed, it remains uncertain if the differences in the interstellar Na i D absorption line profiles are tracing density variations in interstellar gas, fluctuations in the ionization balance, the geometry of interstellar material, or a combination of these and other effects.
4.2 What Is A Cloud?
The first interstellar absorption line reported was detected toward the spectroscopic binary Ori by Hartmann (1904), who noted that the Ca ii K line did not share in the periodic variations of the stellar lines but remained “stationary” throughout the observations. Subsequently, stationary lines of Ca ii K were detected in the spectra of other stars such as Leo (Harper 1914). This phenomenon was extended by Heger (1919) when stationary lines of Na i D1 and D2 were discovered in the spectra of Ori and Sco. Heger (1919) also noted that the velocities of the stationary Na i D lines in these spectra matched the previously measured velocities of stationary Ca ii H and K lines toward these stars within the observational errors.
The origin of the stationary lines remained in dispute for approximately 25 years after their discovery. The two predominant theories to explain the nature of the stationary lines were that (1) the lines were due to absorption of the background stellar continuum by an intervening cloud of calcium and/or sodium in space or (2) that the lines were due to a calcium and/or sodium envelope that surrounded the stellar source. Until 1923, the stationary lines had only been detected toward high temperature spectroscopic binaries333It should be noted that Leo is not a spectroscopic binary. Harper (1914) considered Leo to be a spectroscopic binary based on a report by Campbell & Albrecht (1909) even though he was unable to determine a period for the star from his own data. with spectral types between B0 and B3. Based on this evidence, Young (1920) concluded that the stationary lines are most likely produced in a low density gas that was associated with the binary systems. Plaskett (1923) challenged this conclusion, however, when his investigation of the spectra of O-type and Wolf-Rayet stars revealed that stationary lines of Ca ii H and K were present toward all of the stars in his sample regardless if the star were a binary or singular. Furthermore, Plaskett (1923) found that the velocities of the stationary H and K lines differed considerably from the velocities of stellar lines in the spectra by as much as km s-1. Therefore, Plaskett (1923) concluded that diffuse gaseous matter containing ionized calcium (and neutral sodium) arise in a fairly widespread cloud of tenuous material that is not local to the background star, but was interstellar gas.
The physical conditions of diffuse interstellar gas was first investigated by Eddington (1926). Using general physical considerations, Eddington (1926) estimated that the diffuse interstellar gas had a density of g cm-3, a temperature of K, and was uniformly distributed throughout the Galaxy. Thus, interstellar absorption lines should be present in the spectra of stars of all classes and the strength of the absorption should increase with distance to the background star. Because the detection of interstellar absorption in the spectra of late-type stars is problematic due to the increasing strength and narrow width of stellar absorption lines, most investigations of interstellar absorption focused on the spatial distribution of the gas toward early-type stars. Struve (1928) systematically measured the intensity of interstellar Ca ii K toward 1718 early-type stars that ranged in apparent magnitude by 10.5 mag and found that the line strength linearly increased with apparent magnitude and presumably with distance. In order to determine the relative distances between the star and the center of absorption in a cloud by using the theory of differential Galactic rotation (Lindblad 1927), Plaskett & Pearce (1930) measured the stellar and interstellar Ca ii K line velocities toward OB stars. Plaskett & Pearce (1930) found that the galactic rotational term of stars was approximately twice the galactic rotational term of the gas and concluded that the absorbing gas was uniformly distributed. Photometric measurements of interstellar line intensities led to the conclusion that the interstellar gas was not homogeneous, but that the observed line profiles could be accounted for by making the hypothesis that interstellar gas occurs in discrete clouds which participate in the general galactic rotation in addition to having significant random motions (Wilson & Merrill 1937).
The discovery of the ISM through absorption line spectroscopy led to what can be described as a “standard cloud” model in which each velocity component comprising an interstellar absorption line profile in stellar spectra corresponds to an individual cloud with a radius of a few parsecs (Spitzer 1978). Statistically, about five of these standard clouds are detected per kiloparsec along any particular sightline (Hobbs 1974). It is important to note, however, that advances in spectral resolution have radically altered this simple picture. As higher spectral resolutions are achieved, the number of discrete absorption components along any particular line-of-sight tends to increase. Beals (1936) first reported the “irregularity of structure” in the interstellar absorption profiles toward stars in Orion (e.g., Ori and Ori ) that indicated the presence of two interstellar clouds. As discussed in §4.1.6, the ultra-high resolution observations of interstellar absorption toward stars in Orion (Price et al. 2001b) reveal up to 10 and 12 interstellar clouds toward Ori and Ori, respectively. Thus, the “standard cloud” model of the ISM which was constructed on the interpretation of moderate resolution interstellar absorption spectra cannot adequately describe the ISM as viewed at ultra-high resolution. Consequently, the definition of an interstellar cloud strongly depends upon the resolution with which it is observed.
The view of the ISM as determined from interstellar absorption is sharply contrasted with the appearance of the ISM as determined from emission line imaging studies which reveals the ISM to be comprised of loops, filaments, shells, and sheets of gas. Thus, the relationship between interstellar structures seen in emission and interstellar clouds inferred from absorption is not clear. A fundamental problem in reconciling the differences between these views of the ISM is pencil-beam nature of interstellar absorption line investigations and the larger beam sizes of H i 21-cm emission line surveys. One approach in attacking this problem is to map interstellar absorption lines of intervening gas toward open clusters and OB associations by obtaining many spectra along sightlines which probe a range of angular separations through the use of multi-object spectroscopy.
We have seen in §4.1 that observations of interstellar Na i toward stars in open clusters (e.g., h & Per, Tr 16 & Cr 228, & the Pleiades) and OB associations (e.g., Ara OB1 & Sco OB1) reveal complex absorption line profiles. As shown in Figure 2, all of the sightlines toward the 150 stars in the vicinity of h and Per for which we have obtained WIYN Hydra moderate resolution spectra exhibit different Na i D line profiles for every sightline. The variations in the absorption line profiles are most easily seen in optically-thin Perseus spiral arm gas with velocities between and km s-1. Furthermore, these variations can be seen down to the minimum angular separation of which corresponds to a projected physical separation of pc at the distance to the Perseus gas. As shown in Figure 3, the Na i D profile variations are even more dramatic in our high-resolution KPNO Coudé Feed spectra toward 24 of the h and Per stars which have angular separations as small as ( pc).
In the “standard” cloud model, each of the interstellar Na i absorption components seen toward h and Per represents an individual, spherical, isothermal cloud with a diameter of pc (Spitzer 1978). Thus, at the 2 kpc distance to the Perseus spiral arm, the minimum angular size of a “standard” interstellar cloud along the line-of-sight would be . As seen in Figure 3, along any given sightline toward h and Per for which we have obtained high-resolution interstellar Na i absorption spectra, the approximate number of components it would take to adequately fit the line profile is for the gas in the Perseus arm ( km s-1). Therefore, the assumption that each detected interstellar Na i absorption component arises from within an individual cloud gives rise to a complicated situation where the ISM of of the Perseus spiral arm would appear to consist of hundreds of individual clouds.
Given the size of a “standard” cloud and its projected angular diameter at the distance of h and Per, it is not unreasonable to assume that some fraction of the absorption lines that are detected along different sightlines arise in the same “cloud”. Some of the sightlines with the smallest angular separations between them have fairly distinct interstellar Na i absorption spectra. For example, HD 14443 and BD56°571 toward Per have an angular separation of . Of the five easily discernible spectral components in the Perseus arm gas toward HD 14443 (see Figure 5a), only those components with intensity minima at , , and km s-1 appear to directly correspond to absorption features seen toward BD56°571, i.e., the shift in the absorption troughs at these velocities is less than 3.5 km s-1. HD 14134 and BD56°524 in h Per have an angular separation of . Likewise, as seen above, only three of the five obvious absorption components toward HD 14134 at , , and km s-1 appear to directly correspond to features toward BD56°524 (see Figure 5b). Thus, these data show that although some of the detected gas is seen toward adjacent stars, some is not.
It remains uncertain, however, over what velocity interval we can legitimately call interstellar Na i absorption components toward different sightlines one cloud. For example, if we were to analyze each sightline toward h and Per in isolation, we would need at least 5 absorption components to adequately fit the interstellar absorption detected in the Perseus arm gas, implying the presence of at least that many clouds along the line-of-sight. If we were to examine interstellar absorption spectra along two nearby sightlines, we would observe absorption components toward each star, but 2–3 of the components would be seen toward both stars. This effectively reduces the number of clouds along the line-of-sight in the Perseus arm gas from 10 to 7 or 8 toward those two stars. It is only when a relatively large number of stars are included in the analysis that one can begin to discern the larger scale structures in the ISM toward h and Per. For example, we detect interstellar Na i D absorption at a heliocentric velocity of km s-1 toward most of the stars for which we have obtained high-resolution spectra that is suggestive of a large-scale interstellar feature toward the double cluster that appears to contain medium and small scale variations within it. Furthermore, it is possible that the velocity dispersion of this cloud as a whole is larger than the velocity dispersion measured for the density peaks within this cloud that are determined from the individual spectra. Thus, these individual density peaks could have heliocentric velocities that differ by several km s-1, but nevertheless are part of a larger cloud. The view that some of the differences in interstellar Na i D2 absorption detected among sightlines represents variations within larger scale absorption systems is not without precedent. The ultra-high resolution survey of interstellar absorption toward stars in Orion (Price et al. 2001b) revealed varying velocity components toward stars in the Trapezium. Although these ultra-high resolution spectra reveal some similarities in the interstellar absorption profiles, they also reveal clear differences. Despite the differences detected in the interstellar absorption features, Price et al. (2001b) argue that the data are best explained if the individual velocity components comprise part of a larger interstellar absorption system. Therefore, based on our moderate and high resolution spectra, as well as the qualitative comparison to the ultra-high resolution survey of interstellar absorption toward Orion, the individual interstellar absorption components detected toward h and Per probably do not indicate the presence of many small spherical clouds, but rather larger sheets or systems of gas within which we observe variations in the strength, number, and velocity of components due to differences in the physical conditions on smaller scales and within which we detect differences in the gas density.
Because Na i is not a dominant species in the ISM, it is usually necessary to observe other interstellar lines in order to determine if the interstellar Na i absorption line components are tracing the physical structure or the physical conditions of the gas. We have obtained H i 21-cm emission line data toward h and Per from the Low Resolution DRAO Survey (LRDS) of the Galactic Plane444The LRDS of the Galactic Plane was carried out as a part of the Canadian Galactic Plane Survey project and are publicly available at http://www.drao-ofr.hia-iha.nrc-cnrc.gc.ca/science/LRDS/survey.html. (Higgs & Tapping 2000) to directly compare the Na i D line profiles with the H i line profiles. In Figure 6, we show three H i 21-cm line profiles from the LRDS that are roughly centered on h Per, Per, and an area located between these two clusters. In general, the H i 21-cm emission line profiles show smoother, more continuous variations in the Perseus arm gas when compared to our Coudé Feed interstellar Na i D2 absorption line spectra. These differences may be due to the beam of the LRDS sampling many individual smaller clouds with different velocities along the line-of-sight. The H i 21-cm emission line profiles show three peaks in the Perseus arm gas at velocities of , , and km s-1 which are similar to some velocity components detected in interstellar Na i absorption. The 21-cm emission at km s-1 is emission from gas that lies beyond the Perseus arm. Of particular interest is the km s-1 21-cm emission peak because interstellar Na i absorption is detected at velocities between km s-1 (see §3.3). We have examined the LRDS H i datacube of the h and Per region and find that an H i feature having an angular diameter of ( pc) and a velocity of km s-1 is roughly centered on h and Per. Therefore, we conclude that the km s-1 component represents an intervening interstellar cloud.
In addition to comparing the interstellar Na i absorption line profiles with H i 21-cm emission toward h and Per, we have also examined interstellar absorption from the and diffuse interstellar bands (DIBs). Even though not one DIB carrier has been positively identified since their discovery by Heger (1922), recent developments indicate that most DIB carriers are probably large carbon-bearing gas phase molecules such as polycyclic aromatic hydrocarbons, fullerenes, and/or carbon chains (Salama et al. 1996; Foing & Ehrenfruend 1997; McCarthy et al. 2000). Thus, it is not unreasonable to assume that the DIBs trace dense gas that could be indicative of individual clouds toward h and Per. Unlike the interstellar Na i profiles, the DIB profiles show little sightline-to-sightline variations and have velocities typically associated with local Orion arm and low-velocity Perseus arm gas. Toward three closely-spaced stars (angular separations ; projected linear separations pc), however, we have spectroscopically resolved a DIB component associated with higher velocity gas in the Perseus arm. Our Coudé Feed interstellar absorption spectra toward the two brightest of these stars, BD56°488 and BD56°508 (see Figure 7), show an intense, narrow Na i absorption component at km s-1 that is not detected toward any other of the sightlines toward h and Per for which we have obtained high-resolution spectra. Because this strong km s-1 Na i absorption component and the Perseus arm DIB absorption are only detected toward a small ( pc) region to the northwest of the core of h Per, it it likely that they trace an isolated interstellar cloud.
Although the above two examples show that some interstellar Na i D2 absorption components seen in Figure 7 appear to trace discrete clouds in the Perseus arm gas, it is uncertain whether the interstellar Na i absorption components at other velocities do. The variations in the interstellar Na i line profiles at these other velocities may reflect environmental variations in parameters such as temperature, pressure, electron density, and/or radiation field. The physical conditions of the Perseus arm gas, however, cannot be determined solely from the interstellar Na i absorption lines. Therefore, we have performed a cursory examination of the spectral types of stars toward h and Per as cataloged by Slesnick et al. (2002) in order to determine a rough estimate of the local background radiation field. As seen in Figures 3 & 4, even stars with small angular separations in the core of h (e.g., HD 14143 and HD 14134) and Per (e.g., BD56°571 and BD56°563) with identical spectral classifications show different interstellar Na i absorption line profiles, indicating that the local background radiation field is not the primary cause of the observed line profile variations. Because these stars are not likely at the same distance in the Perseus arm, it is also a possibility that the differences in the interstellar Na i line profiles are caused by distance effects.
Based upon the data we have examined, the most likely distribution of interstellar material toward h and Per is in the form of several large-scale structures at velocities of , , , , and km s-1. The lower velocity gas ( km s-1) is primarily associated with more local, Orion spiral arm gas. The intermediate velocity gas ( km s-1) detected in these spectra is roughly centered on the mean heliocentric radial velocities of both h and Per (Liu, Janes, & Bania 1989). As such, these absorption components most likely represent gas in the Perseus spiral arm that is local to the clusters. Furthermore, the intermediate velocity interstellar Na i D2 absorption at km s-1 is blue-shifted with respect to the mean heliocentric cluster velocities by km s-1. As noted by Münch (1953; 1957), this blue-shifted component could represent the front side of an expanding shell of gas around the double cluster. Velocity variations among sightlines in this intermediate velocity gas could be due to the non-spherical geometry of an interstellar shell around h and Per, such as the Orion-Eridanus superbubble that is suspected to produce the variable interstellar absorption detected toward Ori (Price et al. 2001a). These largeer scale interstellar structures have internal velocity dispersions due to turbulence on small scales (Elmegreen 1999; Cho, Lazarian, & Vishniac 2002) and velocities due to bulk motions on larger scales. Within these structures, small and medium scale variations in the physical conditions of the gas could lead to observed differences in the Na i column. Because recombination rates are strongly dependent upon density (Péquignot & Aldrovandi 1986), neutral species such as Na i would preferentially form in these regions of higher density (Lauroesch & Meyer 2003 and references therein). This, coupled with the velocity differences among these structures, leads to the very large number of individual Na i components detected toward any particular sightline as well as the differences between sightlines in terms of both the strength and velocity of interstellar Na i absorption. The higher velocity ( km s-1) interstellar Na i D2 absorption, especially that which is only detected at km s-1 toward BD56°488 and BD56°508 and also corresponds to enhanced DIB absorption, seems to arise in a canonical interstellar cloud ( pc).
4.3 The km s-1 Component
As discussed in §3.3, we have detected an enigmatic interstellar Na i absorption component at km s-1 in the spectra of stars that are projected toward h Per using our Coudé Feed data (see Figure 4). This absorption feature is not detected in the Coudé Feed spectra of stars projected toward Per. In order to determine the spatial distribution of the km s-1 absorption component, we have re-examined the 150 Hydra interstellar Na i absorption spectra toward h and Per. This km s-1 component is not resolved from the broad (saturated) absorption centered near km s-1. Therefore, we use the stars in our Coudé Feed sample to estimate the size of the km s-1 absorber even though they have a more limited spatial distribution than the Hydra sample. From the angular separations between HD 14092 and BD56°488 and between HD 14250 and BD56°485, we find that the minimum angular extent of the km s-1 velocity component is at least .
The large angular size of the km s-1 interstellar Na i absorption component implies that the gas in which this feature appears lies at some distance in front of h Per. If the gas were relatively close to the cluster, we would expect to see some differences in the line profiles due to the ionizing radiation field from the massive stars in h Per. Thus, the most simple explanation is that the km s-1 component arises in a discrete neutral cloud at an unknown distance in front of h Per. To confirm this hypothesis, we have examined the 21-cm LRDS datacube at heliocentric velocities between and km s-1. This is an ideal method to search for an isolated cloud on large angular scales because these data simultaneously provide kinematic and spatial information on the H i distribution. We find a 21-cm H i emission component at km s-1 that is projected toward h Per, but that is absent toward Per, strengthening our conclusion that the km s-1 interstellar Na i absorption feature arises in a gas cloud that lies in front of h Per. It is interesting to note, however, that an investigation of the LRDS H i 21-cm emission line profiles toward the cores of h and Per, where the majority of stars observed with the Coudé Feed are located, does not show any remarkable enhancements in the neutral gas at this velocity (see Figure 6). This difference, or lack there-of, in the individual H i 21-cm emission line profiles may be the result of self-absorption of neutral hydrogen in the local gas that affects the shape of the 21-cm line profiles in this velocity range.
5 Summary
We present moderate resolution (12 km s-1) interstellar Na i absorption line spectra along 150 sightlines toward the double open cluster h and Per that were obtained with the WIYN Hydra multi-object spectrograph. Additionally, we have used the KPNO Coudé Feed spectrograph to obtain high-resolution (3 km s-1) interstellar Na i absorption line spectra toward 24 of the brightest stars along the line-of-sight to h and Per. These data have been used to examine the interstellar Na i absorption toward h and Per on angular scales from to which correspond to linear scales of 0.1 pc to 50 pc at the double cluster distance of pc. Both the moderate and high-resolution spectra reveal complex interstellar Na i absorption toward h and Per. A study of these spectra leads us to the following conclusions:
(1) Multi-object spectroscopy of interstellar absorption toward open clusters is a powerful, but under-utilized tool to examine the structure of the ISM. Studies of interstellar absorption and its variations from sightline to sightline have historically been limited to obtaining one spectrum at a time, making it difficult and time consuming to investigate the structure of the ISM over a range of scale lengths.
(2) The moderate resolution WIYN Hydra data are remarkable because they show that no two interstellar Na i absorption line profiles are alike over the range of scale lengths probed. The high-resolution KPNO Coudé Feed spectra reveal even more complexity in the Perseus arm gas than the moderate resolution Hydra spectra with the number, velocity, and strength of individual components changing from sightline to sightline. These results are similar to those obtained by previous investigations of interstellar Na i absorption toward open clusters and OB associations in the Galaxy. Therefore, it seems that the variations which are detected in interstellar Na i absorption line profiles are relatively common.
(3) The “standard” cloud model of the ISM in which every individual absorption line component toward each sightline represents an individual interstellar cloud is not applicable to these data. If each interstellar Na i absorption component detected in our Coudé Feed dataset represents an individual interstellar cloud, the Perseus arm gas toward h and Per would appear to consist of many small clouds. Given the finite size of an individual interstellar cloud, the number distribution of clouds along the line-of-sight to h and Per, and the range of angular separations of our sightlines, it seems probable that some sightlines should intersect the same parcel of gas. The difficultly lies in determining over what velocity interval and change in intensity it is appropriate to call interstellar Na i absorption components toward different sightlines one cloud. It is distinctly possible that the ISM in the Perseus arm gas is comprised of sheets of gas that have large internal velocity dispersions. Fluctuations in the density within these sheets of gas could give rise to the variations observed in our interstellar absorption line data. Ultra-high resolution interstellar absorption surveys toward Orion reveal extremely complex line profiles toward any individual star (Price et al 2001b). Although numerous velocity components are detected toward stars in the Orion sample, Price et al. (2001b) are able to group absorption components into larger absorption systems based upon similarities in velocity and in Na0/Ca+ ratios.
(4) Because Na i is not a dominant species in the ISM, it is uncertain if the observed variations in the interstellar absorption line profiles trace changes in the physical structure or the physical conditions of the gas. Therefore, other interstellar lines need to be observed, such as Ca ii, K i, or diagnostic UV lines. Although our moderate and high resolution data do not cover these more traditional diagnostic lines, we have also examined the interstellar absorption from the and DIBs. These DIBs most likely trace dense gas that could be indicative of individual clouds. Toward three closely spaced stars, we have spectroscopically resolved a DIB component in the Perseus spiral arm. Our high-resolution interstellar Na i absorption spectra toward the two brightest of these stars reveal a nearly saturated, narrow absorption component at km s-1. It is likely that this strong Na i component traces an individual interstellar cloud.
(5) The comparison between the high-resolution spectra toward Per and h Per does not reveal many obvious differences between the two clusters. In general, the interstellar Na i absorption toward h Per seems more pronounced. Furthermore, inspection of spectral images of the high-resolution data reveals a noticeable interstellar Na i absorption component at km s-1 toward h Per that is not detected toward Per. This km s-1 interstellar Na i absorption component probably arises in discrete cloud at an unknown distance. To verify the physical nature of this feature, we have examined the LRDS H i 21-cm emission line datacube toward h and Per. We find an H i emission component that correlates in position and velocity with the km s-1 detected in absorption, confirming our hypothesis that the km s-1 absorption component is associated with an individual cloud.
References
- Andrews et al. (2001) Andrews, S. M., Meyer, D. M., & Lauroesch, J. T. 2001, ApJ, 552, L73
- Argelander (1903) Argelander, F. W. A. 1903, Bonner Durchmusterung, Vol. 2, ed. A. Marcus and E. Weber (Bonn: Verlag)
- Bates et al. (1995) Bates, B., Kemp, S. N., Keenan, F. P., & Davies, R. D. 1995, ApJ, 444, 672
- Bates et al. (1993) Bates, B., Kemp, S. N., & Montgomery, A. S. 1993, A&AS, 97, 937
- Beals (1936) Beals, C. S. 1936, MNRAS, 96, 661
- Campbell & Albrecht (1909) Campbell, W. W., & Albrecht, S. 1909, Lick Obs. Bull., 5, 174
- Cannon & Pickering (1918) Cannon, A. J., & Pickering, E. C. 1918–1924, Ann. Astron. Obs. Harvard College, 91-99
- Cho et al. (2002) Cho, J., Lazarian, A., & Vishniac, E. T. 2002, ApJ, 566, L49
- Crawford (2001) Crawford, I. A. 2001, MNRAS, 328, 1115
- Crawford (2002) Crawford, I. A. 2002, MNRAS, 334, L33
- Crawford et al. (1989) Crawford, I. A., Barlow, M. J., & Blades, J. C. 1989, 336, 212
- Crawford et al. (2000) Crawford, I. A., Howarth, I. D., Ryder, S. D., & Stathakis, R. A. 2000, MNRAS, 319, L1
- Deshpande (2000) Deshpande, A. A. 2000, MNRAS, 317, 199
- Diamond et al. (1989) Diamond, P. J., Goss, W. M., Romney, J. D., Booth, R. S., Kalberla, P. M. W., & Meabold, U. 1989, ApJ, 347, 302
- Dickel & Wall (1974) Dickel, H. R., & Wall, J. V. 1974, A&A, 31, 5
- Dieter, Welch, & Romney (1976) Dieter, N. H., Welch, W. J., & Romney, J. D. 1976, ApJ, 206, L113
- Eddington (1926) Eddington, A. S. 1926, Observatory, 49, 193
- Elmegreen (1999) Elmegreen, B. G. 1999, ApJ, 527, 266
- ESA (1997) ESA 1997, The Hipparcos and Tycho Catalogues, ESA SP-1200, ESA Publications Division, Noordwijk
- Faison & Goss (2001) Faison, M. D., & Goss, W. M. 2001, AJ, 121, 2706
- Faison et al. (1998) Faison, M. D., Goss, W. M., Diamond, P. J., & Taylor, G. B. 1998, AJ, 116, 2916
- Foing & Ehrenfreund (1997) Foing, B. H., & Ehrenfreund, P. 1997, A&A, 317, L59
- Frail et al. (1994) Frail, D. A., Weisberg, J. M., Cordes, J. M. & Mathers, C. 1994, ApJ, 436, 144
- García & Walborn (2000) García, B., & Walborn, N. R. 2000, PASP, 112, 1549
- Gardner, Dickel, & Whiteoak (1973) Gardner, F. F., Dickel, H. R., & Whiteoak, J. B. 1973, A&A, 7, 349
- Georgelin & Georgelin (1976) Georgelin, Y. P., & Georgelin, Y. M. 1976, A&A, 49, 57
- Gibson et al. (2000) Gibson, S. J., Taylor, R., Higgs, L. A., & Dewdney, P. E. 2000, ApJ, 540, 851
- Harper (1914) Harper, W. E. 1914, Publ. Dom. Obs. Ottowa, 1, 335
- Hartmann (1904) Hartmann, J. 1904, ApJ, 19, 268
- Heger (1919) Heger, M. L. 1919, Lick Obs. Bull., 10, 59
- Heger (1922) Heger, M. L. 1922, Lick. Obs. Bull., 10, 141
- Heiles (1997) Heiles, C. 1997, ApJ, 481, 193
- Higgs & Tapping (2000) Higgs, L. A., & Tapping, K. F. 2000, AJ, 120, 2471
- Hobbs (1974) Hobbs, L. M. 1974, ApJ, 191, 395
- Hobbs (1978) Hobbs, L. M. 1978, ApJS, 38, 129
- Horne (1986) Horne, K. 1986, PASP, 98, 609
- Humphreys (1978) Humphreys, R. M. 1978, ApJS, 38, 309
- Johnston et al. (2003) Johnston, S., Koribalski, B., Wilson, W., & Walker, M. 2003, MNRAS, 341, 941
- Kennedy et al. (1996) Kennedy, D. C., Bates, B., & Kemp, S. N. 1996, A&A, 309, 109
- Kennedy et al. (1998) Kennedy, D. C., Bates, B., & Kemp, S. N. 1998, A&A, 336, 315
- Lauroesch & Meyer (1999) Lauroesch, J. T., & Meyer, D. M. 1999, ApJ, 519, L181
- Lauroesch & Meyer (2003) Lauroesch, J. T., & Meyer, D. M. 2003, ApJ, 591, L123
- Lauroesch et al. (2000) Lauroesch, J. T., Meyer, D. M., & Blades, J. C. 2000, ApJ, 543, L43
- Lauroesch et al. (1998) Lauroesch, J. T., Meyer, D. M., Watson, J. K., & Blades, J. C. 1998, ApJ, 507, L89
- Lindblad (1927) Lindblad, B. 1927, MNRAS, 87, 553
- Liu et al. (1989) Liu, T., Janes, K. A., & Bania, T. M. 1989, AJ, 98, 626
- Marsh (1989) Marsh, T. 1989, PASP, 100, 1032
- McCarthy et al. (2000) McCarthy, M. C., Chen, W., Travers, M. J. & Thaddeus, P. 2000, ApJS, 113, 105
- Meyer & Blades (1996) Meyer, D. M., & Blades, J. C. 1996, 464, L179
- Meyer & Lauroesch (1999) Meyer, D. M., & Lauroesch, J. T. 1999, ApJ, 464, L179
- Morgan, Sharpless, & Osterbrock (1952) Morgan, W. W., Sharpless, S., & Osterbrock, D. 1952, AJ, 57, 3
- Münch (1953) Münch, G. 1953, PASP, 65, 179
- Münch (1957) Münch, G. 1957, ApJ, 125, 42
- O’Dell et al. (1993) O’Dell, C. R., Valk, J. H., Wen, Z., & Meyer, D. M. 1993, ApJ, 403, 678
- Oosterhoff (1937) Oosterhoff, P. Th. 1937, Ann. Sternw. Leiden, 17, 1
- Pan et al. (2001) Pan, K., Federman, S. R., & Welty, D. E. 2001, ApJ, 558, L105
- Péquignot & Aldrovandi (1986) Péquignot, D., & Aldrovandi, S. M. V. 1986, A&A, 161, 169
- Plaskett (1923) Plaskett, J. S. 1923, MNRAS, 84, 80
- Plaskett & Pearce (1930) Plaskett, J. S., & Pearce, J. A. 1930, MNRAS, 90. 243
- Price et al. (2000) Price, R. J., Crawford, I. A., & Barlow, M. J. 2000, MNRAS, 312, L43
- Price et al. (2001b) Price, R. J., Crawford, I. A., Barlow, M. J., & Howarth, I. D. 2001b, MNRAS, 328, 555
- Price et al. (2001a) Price, R. J., Crawford, I. A., & Howarth, I. D. 2001a, MNRAS, 321, 553
- Rollinde et al. (2003) Rollinde, E., Boissé, P., Federman, S. R., & Pan, K. 2003, A&A, 401, 215
- Salama et al. (1996) Salama, F., Bakes, E. L. O., Allamandola, L. J., & Tielens, A. G. G. M 1996, ApJ, 458, 621
- Slesnick et al. (2002) Slesnick, C. L., Hillenbrand, L. A., & Massey, P. 2002, ApJ, 576, 880
- Smoker et al. (2001) Smoker, J. V., Lehner, N., Keenan, F. P., Totten, E. J., Murphy, E., Sembach, K. R., Davies, R. D., & Bates, B. 2001, MNRAS, 322, 13
- Spitzer (1978) Spitzer, L. 1978, Physical Processes in the Interstellar Medium (New York: Wiley)
- Stanimirović et al. (2003) Stanimirović, S., Weisberg, J. M., Hedden, A., Devine, K., Greent, T., & Anderson, S. B. 2003, astro-ph/0307002
- Struve (1928) Struve, O. 1928, ApJ, 67, 353
- van Leeuwen (1999) van Leeuwen, F. 1999, A&A, 341, L71
- Walborn (1982) Walborn, N. R. 1982, ApJS, 48, 145
- Walborn (1995) Walborn, N. R. 1995, Rev. Mexicana Astron. Astrof. Ser. de Conf., 2, 51
- Walborn & Hesser (1975) Walborn, N. R., & Hesser, J. E. 1975, ApJ, 199, 535
- Watson & Meyer (1996) Watson, J. K., & Meyer, D. M. 1996, ApJ, 474, L127
- Welty & Fitzpatrick (2001) Welty, D. E., & Fitzpatrick, E. L. 2001, ApJ, 551, L175
- Welty et al. (1994) Welty, D. E., Hobbs, L. M., & Kulkarni, V. P. 1994, ApJ, 436, 152
- Welty et al. (1996) Welty, D. E., Morton, D. C., & Hobbs, L. M. 1996, ApJS, 106, 533
- White et al. (2001) White, R. E., Allen, C. L., Forrester, W. B., Gonnella, A. M., & Young, K. L. 2001, ApJS, 132, 253
- Whiteoak & Gardner (1980) Whiteoak, J. B., & Gardner, F. F. 1980, PASA, 4, 95
- Whiteoak & Gardner (1985) Whiteoak, J. B., & Gardner, F. F. 1985, PASA, 6, 164
- Wilson & Merrill (1937) Wilson, O. C., & Merrill, P. W. 1937, ApJ, 86, 44
- Young (1920) Young, R. K. 1920, Pub. Dom. Astro. Obs., 1, 219