Archival light curves from the Bamberg Sky Patrol – CF Octantis, 1964–1976
Abstract
We use the archive of the Bamberg Sky Patrol to obtain light curves of the active K subgiant CF Octantis for the interval 1964-1976. Digitised images of the field near CF Oct were obtained with a flat–bed scanner. Aperture photometry was performed of photo–positives of these images. Using a transformation to second order in plate magnitude, and first order in BV, for 9 field stars for each plate, the B magnitudes of CF Octantis were obtained for just over 350 plates. The estimated precision of an individual determination of the B magnitude of CF Oct is 0.05 mag. Analysis of the resulting data reveals the known 20 d rotational variation of this star, and shows the evolution of the light curves from year to year. We obtain light curves with good phase coverage for 1964 to 1969 inclusive, partial light curves for 1970 and 1976, and a few data points from 1971. The amplitude of variation ranges from 0.2 to 0.4 mag. There is evidence that the characteristic rotation period of the star in the 1960s was slightly less than that measured from photoelectric photometry in the 1980s.
keywords:
techniques: photometric – stars: individual: CF Octantis (HD 196818) – stars: spots – stars: activity – stars: variables: other1 Introduction
Detailed studies of astrophysically interesting objects often require long–term datasets to fully understand the nature of any variations. There is a growing awareness that the archives of astronomical photographic plates potentially contain an enormous quantity of information, extending, in some cases, over several decades or longer (e.g. Kroll et al, 1999). The utility of photographic plate archives for the long–term study of active stars has been demonstrated by, for example, the work of Phillips & Hartmann (1978), Hartmann et al. (1981), and Bondar (1995). These works present data gleaned from plate archives showing the longer term (decadal) variation of a number of active stars, revealing strong evidence for starspot cycles in some objects. The stars studied were mostly BY Dra objects (dKe or dMe flare stars), although one star, PZ Mon, has since been shown to be a K giant, and probably a member of the RS CVn class (Saar, 1998).
In this work, we use the Southern Sky Patrol plate archive of the Dr. Remeis Sternwarte, Bamberg, Germany (hereafter referred to as the Bamberg Observatory) to investigate the behaviour of a selected star, using digitised plate images obtained with a fast scanner. Our target object is the active, probably single, K subgiant CF Octantis. The long–term brightness variations of the star can be followed, and seasonal light curves can be found. The techniques we use should be applicable to a variety of variable stars of moderately large amplitude (0.15 mag).
In the next section we briefly describe the Bamberg sky patrol programme, provide background information on our choice of target star for this study, and outline how the plates were scanned and B magnitudes obtained from the digital data. Section 3 presents a discussion of our results, including estimates of the accuracy and precision of the photometry, and an assessment of the wider applicability of this approach.
This paper is mainly concerned with the techniques used to obtain photometric data from the archival plates, using CF Oct as an example. A more detailed discussion of the scientific findings will be presented later. An earlier paper (Innis et al., 2004) presented photometric measurements of CF Oct from a small subset of the data presented here, but in that case the photometry was from digital camera images of the plates, obtained before the plate scanner was installed at Bamberg Observatory. In the last section of this paper we will briefly compare the results from the two techniques.
2 Data
2.1 Bamberg Sky Patrol
The Southern Sky patrol was undertaken by the Bamberg Observatory from 1963 to 1976, specifically to identify and monitor variable stars. The early plates were taken at Boyden, South Africa, but from 1967 the programme moved to stations at Mt John, New Zealand, and San Miguel, Argentina. A bank of six cameras on a common mount obtained wide–field plates (approximately 1313∘). The patrol plates were exposed for 1 hour, and recorded stars to magnitude 14. For further information see Strohmeier & Mauder (1969). The blue-sensitive emulsion (Agfa Gevaert 67 A50) produced data that were interpreted as photographic magnitudes (mpg). Many variable stars were found and characterised (e.g. Schoeffel & Koehler, 1965). The plates have yielded a photometric precision near 0.05 mag, as demonstrated by iris photometer measurements by various workers (e.g. Schoffel, 1964).
The plate archive is maintained in good condition by the Bamberg Observatory. An on–line catalogue of the archive is available at the Sofia Wide Field Plate Database at http://www.skyarchive.org. In mid 2003 a fast scanner was installed at Bamberg, allowing digital copies of the plates to be obtained. This paper presents some of the first results of use of this scanner.
2.2 CF Octantis (HD 196818)
CF Octantis (HD 196818, V 8, 20h 50m, 80∘). was discovered to be variable by the Bamberg southern sky patrol, and was designated BV 893 (Strohmeier, 1967). At that time the period and the nature of the variability were not determined. CF Oct is now known to be a K0 star with a large and variable photometric rotational modulation (0.1–0.35 mag in V) with a 20.1 d period. Photometry of this star has been published by Innis et al. (1983), Lloyd Evans & Koen (1987), Pollard et al. (1989) and Innis, Coates and Thompson (1997). Spectroscopic studies include those of Hearnshaw (1979), Collier (1982), and Innis et al. (1997), and show the star exhibits strong Ca II emission, and a filled–in H line. The star is probably single, as no significant radial velocity variations have been found (Innis et al, 1997). The star is a strong, flaring, microwave radio source (Slee et al., 1987a, b). The spectral type is K0 IIIp from Houk & Cowley (1975). Innis et al. (1997) however suggested the star is more likely a subgiant. The Hipparcos distance of 200 pc, together with the representative V maximum near 8, lead to an MV around 1.5, between that of a subgiant (MV=3) and that of a giant (MV=0; Allen, 1973).
The high southerly declination of CF Oct meant the star was well covered by the Bamberg sky patrol. One camera on the Bamberg mount was centred on 77∘ declination. Plates obtained with this camera on nominal centres of 19h, 20h, 21h, and 22h of right ascension all included CF Oct and the surrounding field. Hence on any given night, this star may appear on up to four plates, depending on the season and weather conditions. The data to be presented here come from approximately 350 plates from 1964 to 1976.
2.3 Scanning the field of CF Octantis
In May 2003 a flatbed Epson Expression 1640XL scanner with a transparency unit became operational at the Bamberg observatory. It provides an opportunity for photographic plate and film digitization with a spatial resolution of 16 microns and a maximal size of A3 format. The output data are stored in 14–bit (16383 grey scale levels) FITS format. Dark frame subtraction, flat fielding and changing from photo-negative to photo-positive image are part of the automated scanning process. Typical header data are telescope type and WFPDB identifier, object of interest, and coordinates of plate centre.
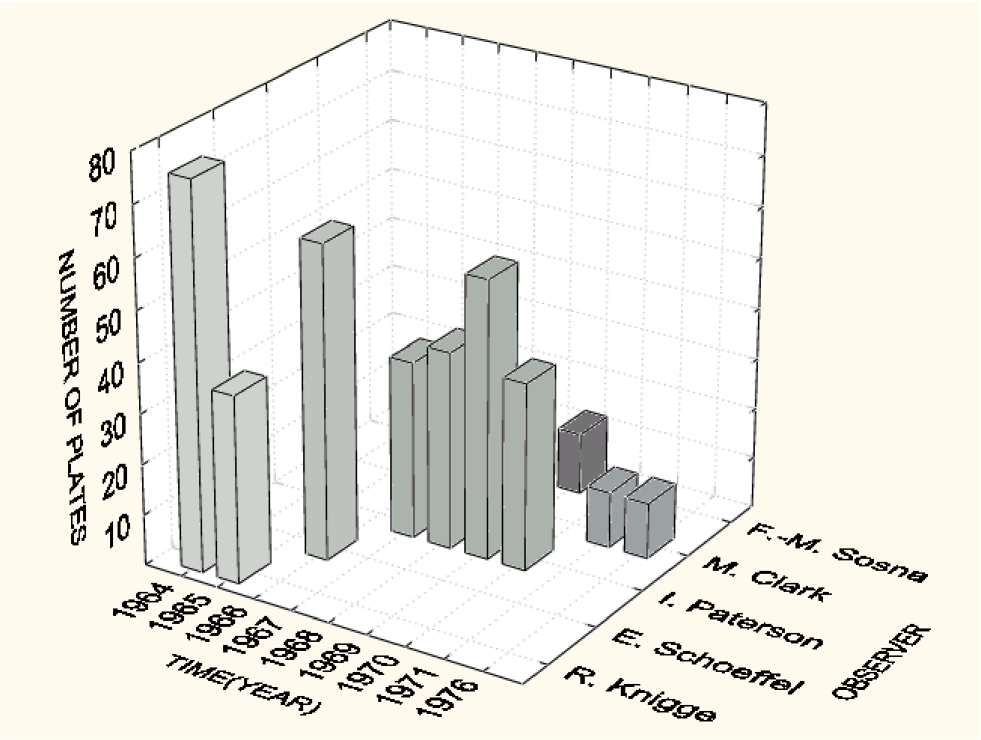
For plates obtained with 10–cm astrographic cameras of the Bamberg observatory (at a scale of 338 arc sec mm-1) the resulting resolution is 5.25 arc sec pixel-1. A total of 375 fields centred on CF Oct were digitized in May and June 2003. Plates obtained in the period 1964-1966 are from Boyden Observatory (Republic of South Africa), 1967-1976 (with lack of plates in the period 1972-1975) are from Mount John University Observatory - Lake Tekapo (New Zealand), and 12 plates from 1969 are from San Miguel Observatory (Argentina). For the selected area of 2.75∘ 2.75∘ (4 cm 4 cm) it took 1 minute for digitization. The file size is 8 Mb. The epochs of the scanned plates, and also the observers involved, are given in Figure 1.
2.4 Obtaining instrumental (plate) magnitudes with IRAF
A number of workers have shown that aperture photometry of (photo–positive) images of digitised astronomical plates can yield satisfactory results if care is applied in the reduction procedures (e.g. Burkeholder, 1995; Vogt & Kroll, 1999). As is well known, the photometric response of the plate to incident light is significantly non–linear. The reduction technique must take this into account. It is apparent also that most (if not all) of the ‘modern’ astronomical reduction packages have arisen with the advent of highly–linear digital detectors, and have not been designed with photographic plates in mind. Generally speaking these programs have enough flexibility to be adapted for use. We have used the package IRAF for the analysis presented here, using the interactive task IMEXAMINE to obtain aperture photometry.
The star aperture radius and sky annulus radii were chosen to include the star image (from inspection of the radial profile plot of the brightest stars we measured), and to avoid contamination from nearby stars. We typically used a 20 pixel radius star aperture (hence an area 1250 pixels), with sky inner and outer annuli 25 and 30 pixels (area 860 pixels).
The brighter star images recorded on the scans showed flat–topped cores, indicative of saturation – either in the emulsion or due to limitations of the scanner, with a very rapid fall to background. The aperture photometry we perform is, in large part, therefore a measure of the dimensions of the saturated stellar image. Instrumental magnitudes are calculated in the conventional manner as
| (1) |
where C are the ‘counts’ recorded in the scanning process, and K is an arbitrary constant (the zero point) chosen for convenience so the Mi’s were comparable to their catalogued values. We used the same value of K for all plates. The instrumental magnitudes must be carefully calibrated and transformed to a scale linear in B or mpg magnitude. We outline below how this was accomplished.
The IMEXAMINE task has an iterative facility to determine the star’s FWHM and adjust the aperture radius to suit. Possibly due to the non–gaussian stellar profiles, in a small number of instances the iterative procedure failed to converge. Examination of other cases showed that, although convergence was obtained, the resulting flux sum, and hence derived magnitude, was clearly incorrect. Consequently we turned off this iterative procedure, in effect fixing the aperture to the user–specified 20 pixels. Inspection of the data showed signifcantly less scatter in the derived magnitudes with this procedure.
2.5 Deriving the plate transformations
We measured nine (non–variable) field stars, of small (less than 2 degree) angular separation from CF Oct, ranging in B mag from 8.7 to 10.7 to obtain for each plate a transformation equation from plate magnitude to B magnitude. We also derived transformation equations between plate magnitude and mpg, the photographic magnitude. The transformations were equally good whether B or mpg was being used. We mostly refer to the B–magnitude results as we believe these have greater applicability. The B magnitudes of the field stars have been determined by transforming the Tycho–2 BT and VT data (ESA, 1997), using interpolations of the tables presented by Bessell (2000).
It should be noted that this transformation was not only to provide a colour correction from the ‘natural’ system of the emulsion and camera to standard B magnitudes, but also corrected for inherent non-linearities in the photographic technique.
For each plate a least–squares solution was found for the equation
| (2) |
where is an additive constant. The least-squares solution was found using the Singular Value Decomposition (SVD) approach described by Press et al. (1992), and for the fits performed here two independent approaches were used, one being a FORTRAN implementation based on Press et al (1992), and the other using the OCTAVE data analysis package (by J.W. Eaton) which includes an SVD function. The results were effectively indistinguishable. In applying the SVD method, it is necessary to set to zero the reciprocal of certain singular values in order to prevent observational errors (noise) dominating the solution. Our choice of which values to zero followed the approach recommended by Rucinski (1999), where the singular values are inspected, and an appropriate cut–off is determined. For the configuration we employed, the application of the SVD procedure yielded 4 singular values for each plate. The distribution of the singular values is shown (on a semilog axis) in Figure 2. There was a large measure of uniformity in the magnitude of the singular values found for each plate, as shown by the four clusters of data in this figure. The lowest cluster, near 2.2 in the log (0.005) we identified as arising from observational noise. These values would dominate the SVD solution (as the singular values are inverted in solving the equation), and hence their reciprocals were set to zero. Doing so, the additive term, , took on values near zero for all plate solutions, while not doing this resulted in the terms varying from 40 to 20.

The form of equation 2 was chosen after a number of trials, including using third order terms in Mi, and with and without an additive term. The test in each case was how constant were the derived field–star magnitudes after applying the transformation equation to the plate magnitudes. We found that a fit linear in Mi and BV was significantly better than a second order fit in Mi with no colour term. A five–parameter fit using terms of first and second order in both Mi and BV, with an additive constant, was marginally better than that found with equation 2, but the improvement was small. For simplicity we have adopted equation 2 for use here. Our approach was developed independently of the earlier work of Kroll & Neugebauer (1993), and Vogt & Kroll (1999), but has reached essentially the same conclusions. However, Kroll & Neugebauer (1993) and Vogt & Kroll (1999) performed their fitting using a measure of the stellar flux (not the instrumental magnitude) derived from the stellar profile.
We defer further discussion of the nature of the colour correction to a later section. However we note briefly that if no colour term is included the derived field star magnitudes can systematically vary by up to 0.5 mag over the data set. These variations, also seen in the raw plate magnitudes, are removed almost entirely by inclusion of a colour term in the transformation equation. As shown later, the colour term, , shows consistency within a season, but varies slowly from season to season. This may relate to either ageing of the plates prior to exposure, or changes in the properties of the optical coatings on the camera lenses, or possibly even to atmospheric effects, or a combination of all of these. We have also found a significant step in the values of this term between 1966 and 1967, when the observing site changed from South Africa to New Zealand.
Once the terms have been found, the plate magnitudes of the field stars can be transformed to B magnitudes. This is not an independent estimate of the field star magnitude, as of course the plate magnitudes form the input data used to derive the transformation. However, this allows the consistency of the technique to be examined. Figure 3 shows the B magnitudes for HD 196520 and HD 192950 derived using equation 2. There is no evidence for variation above what appears to be observational scatter. We found similar results for all field stars. There may be evidence for small systematic offsets between seasons at the 0.05 mag level, which presumably relates to the colour sensitivity of the plates, which is discussed below.

The root–mean–square scatter in the derived (transformed) B magnitudes for the 9 field stars over the 1964–1976 interval are shown in Figure 4. These values range from 0.04 to 0.09, with a mean of 0.058 mag. The fainter field stars tend to exhibit larger scatter, although this may relate more to limitations of the fitting procedure than to photon noise. For stars brighter than 10.0, the standard deviations of the derived magnitudes are all less than 0.07 mag, with a mean of 0.05 mag. As CF Oct has B9.1, it suggests a precision of 0.05 mag may be obtainable for this star when using the method presented here.

2.6 Obtaining the B magnitudes of CF Octantis
With the coefficients determined for each plate, it is a trivial matter to apply equation 2 to the plate magnitude measured for CF Oct and determine the B magnitude. The BV value for CF Oct must of course be known in order to be able to apply the calibration equation. We adopt a BV of 1.10 (Innis et al., 1997). It is known that the BV of CF Oct is slightly variable, from 1.10 to 1.15 (Pollard et al., 1989, Innis et al., 1997). Using a BV of 1.15 would have the effect of brightening each derived B magnitude datum by 0.015 mag. As the likely observational error in deriving the magnitude for CF Oct is around 0.05 mag, the uncertainty that arises from using a representative BV for this star can be neglected.
Twenty two plate scans proved unsuitable for use, either through plate defects (e.g. scratches), poor exposure levels due to cloud, or similar reasons. The B magnitudes of CF Oct derived by use of equation 2 for the remaining 353 plates are plotted in the upper panel of Figure 5, phased with the known 20.15 d period (Pollard et al., 1989; Innis et al., 1997). There is a clear variation with this period. The light curve is known to be variable (op cit), which contributes to a significant amount of the scatter in this plot, as we will show. For reference, the middle and lower panels of Figure 5 show the derived B data for HD 195460 (BV=0.20) and HD 196520 (BV=1.05) respectively, also plotted with the same period. The standard deviations of the data for these field stars are, to three decimal places, 0.046 and 0.053 mag respectively.

The nine individual light curves of CF Oct from 1964 to 1976 are shown in Figure 6, together with a plot showing the overall light variation with time. Good phase cover was obtained in the seasons from 1964 to 1969 inclusive, with reasonable cover in the other years except for 1971. As noted, the light curve of CF Oct is known to vary, which is presumed to be related to changes in starspot properties. It is however a valid question to ask if the data we show in Figure 6 represents real changes in CF Oct, or arises simply from some artifact of our analysis, such as an incomplete allowance for instrumental effects.
We cannot, on the basis of these data alone, entirely rule out such effects in the CF Oct data shown in Figure 6. However, as we have ensured, via our transformation procedure, that the derived magnitudes of the field stars show a typical variation of 0.06 mag (one standard deviation quoted) during the 1964–1976 span of the data, we have a large measure of confidence in internal consistency of the CF Oct data derived from the Bamberg plates. Of the ten stars measured (nine field stars and CF Oct), only CF Oct showed any evidence for periodic variation in the 2 to 500 d range, as tested using the phase dispersion minimisation (PDM) method of Stellingwerf (1978); the CF Oct data showed strong evidence for a 20 d variation (e.g. see Figure 5), corresponding to the known period of variation of the star. It is clear that the data quality is high enough to determine intra–seasonal light curves. We also believe, based on the long–term constancy of the derived magnitudes of the field stars, that inter–seasonal changes can also be followed, albeit with an uncertainty of perhaps 0.05 mag between seasonal data sets.

3 Discussion
3.1 The colour dependence of the photographic plates
Figure 7 shows the values of the parameters (equation 2) against JD for the Bamberg plates we have studied in this work. From the top panel, it is seen that (the term linear in instrumental magnitude) is around ten times as big as (the second-order term). The plate magnitudes are typically around Mi10, hence the contribution to the final magnitude from these two terms is approximately equal. The colour term shows a systematic change over time, with an obvious step between the 1966 South African plates and the 1967 New Zealand plates near JD 2439500. The values near the start and end of the data span are near zero. This appears coincidental however, as each season of data is processed independently. (Indeed, each plate is processed independently.) The term shows evidence for changes of opposite sense to , which may suggest these two terms may be interrelated at some level. However, a varying colour term is present, as evidenced by the raw instrumental magnitudes noted earlier.
The variable colour dependency may arise from several factors. We understand that plate manufacture and plate development were carefully controlled to ensure consistency of spectral response. It is possible however that despite this, some spectral variation may have resulted. Plate storage may also be a determining factor. Equally, ageing of optical coatings and surfaces in the cameras may conceivably have an effect, one which could vary slowly and systematically over time, as seen in these data. Atmospheric effects may also be significant. Mt John Observatory in New Zealand, at latitude 44∘ S, is nearly 15 degrees south of the latitude of Boyden, however the altitudes of the two sites are comparable at 1000 m. At first look, the more southerly location of Mt John may be expected to show a reduced colour dependency for the plates for CF Oct (declination 80∘), which however is not the case. Further discussion of extinction effects is given in the following section. For the present we conclude that the changes in the colour dependence we have seen are not easily explicable.
The data we have presented here come from one camera at each site. As noted, the Bamberg programme used multiple cameras on a common mount. Potentially there is value in comparing plates taken with the different cameras at each site. If the colour dependency is mainly due to factors associated with the plates, and if these factors applied equally to all plates exposed near a particular time, then a similar colour dependence to that in Figure 7 would be obtained for all cameras. The same would apply if atmospheric effects dominated, although a dependency on airmass (and hence declination, as the plates were exposed near upper transit) may be seen. Only if the colour dependency were local to each camera (e.g. ageing of optical surfaces) would there be different dependencies.

3.2 Extinction effects
The data have been derived without an explicit correction for atmospheric extinction. As all stars are within a 2.752.75∘ field, differential extinction effects are smaller than the 0.05 mag plate precision, and can be neglected. However, colour-dependent extinction is also present. The extinction of a star of colour C, at airmass X, is approximately:
| (3) |
where k′ and k′′ are the first and second order extinction coefficients. More formally, the extinction is (e.g. Young, 1974, Young et al., 1991):
| (4) |
where R is a measure of the atmospheric reddening and W is proportional to the square of the optical bandwidth. The product WR is equal to k′′. The third term, known as the Forbes effect (e.g. Young, Milone, & Stagg, 1994) is usually neglected in optical measurements. For our nominal B band observations, using BV as the colour index, C, R is the difference in extinction coefficients between the B and V bands, and W is around 0.28. When comparing the atmospheric extinction of two stars of differing colour, the first term and last terms are maximal when the differences in airmass are maximal. The second term depends on the total airmasses, and hence is maximal when the stars are at or near lower transit. The Bamberg plates were all obtained within a few hours of upper transit of the stars.
As a test to see if unresolved extinction effects were affecting the magnitudes we derived, we implemented a scheme based on equation 4. Because the raw plate magnitudes (or ‘counts’) from the aperture photometry have no clear relation to photon counts, we adopted the following method. The extinction for each field star was determined using equation 4. We adopted extinction coefficients of 0.2 and 0.3 mag airmass-1 for the V and B bands respectively. The catalogued B magnitude of the star was reduced by the amount of calculated extinction (i.e. the extra-atmospheric catalogued magnitude was corrected to represent the magnitude that would have been observed at that time). A preliminary fit between the plate magnitudes and the extinction corrected magnitudes (using equation 2) was performed. The magnitudes derived from the fit were then corrected to extra-atmospheric magnitudes (using the same corrections calculated as above), and a second fit between these values and the catalogued B magnitudes was found.
The final magnitudes of the field stars and CF Octantis were effectively identical to those derived without extinction corrections. This was not entirely unexpected. As noted, differential extinction effects can be neglected, as the stars are at small angular separation from each other. In this case, when comparing two stars at similar airmass, only the second term in equation 4 remains: For two stars with a BV difference of 1.0, the colour-dependent extinction amounts to about 0.05 mag in B. This is comparable to the precision of measurement of any given star image on a plate. Note too it is significantly less than the plate colour dependence term (Figure 7).
We conclude, on this basis, that extinction effects are unlikely to be significant, and probably do not account for the appearance of small (0.05 mag) level shifts in the mean levels of the field stars from season to season, as seen for example in Figure 3. Additionally, the form of equation 2, which includes a term in BV, is possibly able to incorporate a colour dependent extinction term, so that some implicit correction is already applied. Given the observational error of 0.05 mag from the photographic material, further correction appears unecessary.
3.3 Accuracy and precision of the results
From the analysis described above, the magnitudes of the field stars and CF Oct can be determined to an estimated 1–standard deviation precision of 0.05 mag from the Bamberg patrol plates. This is in itself not a new result, as it is comparable to the precision reported from iris photometry of these plates at the time the patrol was still in operation (e.g. Schoffel, 1964). It is clear however that with the advent of fast scanners, and the use of very modest computing power, many years of digitised plate scans can be processed quickly and easily to recover stellar brightnesses of precision comparable to the earlier iris photometer data.
Table 1 summarises the mean magnitudes and standard deviations found for CF Oct and the 9 field stars chosen for this work for the interval 1964–1976, using equation 2. Also included for reference are the B and BV magnitudes of these stars obtained from Tycho 2 photometry. The mean values derived using equation 2 are close to the known (‘catalogued’) B values. The mean difference (derivedcatalogued B) is 0.00 mag, with a standard deviation of 0.04 mag. The biggest difference is 0.07 mag. The procedure we use depends on accurately known magnitudes, and as noted the derived field star magnitudes are not determined independently of the fit. However, it appears that the accuracy with which the field star magnitudes can be recovered is comparable to the precision with which individual stars can be measured.
| Star | derived B | B | B-V | |
| CF Oct | 9.10 +/- 0.11 | (9.1) | (1.1) | |
| CP -80 946 | 10.42 +/- 0.08 | 10.40 | 0.23 | |
| HD 192573 | 10.54 +/- 0.09 | 10.59 | 0.56 | |
| HD 194005 | 10.75 +/- 0.07 | 10.75 | 1.21 | |
| HD 195460 | 9.06 +/- 0.05 | 8.99 | 0.20 | |
| HD 196520 | 8.73 +/- 0.05 | 8.69 | 1.05 | |
| CP -80 980 | 10.64 +/- 0.11 | 10.62 | 0.45 | |
| HD 191289 | 8.94 +/- 0.05 | 8.97 | 0.22 | |
| HD 192950 | 9.36 +/- 0.05 | 9.42 | 0.42 | |
| HD 195291 | 9.75 +/- 0.07 | 9.78 | 0.66 | |
Clearly, the method we have used is unlikely to be valid unless the field stars include a range of BV (so the colour dependence of the plates can be determined) and cover a range of B brighter and fainter than the target star. Including stars close in brightness to the target star also appears desirable, to prevent plate-to-plate variations of a poorly constrained fit giving rise to artifacts in the target star’s magnitude.
For this initial study we selected and interactively measured only a relatively small number of stars on each digitised plate. There is however no reason why automatic aperture photometry could not be performed on all suitable star images. The transformation equations could be derived using the majority of the stars, but a small number (say 6 to 10) could be omitted from the fit, and their magnitudes derived in the same way as for the target star (i.e. as we have done here for CF Oct). Their constancy (or otherwise) would provide a completely independent check on the quality of the transformation, and, by implication, a check on the data quality for the target star.
3.4 Long–term behaviour of CF Oct
We intend to present a more detailed analysis of the 1964–1976 CF Oct data in a later paper. However, we present here a composite photometric history of this star, combining these Bamberg data with previously published photometry. To do this, we have ‘converted’ the B data to a proxy for V, by subtracting 1.10. This is a representative maximum BV value for CF Oct (Lloyd Evans & Koen, 1987; Pollard et al., 1989; Innis et al., 1997). The observed range in BV of CF Oct is about 0.05 mag (op cit.), which is comparable to the precision of these Bamberg data. Also, as noted, we used a constant BV for CF Oct when deriving the B magnitudes from the plate magnitudes. For the purposes of this comparison using a representative BV value seems justified.
Figure 8 shows the resulting plot. The Bamberg proxy V data are shown as squares. The upright crosses show photoelectric V data from Innis et al. (1983), Lloyd Evans & Koen (1987), Pollard et al. (1989), Innis et al. (1997), and the Hipparcos epoch photometry (ESA, 1997), transformed from Hp to V. The maximum brightness (V7.8) and mean level of the Hipparcos data is significantly greater than the other photoelectric observations. Tycho photometry (ESA, 1997, not shown) transformed to standard V magnitudes closely matches the Hipparcos data in mean brightness levels, and confirms the star really was bright at this time. It is interesting to note that the typical maximum of the proxy V Bamberg data is similar at V7.8. The approximately 9000-d separation between these comparable maxima corresponds to 25 year. While it is tempting to consider the shape of the overall light variation shown in Figure 8 as a stellar activity cycle, clearly a much longer time series would be needed to address this issue. We defer further comment to a later paper, except to note that the 9 year cycle suggested by Pollard et al. (1989) for CF Oct is not obvious in these data.

3.5 Evidence for differential rotation of CF Oct
As noted, the rotation period was measured for CF Oct from a number of independent sources from photoelectric photometry between 1979 and 1988, the results of which were 20.18 d (Lloyd Evans & Koen, 1987); 20.150.06 d (Pollard et al., 1989); and 20.15 d (Innis et al., 1997). Innis (1986) estimated the period error in the latter data (from 1982 to 1986) as 0.01 d. The phase of minimum light for most of these data (excepting the early 1979 South African data) can be kept relatively constant assuming a period of 20.15 d. On this basis, Innis et al. (1997) concluded there was no evidence for differential rotation for CF Oct.
With the increased data now available from the Bamberg archive, it is worth briefly revisiting this issue here. Inspection of Figure 6, where the phase plots have been constructed using a period of 20.15 d, reveals an apparent smooth migration of minimum light from phase 0.5 in 1964 to 0.2 or 0.3 in 1969. This suggests that the rotation period of the dominant spot groups on CF Oct was slightly shorter than 20.15 d.
We have estimated the rotation period for the interval 1964 to 1969 by forcing the phase of minimum light to be constant. A period near 20.05 d is found, but the relatively large observational error per point (compared to photoelectric photometry) together with the intrinsic variablity of the light curve makes a definitive estimate difficult. We also performed a PDM analysis on the 1964-1976 data, which returned a period near 20.05 d. PDM analyses of the 1964-1966 data and, separately, the 1967-1969 data, returned periods of 20.07 d and 20.03 d respectively. Figure 9 shows as an illustration of these results the PDM theta spectra for the 1964–1969 data obtained in this current work (squares), and for the 1981–1988 photoelectric photometry from Lloyd Evans & Koen (1987), Pollard et al. (1989) and Innis et al. (1997), shown as upright crosses. The most likely period is indicated by the minimum value of theta. The 1964–1969 data show a period near 20.05 d, while the photoelectric data from the 1980s return a period near 20.15 d, in agreement with the results found from choosing periods that minimised the drift in phase of minimum light.

Figure 10 shows CF Oct B data for 1964 to 1969 inclusive, obtained in this work, plotted with the 20.15 d rotation period (upper panel) derived from the 1980s era photometry and (lower panel) the same data with a trial period of 20.05 d. There is a slight reduction in scatter in the lower panel compared to the upper, largely due to the removal of the migration in phase of minimum light noted earlier. On the basis of the analysis here, and given the detection of differential rotation in other active stars, we tentatively conclude that the characteristic rotation period of CF Oct exhibited a small but real change between the 1960s and the 1980s. Further discussion of this will be given in a later paper.

3.6 Comparison of photometry from scanned and digital camera images of the plates
In the introduction we mentioned that preliminary analysis of a subset of the 1966 plates was carried out by Innis et al. (2004). In that study, commenced prior to the installation of the Epson scanner at Bamberg, digital camera images of back–illuminated plates were used. Photographic magnitudes were derived for CF Oct by performing aperture photometry, expressing the results as differential magnitudes with respect to HD 196520. It was known at that time that as CF Oct and HD 196520 are very close in magnitude, colour, and angular separation on the sky, any effects due to non-linearity, colour dependence, or vignetting over the camera field of view would be minimised. What was not appreciated in this early study was just how large the colour dependence of the plates would be. Hence it is worth comparing the results from the scanned plates, treated in the manner outlined in this paper, with the earlier results presented in Innis et al. (2004). Figure 11 shows a phase plot of photographic magnitudes for CF Oct in 1966 derived from scanned plate images (upright crosses), together with the results from the digital camera study (open circles) of the subset of the 1966 data used in Innis et al. (2004). These latter data were presented as differential magnitudes in Innis et al. (2004). We have added 8.52, the catalogued photographic magnitude for HD 196520, to produce this plot. We use the same period and epoch as for Figure 6.

The agreement between the two datasets is reasonably good, as the shape, range, and mean brightness are similar. There is an indication of small differences, such as near phase 0.2 where the digital camera data of Innis et al. (2004, shown as circles) appear slightly fainter than the scanned data. Innis et al. (2004) found the digital camera images gave measured magnitudes, for stars in the range mpg from 8.5 to 10.5, that could be directly transformed to catalogued photographic magnitudes simply by choosing an appropriate additive constant. The data obtained in the current work (upright crosses) were obtained by transforming plate magnitudes to mpg using the methods described in sections 2.5 and 2.6. Some small differences between the datasets almost certainly arise in consequence of this.
The digital camera data were obtained with an 8–bit, non–scientific grade camera. At least four independent exposures of each plate were made and measured, and the results averaged to produce the light curve shown. The data quality from the 14–bit scanner appears to be superior, and we would recommend this as the preferable means of plate digitisation if available. Where a scanner is not available, digital camera images may still yield worthwhile results if care is taken in the analysis.
3.7 Applicability to other objects
In principle, photometric histories of a range of other objects could be obtained from digitised images of the Bamberg plates, analysed in a manner similar to that presented here. Our study has extended only over the approximate magnitude range from B8.7 to 10.8. It would be expected that the analysis could be extended to fainter stars, and perhaps also to brighter ones. It may be possible to derive a series of satisfactory transformations for each plate, each extending only over 2 magnitudes or so, but with a combined range reaching down to the approximate plate limit of B14.
If the plate accuracy and precision we have found, of around 0.05 mag, is representative of the entire plate archive, any star with a variation of 0.15 mag or more is in principle capable of yielding a 3–sigma detection. For strictly periodic variables, with a non-varying period, this amplitude limit may be lowered if enough data can be obtained.
The plate exposures are typically of 1 h in duration. For very rapidly varying stars, such as a short-period deeply eclipsing binary, the long exposure would tend to average out the variation. Additionally, unless the star is at a high southerly declination (such as CF Oct) where the camera fields have good overlap, the star may only appear on one exposure per night.
BV for the star must be known, due to the large colour dependency of the plate response. Objects that undergo large colour changes would not be suitable targets for our approach, unless BV changes in a repeatable, phase–locked manner, and can be in some way calculated and corrected for.
Given these caveats, a large number of potential targets remain. We hope that the data we have presented here for CF Oct will aid in understanding not only the behaviour of this particular object and others of its class, but will give a hint of the scientific data yet to be found in the world’s astronomical plate archives.
4 Conclusions
Our analysis of digitised images of the Bamberg Sky Patrol plates of the fields of the active K star CF Oct has shown that estimates of the B magnitude of the star, to a precision of 0.05 mag, are readily obtainable. We have derived a series of light curves from 1964 to 1969 inclusive, with partial light curves for 1970 and 1976, and a few points from 1971. These data significantly add to the known photometric history of the star. A more complete analysis of these data will be presented later. The results from this work indicate that detailed studies of other objects using the Bamberg Observatory and other plate archives would be very worthwhile.
5 Acknowledgments
M. Tsvetkov and A. Borisova were supported by the Alexander von Humboldt Foundation under the ‘Pact of stability of South-East Europe’ programme and grants from BAS/DFG 436-BUL110/120/0-2 and the Bulgarian National Science Fund (NFS I-1103/2001). We thank the Bamberg Observatory staff for hospitality and making the archive available. We acknowledge the work of the Bamberg staff who collected the data, and archived it for later use. We used IRAF, from the US National Optical Astronomical Observatories, and OCTAVE, by J.W Eaton and colleagues, for the data analysis. This research has made use of the on–line SIMBAD data facility of the Stellar Data Centre (CDS), Strasbourg, the NASA ADS database, and the Sofia Wide Field Plate Database (WFPDB). D. Coates thanks Prof B. Muddle for access to the facilities of the School of Physics and Materials Engineering.
References
- [1] Allen C. W. 1973, Astrophysical Quantities, 3rd ed., Athlone Press, London
- [2] Bessell M., 2000, PASP, 112, 961
- [3] Bondar N.I., 1995, AA Suppl. Ser., 111, 259
- [4] Burkholder V. 1995, JAAVSO, 23, 127
- [5] Collier A.C., 1982, PhD thesis, University of Canterbury, New Zealand
- [6] ESA 1997, The Hipparcos and Tycho catalogues, ESA SP-1200
- [7] Hartmann L., Bopp B.W., Dussault M., Noah P.V., & Klimke A., 1981, Ap.J., 249, 662
- [8] Hearnshaw J.B., 1979, in Bateson F.M., Smak J., & Urch I.H., eds, Proq. IAU Colloq. No. 46, Changing Trends in Variable Star Research, Univ. Waikato, New Zealand, p.371
- [9] Houk N. & Cowley A.P., 1975. Michigan Catalogue of Two-Dimensional Spectral Types for the HD Stars, Vol.1. (University of Michigan, Ann Arbor)
- [10] Innis J.L., Coates D.W., Dieters S.W.B., Moon T.T., & Thompson K., 1983, IBVS, No. 2386
- [11] Innis J.L., Coates D.W., & Thompson K., 1997, MNRAS, 289, 515
- [12] Innis J.L., Heil P., Thompson K., & Coates D.W., 2004, Publ. ast. Soc. Aus., 21, 284
- [13] Kroll P. & Neugebauer P., 1993, AA, 273, 341
- [14] Kroll P., la Dous C., & Brauer H.–J., (eds.), 1999, Treasure–Hunting in Astronomical Plate Archives (Frankfurt am Main: Deutsch)
- [15] Lloyd Evans T., & Koen M.C.J., 1987, SAAO Circ., 11, 21
- [16] Phillips M.J., & Hartmann L., 1978, Ap.J. 224, 182
- [17] Pollard K.R., Hearnshaw J.B., Gilmore A.C., & Kilmartin P.M., 1989, JAp&A, 10, 139
- [18] Press W.H., Teukolsky S.A., Vetterling W.T., & Flannery B.P., 1992, Numerical Recipes in Fortran, Cambridge University Press
- [19] Rucinski S., 1999, in Hearnshaw J.B., Scarfe C.D., eds, IAU Colloq. 170, Precise Radial Velocities. Astron. Soc. Pac., San Francisco, p.82
- [20] Saar S.H., 1998, IBVS 4580
- [21] Schoffel E., 1964, IBVS 71
- [22] Schoeffel E., & Koehler U. 1965, IBVS 100
- [23] Slee, O.B. Nelson G.J., Stewart R.T., Wright A.E., Innis J.L., Ryan S.G., & Vaughan A.E., 1987a, MNRAS, 229, 659
- [24] Slee O.B., Nelson G.J., Stewart R.T., Wright A.E., Jauncey D.L., Vaughan A.E., Large M.I., Bunton J.D., Peters W.L., & Ryan S.G., 1987b, PASA, 7, 55
- [25] Stellingwerf R.F. 1978, ApJ, 221, 661
- [26] Strohmeier W., 1967, IBVS, No.178
- [27] Strohmeier W. & Mauder H. 1969, Sky. Tel., 37, 10
- [28] Vogt N., & Kroll P., 1999, in Kroll P., la Dous C., & Brauer H.–J., eds., Treasure–Hunting in Astronomical Plate Archives, Deutsch, Frankfurt am Main, p.210
- [29] Young A.T., 1974, in Carleton N., ed, Methods of Experimental Physics, Vol 12, Astrophysics; Part A: Optical and Infrared, Academic, New York, p.185
- [30] Young A.T., Genet R.M., Boyd L.J. et al. 1991, PASP, 103, 221
- [31] Young A.T., Milone E.F. & Stagg C.R. 1994, AA Suppl. Ser., 105, 259