A new photometric technique for the joint selection of star-forming
and passive galaxies at 1
Abstract
A simple two color selection based on -, -, and - band photometry is proposed for culling galaxies at in -selected samples and classifying them as star-forming or passive systems. The method is calibrated on the highly complete spectroscopic redshift database of the K20 survey, verified with simulations and tested on other datasets. Requiring allows to select actively star-forming galaxies at , independently on their dust reddening. Instead, objects with and colors include passively evolving galaxies at , often with spheroidal morphologies. Simple recipes to estimate the reddening, SFRs and masses of -selected galaxies are derived, and calibrated on galaxies. These galaxies have typical stellar masses , and sky and volume density of arcmin-2 and Mpc-3 respectively. Based on their UV (reddening-corrected), X-ray and radio luminosities, the –selected star-forming galaxies with turn out to have average , and median reddening . This SFR is a factor of 10 higher than that of dusty EROs, and a factor of 3 higher than found for UV selected galaxies, both at similar limits. Besides missing the passively evolving galaxies, the UV selection appears to miss some relevant fraction of the star-forming galaxies with , and hence of the (obscured) star-formation rate density at this redshift. The high SFRs and masses add to other existing evidence that these star-forming galaxies may be among the precursors of early-type galaxies. A V/Vmax test suggests that such a population may be increasing in number density with increasing redshift. Theoretical models cannot reproduce simultaneously the space density of both passively evolving and highly star-forming galaxies at . In view of Spitzer Space Telescope observations, an analogous technique based on the photometry is proposed to complement the selection and to identify massive galaxies at . By selecting passively evolving galaxies as well as actively star-forming galaxies (including strongly dust reddened ones), these color criteria should help in completing the census of the stellar mass and of the star-formation rate density at high redshift.
Subject headings:
galaxies: evolution — galaxies: formation — galaxies: high-redshift — cosmology: observations — galaxies: starburst1. Introduction
Tracing and understanding the history of cosmic star formation and the growth of the cosmic stellar mass density are currently the objects of major observational efforts (e.g., Dickinson et al. 2003; Fontana et al. 2003; Rudnick et al. 2003), yet much remains to be done before reaching fully satisfactorily conclusions. Obtaining a complete census of the populations of high-redshift galaxies, and their physical characterization (stellar mass and star-formation rate, SFR) is necessary to observationally map the processes that lead to galaxy formation and evolution. This requires direct spectroscopic identification (e.g., Fontana et al. 2004; Glazebrook et al. 2004), but building large samples of spectroscopically confirmed galaxies at high redshift is a time consuming process. This is especially true for magnitude-limited samples, as high- galaxies represent a small fraction of the galaxy counts at faint magnitudes in the optical and infrared bands. Therefore, techniques for pre-selecting high redshift targets are required to focus the spectroscopic multiplex capability on the interesting objects. Photometric redshifts from deep multicolor datasets offer an alternative to massive spectroscopic efforts (e.g. Bolzonella et al. 2002; Firth et al. 2002; Poli et al. 2003), but the results may suffer from biases that are difficult to quantify, and their accuracy depends critically on the quality of the photometry and the colors and redshifts of the objects.
An efficient alternative to either photometric redshifts or magnitude limited surveys is offered by simpler single or two-color criteria, then followed by targeted spectroscopy. The best known example is the dropout technique for selecting Lyman-Break Galaxies (LBG, Steidel et al. 1996; 2003) from their rest-frame UV colors, which opened the research field on normal star-forming galaxies at . Recently, the same technique has been extended to work at lower redshifts (Erb et al. 2003; Adelberger et al. 2004) and large samples of UV-selected objects have been spectroscopically confirmed at (Steidel et al. 2004).
Star forming galaxies can be selected as LBGs only if they are UV bright (i.e. actively star forming) and not heavily reddened by dust. Currently, the best possible alternatives to find dust-enshrouded high redshift star-forming objects include detecting them from their far-IR or sub-mm emission due to cold dust (Franceschini et al. 2001; Smail et al. 2002; Champan et al. 2003), observing the emission at X-ray or radio wavelengths that are not extincted by dust (e.g., Norman et al. 2004; Haarsma et al. 2000), and selecting very red objects in near-infrared samples that are less affected by dust extinction (Cimatti et al. 2002a, 2003).
Besides targeting star-forming galaxies, color criteria have also been used to search for passively evolving galaxies at high redshifts. A simple criterion is the one used for Extremely Red Objects (ERO), selected according to their very red optical to near-IR colors, e.g. or (Thompson et al 1999; Daddi et al. 2000a; 2000b; Firth et al. 2002; Roche et al. 2002; 2003; Miyazaki et al. 2003; McCarthy 2004). Spectroscopy showed that EROs include both old passive galaxies at and dusty star-forming systems at similar redshifts (Cimatti et al. 2002a, 2003; Yan et al. 2004). The bulk of EROs, however, is made of galaxies at redshifts with only a small fraction being at , a crucial redshift range for the evolution of galaxies. In order to identify old stellar systems at or beyond, color criteria based on and imaging have been proposed (e.g., Pozzetti & Mannucci 2000; Totani et al. 2001; Franx et al. 2003; Saracco et al. 2004). As confirmed by van Dokkum et al. (2003), objects with red spectral energy distributions at , can be selected requiring very red colors (Vega scale).
Although the selection of objects with extremely red colors has been quite successful, one could expect that moderately old, or moderately reddened, objects exist at high redshift that would be missed by both the “red-color” techniques and by the UV techniques. In addition, it appears unsatisfactory to use so many different color criteria in order to build representative samples of galaxies as a function of redshifts, as the physical relations between these different classes remain unknown, and the selection biases not fully understood.
The recently completed K20 survey (Cimatti et al. 2002a,b,c; Daddi et al. 2002; Pozzetti et al. 2003; Fontana et al. 2004) has reached an unprecedented spectroscopic completeness () for a sample of galaxies. In particular, for one of the two K20 fields (included in the CDF-S/GOODS-S field) the recent deep observations (Daddi et al. 2004, hereafter D04; Cimatti et al. 2003, 2004; Vanzella et al. 2004111Publicly available ESO observations obtained as part of the GOODS project: http://www.eso.org/science/goods/) allowed to reach a spectroscopic completeness of . This includes the presence of a significant fraction of high redshift, , galaxies (redshift desert coverage).
In this paper we take advantage of the K20 spectroscopic sample to define a simple two-color criterion based on the -, - and -band photometry which, with a minimal contamination from lower redshift galaxies, is capable of identifying the full range of high-redshift galaxies in our -selected sample, including both actively star-forming (D04) and old passive objects (Cimatti et al. 2004), and to distinguish between the two classes.
For galaxies identified with this criterion (at least to ) it is found that a -band selection is close to a galaxy stellar-mass selection, while a -selected sample of star-forming galaxies allows to reach completeness down to a given star-formation rate limit almost independently of dust reddening. Therefore, the technique offers a powerful tool to explore with the minimum possible biases the histories of cosmic star-formation and cosmic stellar-mass build-up at . We discuss in detail to which extent the cosmic stellar-mass and star-formation rate density can be estimated with the properties of galaxies in the proposed two-color diagram. The X-ray and radio properties of -selected star-forming galaxies are also investigated in order to provide an independent estimate of their star-formation rates.
The paper is organized as follow. The spectroscopic and imaging datasets used in the paper are described in Section 2. The selection and classification technique for galaxies is empirically calibrated in Section 3, checked against stellar population models in Section 4 and compared to HST morphological classification in Sect. 5. The SFR and mass content of galaxies are described in Section 6 and 7, together with methods to obtain ensemble averages from the photometry alone. Section 8 compares the samples selected with the technique to those of other criteria, including UV selected galaxies, EROs and red galaxies. We extend the technique for use at higher redshifts using Spitzer Space Telescope (SST) imaging in Section 9. The results are discussed in Section 10 and summary and conclusions are in Section 11.
We use the Salpeter IMF extending between 0.1 and 100 and a WMAP cosmology with , and [km s-1 Mpc-1].
2. The data
2.1. The K20/GOODS Field
The K20 survey has obtained spectra for objects selected in the -band over two widely separated fields for a total area of 52 arcmin2, including a 32 arcmin2 region of the GOODS-South field (Cimatti et al. 2002b). Of the 347 objects with in this area, 328 have been spectroscopically identified at the moment by complementing the K20 spectroscopy with a few additional redshifts from the ESO/GOODS public spectroscopy (Vanzella et al. 2004). The identified targets include 292 extragalactic objects and 36 stars, while the residual 19 objects have only photometric redshifts. Among these 311 galaxies, 19 have (6% of the sample) and 13 have , or lie at an estimated redshift beyond 1.4. As already pointed out in previous K20 papers (Cimatti et al. 2002c; D04), no K20 galaxies were expected to lie at these high redshifts () based on current semi-analytical models of galaxy formation.
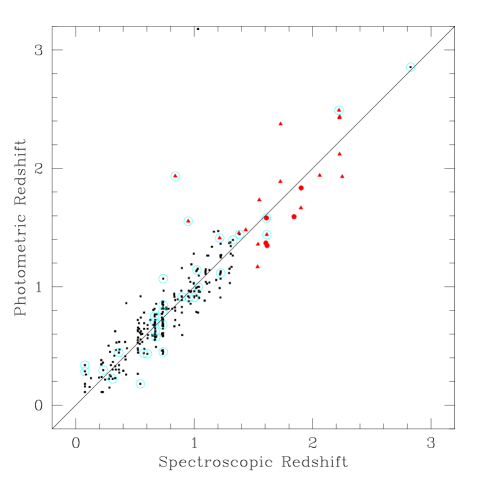
In addition to spectroscopy, deep and high quality imaging and photometry is available for this field, including ground-based imaging with very good seeing (generally 0.4–0.7′′) obtained with FORS1, FORS2 and ISAAC at the VLT (the same imaging dataset used in D04), together with the HST+ACS data released by the GOODS Team (Giavalisco et al. 2004). Shallower -band imaging from Arnouts et al. (2001) was also used, obtained at the ESO 2.2m telescope. Photometric redshifts were computed for all galaxies with hyperz (Bolzonella et al. 2000) using the available multiwavelength photometry. These are updated with respect to D04 and Cimatti et al. 2002 because of the inclusion of the final ACS photometry () from GOODS. Fig. 1 shows the comparison of these photometric vs. the spectroscopic redshifts.
The -, - and -band photometry, on which most of the paper is focused, is based on the Bessel -band, F850LP -band and the -band, (referred to as the band in the rest of this paper). The F850LP zeropoint was rescaled to match the photometry of the -band imaging based on VLT+FORS1 Gunn- filter, that is considerably less deep than the GOODS -band imaging. No color term was considered given the overall similarity of the two -band filters whose effective wavelengths differ only by about 1%. Our ground based VLT Bessel -band imaging is instead significantly deeper than the GOODS ACS imaging with F435W when measuring on apertures comparable to the size of the K20 galaxies. The -band data was obtained with VLT+ISAAC. Fig. 2 shows the total efficiency of the photometric systems as a function of wavelength. In order to allow a fine tuning of the photometry of objects from surveys using slightly different filter sets we make publicly available222http://www.arcetri.astro.it/k20/releases/ the and magnitudes of the stars identified in the GOODS area of the K20 survey. By matching the colors of the stellar sequence to the K20 one, it is possible to accurately apply the selection criteria described in Section 3.

In addition to optical-IR data, the publicly available deep 1 Msec Chandra X-ray observations of the area (Giacconi et al. 2002), and deep VLA radio maps (Kellermann et al. 2004), are used. Some details on the properties of the radio data and data analysis methods were summarized in Cimatti et al. (2003).
2.2. The K20/Q0055 Field
The K20 spectroscopic dataset from the 19 arcmin2 area centered on the QSO 0055-269 at (Q0055 hereafter) was also used as a valuable additional sample (Cimatti et al. 2002b). The spectroscopic completeness in the area is lower (89%). Of the 198 objects, 176 have a spectroscopic redshift identification at the moment, including 167 extragalactic objects and 9 stars. Of these, 13 lie at (8% of the galaxies) and 12 have , for a total of 15% expected at . The imaging (described in full detail in Cimatti et al. 2002b) has worse seeing (generally ) and is shallower than in the K20/GOODS area, as the data were mainly obtained at the ESO NTT 3.5m telescope (with SUSI2 and SOFI instruments), except for the Gunn -band obtained with the VLT+FORS1 which has a similar depth and seeing to the one of the K20/GOODS area (although shallower than the ACS -band imaging). For the above reasons, the photometry is less accurate for this field. In particular for the bands it turns out that in general the galaxies still have very good photometry in the - and -bands but the reddest galaxies have quite poor -band photometry in the Q0055 field, as the 5 limits in the photometric apertures are and AB magnitudes for the K20/Q0055 and K20/GOODS regions respectively. X-ray, radio and HST data are not available for this field.
3. Near-IR color selection and classification of galaxies
3.1. The Criterion
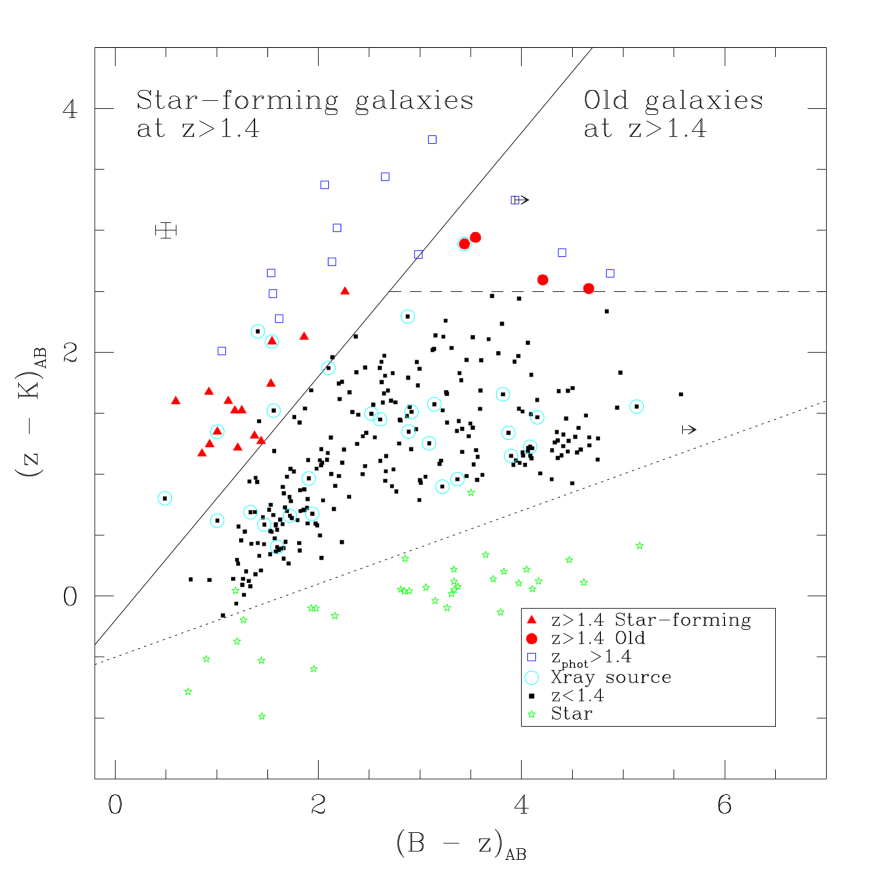
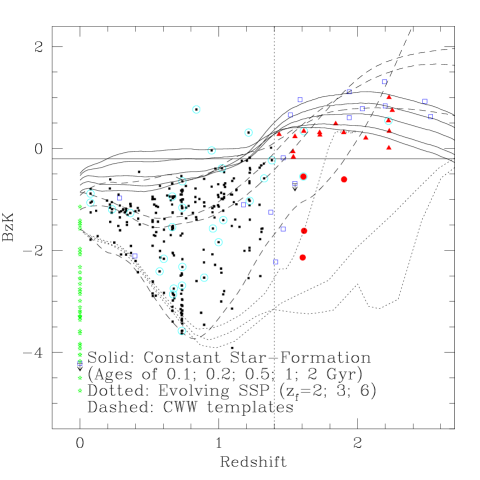
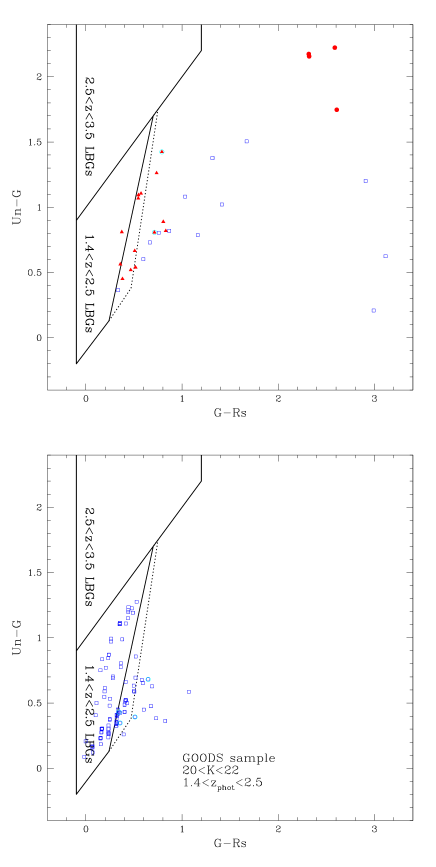
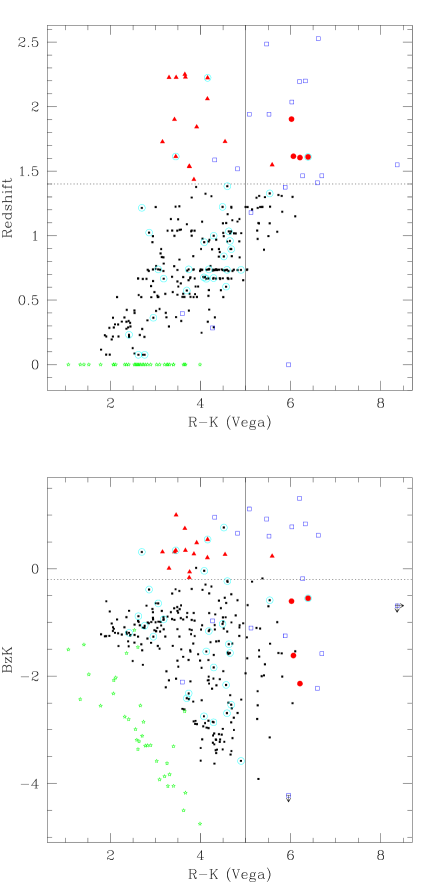
Fig. 3 shows the vs. colors of the 311 galaxies and the 36 stars in the K20/GOODS sample. The classification of galaxies at as star-forming objects relies on [OII] emission (), while those at have UV spectra showing the typical features of star-forming galaxies including e.g. the CIV absorption system at 1550 Å (D04, De Mello et al. 2004). It is found that star-forming galaxies occupy a narrow range and well defined region in this plane, well separated by lower redshift galaxies, with the bluest color at fixed . By defining:
| (1) |
it follows that star-forming galaxies are all selected by the criterion:
| (2) |
i.e., to the left of the solid line in Fig. 3. In Fig. 3 are also marked the spectroscopically confirmed passive systems at . The classification of these old galaxies relies on the detection of significant continuum breaks and absorption features in the rest-frame 2500–3000 Å region (Cimatti et al. 2004). Being the reddest objects in both and colors, old stellar systems at can also be readily isolated in a BzK diagram using:
| (3) |


All objects with are also selected by the above criteria, as evident from Fig. 3. Thus, the overall -selected sample includes 25 star-forming galaxies at having (15 and 10 ) and 7 old galaxies at having and (4 and 3 ). The above criteria are therefore quite efficient in singling out galaxies, as the lower redshift interlopers are only 13% of the resulting samples, i.e. 5 objects (including 3 Chandra sources at and 2 star-forming galaxies at ). It is not unexpected that X-ray luminous objects, i.e. AGN, may contaminate these samples as a similar selection technique to the one devised here was proposed to identify luminous QSOs (Sharp et al. 2002). A QSO at (not highlighted in Fig. 3) is instead not selected by the method. Stars have colors that are clearly separated from the regions occupied by galaxies (and in particular by those at ), and can be efficiently isolated with the criterion: (dotted diagonal line in Fig. 3).
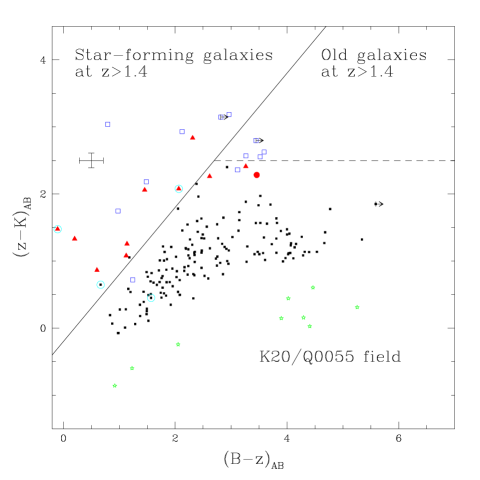
The Q0055 dataset was used as an independent verification for the validity of the selection. Fig. 4 shows the resulting versus diagram analogue to Fig. 3. Also in this field 18/23 of the galaxies with either spectroscopic or photometric redshift are selected by the method. A few objects remain marginally out of the selection regions. Most of these have either or very poor -band photometry and all are consistent with lying in the selection regions within 1–. Comparison of Fig. 3 and 4 clearly shows that the objects in the region are more scattered out in the K20/Q0055 field than in the K20/GOODS area because of the worse quality of the photometry. Two objects, including a galaxy and an AGN at (not highlighted in Fig. 4), are not selected by the criteria, that appear to have its main efficiency at , as justified from modeling in Section 4. The contamination from low-redshift galaxies is also here quite reduced. There are 2 objects having that lie at and result to be a star-forming galaxy and an AGN at . The criteria appear quite successful on the Q0055 dataset as well, once accounting also for the overall lower quality of the dataset, as discussed above.
These criteria thus allow a very efficient and highly complete selection of the 55 galaxies with either spectroscopic or photometric redshift in the K20 survey. The 57 galaxies selected with the criteria to correspond to a surface density of about arcmin2 and have a redshift distribution mainly spread over (see Fig. 5).
3.2. -selected Galaxies in the GDDS and GOODS Fields
The selection was applied to other available samples in order to further verify its validity and test it at magnitudes fainter than .
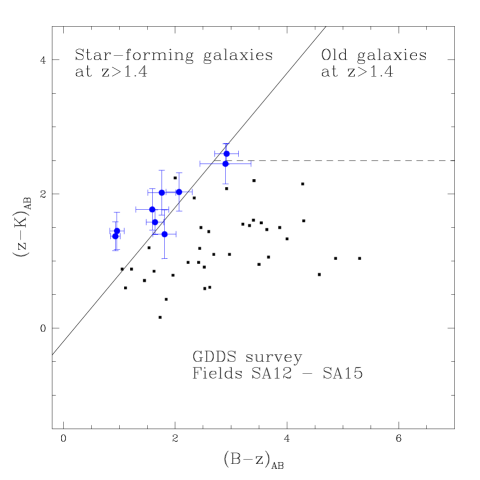
The Gemini Deep Deep Survey (GDDS; Abraham et al. 2004) performed spectroscopy of galaxies selected to (Vega). They spectroscopically observed a fraction of their -selected sample favoring the objects with the redder colors. Two of the GDDS fields (SA12 and SA15) have photometry. After converting the GDDS and band photometry from Vega to AB scale, Fig. 6 shows that 7/9 GDDS galaxies with can be selected with the technique, with only two contaminants from . Two galaxies with are just outside the selection regions. The photometric errors in the magnitudes in such a catalog are on average significantly larger than for the K20/GOODS galaxies with . Within the errors, also the two outliers are consistent with the criterion.
As a further check, the galaxies within the deep ISAAC imaging of GOODS were considered at depths and up to , i.e. two magnitudes fainter than reached by the K20 survey, for the same 32 arcmin2 region covered by the K20 survey. Only the objects with well determined SEDs were included, requiring errors smaller than 0.3, 0.15, 0.15 mags for the -, -, and -bands, respectively. This ensures reasonably reliable photometric redshift determinations, that were obtained using hyperz in a similar way as for the brighter K20 galaxies and using the same imaging datasets. The colors of the 125 galaxies selected to have are shown in Fig. 7, where they indeed concentrate in the region with . About % of them are just marginally outside the selection region. No red, passively evolving galaxies and very few red galaxies are identified in the sample, most likely because of the adopted, stringent criterion on the photometric errors. Fig. 7 also shows that the photometric redshift distribution of the 159 galaxies selected with the criteria (for a lower limit to their sky density of arcmin-2 at ) is indeed centered at . Only about 10% of the galaxies are at , while 15% of them has . The galaxies in the deep samples of Fig. 7 have a median of .
These two checks are satisfactory and support the idea that the method is valid also for samples selected at magnitudes somewhat fainter than . Such a validity should be further tested with future surveys.

4. Stellar population modeling
Bruzual & Charlot (2003) stellar population synthesis models were used to further elucidate the physical meaning and the validity of these, phenomenologically established, criteria.
4.1. Galaxy Models in the Diagram
The top-left panel shows the location of constant star-formation (CSF) models, computed for ages from to 2 Gyr, , various levels of reddening (using the Calzetti et al. 2000 extinction law), and solar metallicity. The figure confirms that galaxies in such a redshift range with ongoing star formation are indeed expected to lie in the region of the diagram. The duration of the star-formation (age) has little influence on the color, while increases with age, an effect due to the development of strong Balmer/4000 Å breaks falling beyond the -band for . Very young bursts with age less than 10 Myr (and no underlying older stellar populations) would be located just below the threshold. Galaxies with similar properties are not present in the K20 database () and are at most only a minority in the GOODS photometric redshift sample to (Fig. 7). In order to include also such objects one should formally require . In the K20 sample, this would increase significantly the contamination by galaxies.
The reddening vector is virtually parallel to the limiting line, implying that dust affects the and colors by the same amount for galaxies. This appears to be the reason why the criterion is successful at identifying star forming galaxies, virtually regardless of their dust reddening. It can be noticed that for the tracks lie near the edge of the diagram, where no galaxies are found in the K20 sample (see Fig. 3), suggesting that purely unreddened, star-forming galaxies are rare at least in a -selected sample at the relatively bright limit. Instead, in the sample from GOODS (Fig. 7), some fainter objects start to occupy also the region with .
The top-right panel of Fig. 8 shows the location of simple stellar population (SSP) models in the diagram, for ages of 0.1 to 2 Gyr, no reddening, and solar metallicity. For young ages () Gyr the tracks are marginally redder but similar to those of star-forming galaxies. As ages grow to Gyr the tracks occupy the region where passive galaxies are detected, as expected. There is an intermediate age regime at Gyr for SSP models in which such objects would be missed by both criteria of Section 3 for . SSP models with young ages (i.e. comparable to the duration of major star formation events in real galaxies) and no reddening might be an unrealistic schematization, as real young galaxies are likely to be to some extent still star-forming and dust-reddened.
As a more reasonable rendition and in order to explore the redshift and aging effects, some evolutionary models were computed with star formation histories more extended in time, as described in Daddi et al. (2000b). Left-bottom panel of Fig. 8 shows the colors in for galaxies with various formation redshifts and exponentially declining SFRs ( and 1 Gyr), with no reddening and solar metallicity. For high formation redshifts () the implied color evolution at is such that objects move directly from the star-forming galaxy region () to the passive galaxy region ( and ) without crossing the bluer regions populated by objects.
The last panel of Fig. 8 finally shows that the color of normal galaxies at , computed using the Coleman et al (1980) templates of E-Sbc-Scd-Irregular galaxies, are indeed expected to fall outside the range defined for and bracket quite well the range of colors observed for K20 galaxies at (see Fig. 3). This additional test strengthens the validity of the selection to isolate galaxies at .
4.2. Modeling versus Redshift
The key quantity in the selection and classification of galaxies is the term defined in Eq. 1. Fig. 9 shows the evolution as a function of redshift for the CSF models described above. Objects with start to appear in significant numbers only beyond . The CSF models enter the region at , although models with ages of 1–2 Gyr can marginally fulfill the condition even at much lower redshifts. CSF models evolve out of the region at –3.2, depending on age, because the Ly forest starts entering the -band at those redshifts, thus producing a reddening of the colors. Also shown in the figure are colors expected for passively evolving (SSP) galaxies formed at , 3 and 6, and templates of local galaxies (Coleman et al. 1980). Again, one notices that in general passively evolving galaxies are contaminating samples only for very young ages close to the formation redshift. The Coleman et al. (1980) templates bracket the color range observed for galaxies, as well as that of higher redshift galaxies (although they have too old stellar populations to be truly representative of galaxies).
4.3. The Effects of Metallicity and Extinction Laws
We also explored the effects of using alternative choices for the metallicity and the extinction law. Models with metallicity significantly below solar seem inappropriate even for star-forming systems with , as these objects show deep photospheric absorption spectra indicative of solar or higher metallicity (De Mello et al. 2004). Old systems are consistent with being fully assembled spheroids, that are known to have nearly solar or higher metallicity today. We checked that using above-solar metallicities the CSF galaxy tracks are basically unchanged, while the tracks of passive galaxies change according to the well known age/metallicity degeneracy. We also investigated the effect of using extinction laws other than that of Calzetti et al. (2000). Using the extinction law proposed by Silva et al. (1998) yields results fully consistent with those obtained above with the Calzetti et al. law. The SMC extinction curve produces a higher reddening to the color than to the color, so that for very high reddening () the model tracks would enter the region of passive galaxies. However, with the SMC extinction law the colors of the reddest galaxies with are difficult to reproduce.
4.4. The Nature of the Reddest Galaxies with
Most of the K20 galaxies with no spectroscopic redshift available and have very red colors and (Fig. 3), qualifying thus as star-forming galaxies based on the proposed classification criteria. The top-left panel of figure 8 confirms that such objects are fully consistent with being heavily reddened, star-forming galaxies. Their full multicolor SEDs cannot generally be fitted by models for old/passive galaxies with no star-formation and reddening, implying that some amount of young-hot stars is required for them to show the relatively high -band fluxes and blue colors. This is quite reasonable, as they appear to follow the trend of increasing reddening for the spectroscopically established star-forming galaxies at . Nevertheless, some of the objects in that region may actually be post-starburst galaxies, having passed their strongest episode of star-formation, in which case part of their red colors could be due to an aged burst of star-formation (see bottom-left panel of Fig. 8). Additional evidence that, typically, these are indeed actively star-forming galaxies will be derived from their average X-ray and radio properties in Section 6.2.
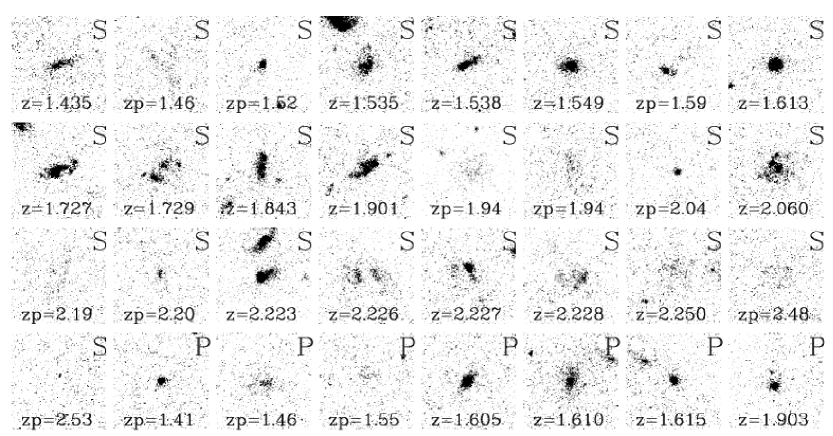
5. HST/ACS Morphology of the Galaxies
HST imaging provides a fundamental complement to investigate the nature of the galaxies and to elucidate their evolutionary status. In Fig. 10 ACS z-band imaging of the galaxies in the K20/GOODS sample are presented. The -band is centered at rest-frame wavelengths from 2500 Å to 3700 Å for the objects in . Objects with appear generally irregular/merging-like and have very large sizes, with an average half-light radius of about 6 kpc at (D04). Objects with and have instead generally a compact and regular morphology. With only a few exceptions, there is a very good agreement of the early-type/late-type morphological appearance with both the color classification and with the spectroscopic classification as passive or star-forming galaxies. This supports the evidence that the criteria allow to efficiently isolate high redshift galaxies in a -selected sample and to distinguish passive and star-forming objects.
6. Star-formation Rates
The critical question is then to investigate the level of star formation activity present in the (star-forming) galaxies. This is done in this Section where we measure the SFRs of galaxies at in the K20/GOODS region (hence with ), selected and classified as star-forming with the criterion , and we explore whether the photometry alone can still provide an estimate of the SFRs of these galaxies.
6.1. SFRs from the Rest-Frame UV-Continuum Luminosity
Estimating the SFR of a galaxy from its multicolor optical photometry is generally based upon relations between the intrinsic UV continuum luminosity and SFR (e.g. Madau et al. 1998) and estimating the extinction by dust, necessary to derive the intrinsic UV continuum luminosity from the observed one. Both steps are in general quite uncertain and rely on assumptions about star-formation history, dust reddening law, metallicity (as well as on the IMF, fixed to Salpeter between 0.1 and 100 in this work, but in a way that is generally easy to factor-out so that the results can be easily scaled to other choices of IMF).
Neglecting any reddening correction, the SFRs are of order of –40 yr-1 for the spectroscopically confirmed galaxies (D04), and even smaller for the reddest ones with only photometric redshifts. As well known, such estimates are severely affected by dust extinction. In this section, we attempt to infer the level of dust reddening from the photometric properties, limiting this analysis to the case of CSF models with solar metallicity and a Calzetti et al. (2000) extinction law (as already done in D04). These assumptions appear reasonably justified for our galaxies, as discussed in Section 4, and allow a comparison with a broad variety of literature work based on the same assumptions.
With the above assumptions and following the approach of D04, best-fitting SFRs and have been derived for the 24 purely star-forming galaxies with in the K20/GOODS area, from their full observed SED from to (an object with AGN signatures in the spectrum and high X-ray to optical luminosity ratio has been excluded from the SFR analysis). The derived SFRs are typically in 100–600 yr-1 and the reddening range is .
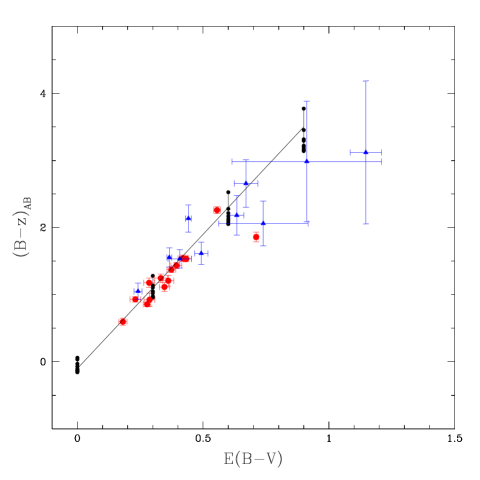
Then, we have explored if, within the same assumptions, the photometry alone could allow an estimate of the SFR content of the 24 galaxies equivalent to the one derived from SED fitting. At the -band samples quite well the rest-frame ultraviolet at Å (actually, the rest-frame 1250–1800 Å range for ), and the UV luminosity at 1500 Å of a star-forming galaxy is a calibrated measure of the ongoing SFR (e.g. Madau et al. 1998). Fig. 11 suggests that estimated from SED fitting (and with the knowledge of the galaxy redshift) correlates very well with the observed color (see also Fig. 8, top left panel), following the relation:
| (4) |
that indeed for the models and assumptions described above holds as an average over redshift and age. The rms dispersion of the residuals is only 0.06 in for the objects with measured spectroscopic redshift (mainly due to a single outlier, with dispersion dropping to 0.026 with such object removed), and the relation still holds quite well also for objects with photometric redshift only. This tight relation between and is related to the assumption of the ”grey” and self-similar Calzetti et al. (2000) extinction law and to the fact that the UV shape of CSF models has little dependence on age.
The observed flux at 1500 Å rest-frame, de-reddened using Eq. 4, can be used to estimate the 1500 Å luminosity once the redshift is known. For the BC03 models this can be converted into a SFR using the relation:
| (5) |
For objects lacking a spectroscopic (or even photometric) redshift identification, this conversion can be done only assuming an average redshift for the sample galaxies. For individual objects, if they lie at lower (higher) redshift than the average both the luminosity distance and 1500 Å luminosity (based on just the observed -band flux) will be overestimated (underestimated), typically by factors up to . However, this procedure would still allow to derive a fairly correct ensemble average of the SFR in the survey when a statistical sample of galaxies is considered together.
With the above recipes we have derived a color estimate of the SFR of each galaxy in the following way: 1) the observed -band flux is used as a measure of the 1500 Å UV continuum flux; (2) is derived from the observed color as in Eq. 4; and (3) the average redshift of the sample is used for all objects to derive the SFR following Eq. 5.
For the 14 K20 star-forming galaxies with , the SED fitting and the simple color estimates described above are all in agreement within a factor of 2, given our range of redshifts, with a rms fluctuation of only 20%. The total SFR from the 14 galaxies results to be 3600 yr-1 from SED fitting and 3400 yr-1 with the -based estimate, in excellent agreement between them and indicating a quite high average SFR yr-1 for these galaxies. The SFRs derived for objects with only photometric redshifts are more uncertain, but also in that case the agreement among the two estimates is reasonable. The SFR estimated for the 10 galaxies with and (likely star-forming galaxies with high reddening) is yr-1 in total, corresponding to SFR yr-1 per object. Averaging over the two samples yields SFR yr-1 for the typical objects among this population of -selected starbursts.
These results show that, within the assumptions made, the total SFR content of galaxies can be estimated from the photometry alone with an accuracy similar to that reachable by fitting to the whole SEDs with known spectroscopic redshifts. However, we notice that assuming exponentially declining star-formation models the amount of reddening and SFR can be significantly reduced.
In order to derive more stringent clues, X-ray and radio data were also used to derive independent estimates of the SFR unaffected by dust extinction and to test the above results.
6.2. SFR from the X-ray Luminosity
Alternative measures of the SFR of galaxies can be obtained from their X-ray and radio properties, as the X-ray and radio luminosities of star-forming galaxies (with no major AGN contribution) are proportional to the SFR (e.g., Condon et al. 1992; Ranalli et al. 2003; Nandra et al. 2003). The X-ray and radio properties also offer an additional opportunity (besides optical spectra) to check for the presence of AGN contamination.
Two of the K20 objects at with are listed as detections in the catalog based on the 1 Msec Chandra Deep Field South observations (Giacconi et al. 2002). One of these is the object with AGN line optical spectrum, and we already mentioned that this was excluded from the star-forming galaxy sample. Another galaxy at with a faint soft X-ray detection is present in the sample. This is also detected as a faint radio source at 1.4 GHz and it is consistent with being a vigorous starburst with SFR yr-1 (D04).
The X-ray emission in the observed soft (0.5–2 keV) and hard (2–10 keV) bands have been measured at the position of the remaining 23 star-forming objects to check for other possible detections. No other individual detection is found above the level. The stacked X-ray signal from the 23 individually undetected sources was then obtained to constrain the average X-ray emission of the star-forming galaxies. In the soft band net counts are recovered, after background subtraction. We performed Monte Carlo simulations by placing at random positions in the X-ray image (excluding regions around known sources) and found that the chance probability of recovering such a strong signal is . The average 4.4 soft counts per objects are close to the detection limits of the 2 Msec Chandra observations in the HDF North (Alexander et al. 2003). Performing the analysis separately on galaxies with or without spectroscopic redshift identification, it is found that the two samples have not statistically different X-ray properties and both samples are positively detected at the level in the soft band. On the other hand no significant detection is found from the stacked hard band data, constraining the hardness ratio of the population to be HR at the 2-sigma level. This is consistent with the low hardness ratio expected for starbursts galaxies. AGN are found generally to have (Szokoly et al. 2004). The low average HR for our sources thus disfavors that the detected soft X-ray emission is due to low-level AGN activity. A similar conclusion is supported by the low average X-ray-to-optical flux ratio of and by the lack of AGN signatures in the spectra (see also D04). The X-ray emission is therefore most likely due to star-formation. Using appropriate for starbursts (e.g. Brusa et al. 2002), the counts correspond, for , to a rest frame 2–10 keV luminosity of ergs s-1, which translates into an average SFR yr-1 (Ranalli et al. 2003; Nandra et al. 2002). When adding back to the sample the individually X-ray detected (non AGN) object one obtains an average X-ray luminosity corresponding to an average SFR yr-1, in quite good agreement with the estimate from the reddening corrected UV luminosities and constant star-formation rate models.
6.3. SFR from Radio Luminosity
Deep radio maps at 1.4 GHz and 5 GHz (Kellermann et al. 2004) were used to measure the radio properties of the star-forming galaxies in our sample. The radio data reach rms flux densities of about 8 Jy at both 1.4 GHz and 5 GHz. Two of the star-forming galaxies are individually detected at 1.4 GHz at better than the 3 level. One of the two is the vigorous starburst with SFR yr-1 also detected in the X-ray and discussed in D04. The other object has a 1.4 GHz flux density of Jy and is therefore a detection. No individual object is detected at 5 GHz.
The average flux density of non-detections has been evaluated in a similar fashion as was done for the EROs by Cimatti et al. (2003), and using the same dataset. The radio flux densities were measured at the nominal optical position for each of the galaxies averaging the flux density in the beam (3.5′′) over a range of 1′′ radius in order to correct for possible residual coordinate mismatch. An average signal is measured of Jy at 1.4 GHz and Jy at 5 GHz, for the 22 -selected star-forming galaxies that are individually undetected both in radio and X-ray. The above flux densities do not strongly constrain the radio continuum slope , but are consistent with the value of –0.8 typical of starburst galaxies (Condon et al. 1992). For consistency with the work at of Reddy & Steidel (2004), a slope of is adopted to derive an average 1.4 GHz rest-frame luminosity of W Hz-1, corresponding to an average SFR yr-1 per object, using the relation given by Yun et al. (2004) and corrected for a binning error as in Reddy & Steidel (2004)333Reddy, private communication. Including again into the sample the two starburst galaxies detected at 1.4 GHz we obtain an average SFR yr-1 per object, again with reasonable consistency with both the optical and the X-ray estimates. Also in this case, no statistically significant difference is found for the average radio flux density of objects with or without known spectroscopic redshift.
To summarize, all the available SFR indicators agree with each other and confirm the presence of -band luminous star-forming galaxies with typical SFR yr-1 and a median reddening of (cf. D04).
7. The Stellar Mass of K-Selected Galaxies
As part of the K20 project the stellar mass of each galaxy was estimated from the known redshifts and full multicolor photometry (Fontana et al. 2004; F04 hereafter). Using the F04 results, in this section we explore the possibility of estimating the stellar-mass content of -selected galaxies at from the photometry alone.
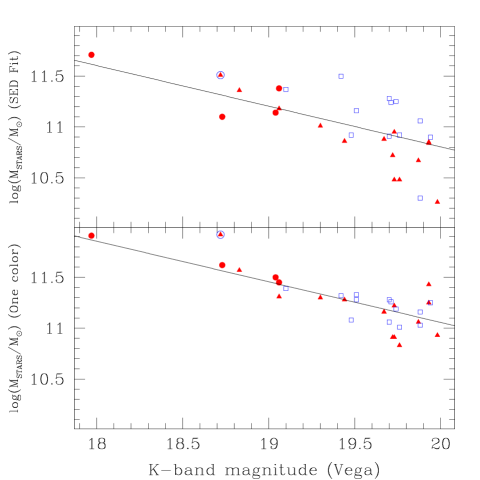
Fig. 12 shows the results of two different stellar mass estimates from F04: one based on synthetic stellar population models fitting to the whole SED, and one based on fitting just the color. The latter approach is designed to provide an estimate of the maximal mass of each galaxy (see F04). The masses estimated with the SED-fit technique are in reasonable agreement with those for the objects at analyzed in D04.
Fig. 12 shows a plot of from both methods as a function of the observed magnitude for the sample of 31 out of the 32 objects with in the K20/GOODS sample. One object was excluded because exhibiting a clearly AGN dominated spectrum. Best-fitting linear relations between the stellar-mass and the observed -band flux were obtained, in the form:
| (6) |
where is the -band magnitude corresponding on average to a mass of . For the SED fit and single-color method we find and (Vega scale), respectively.
It can be noted that at the single-color method yields masses a factor of 1.7 higher, on average, than the SED-fit technique (see also F04). The rms dispersions observed for these relations are and 0.15 for the best fit and single color method, respectively. We searched for further correlations between the residuals in the masses as derived from Eq. 6 versus the F04 values, and the colors available from the photometry. No significant trend was noticeable for the masses derived with the single-color method. Instead, the residuals in the SED fitting derived masses do positively correlate with the color, with:
| (7) |
a term that would reduce the rms dispersion to 0.20 if added to the right-hand side of Eq. 6.
These relations allow to estimate masses with average uncertainties on single objects of about 40% and 60% relative to the single-color and the SED-fit method, respectively. This is an encouragingly good accuracy, given the large intrinsic differences in the luminosity distance and actual rest-frame wavelength sampled by the observed -band, for objects within the range. Intrinsic differences in the ratio for given magnitudes and/or colors also contribute to increase the scatter. However, when averaging over large samples of galaxies these statistical fluctuations may be largely mitigated.
Note also from Fig. 12 that the stellar masses of dusty star-forming and old/passive galaxies are estimated to be on average quite similar at given observed -band magnitude. This seems to happen by chance: the star-forming galaxies have lower mass to light ratio but their -band light is attenuated by an amount which produces similar observed magnitudes to old objects with comparable stellar-masses. The mass of substantially obscured stellar populations within the galaxies would however obviously fail to be accounted for in such estimates.
8. The BK vs. Other High- Galaxy Selection Criteria
In this section, the properties of -selected galaxies at having are compared to those of samples selected according to other color or multi-color selection criteria. We will consider the selection of galaxies, the Extremely Red Objects (ERO) selection based on the threshold, and the infrared-selected galaxies found with the criterion proposed by Franx et al. (2003) to isolate evolved galaxies.
8.1. - vs. UV-selected Galaxies at
Very recently, the UV technique for selecting LBGs has been extended to using a two-color diagram which isolates star-forming galaxies at (Erb et al. 2003; Steidel et al. 2004; Adelberger et al. 2004), a redshift range fully matching that of the selection.

The UV-selection requires the UV continuum to be relatively flat, thus limiting the overall dust extinction to (Adelberger & Steidel 2000), while many of the K20 galaxies at are more reddened (see Fig. 11). We estimated how many of the galaxies at could also be selected by the UV criterion, in our sample. As no photometry is available to us for the K20 galaxies, synthetic magnitudes have been derived from the BC03 models providing the best fit to the observed SEDs, for the objects in the K20/GOODS region. Fig. 13 shows the resulting synthetic vs. colors. Of the 32 objects at in Fig. 3, only 2 (6%) would be selected by the Erb et al. (2003) criteria, and 9 (28%) by the Adelberger et al. (2004) criteria, corresponding to a surface density of about 0.3 arcmin-2. We can compare these numbers with those in the UV-selected surveys. The Adelberger et al. (2004) BM and BX criteria result cumulatively in a sky density of 9 arcmin-2 candidate galaxies (Steidel et al. 2004). Roughly 90% of these is found within and about 8% of the objects has . Based on the above numbers, we should have found galaxies UV-selectable with the Adelberger et al. (2004) criterion in in the K20/GOODS region, while only 9 are recovered. It is not clear what is the reason of this possible discrepancy, that may be in part due to small number statistics and/or to cosmic variance due to clustering (D04).
Some large fraction (perhaps as high as ) of the galaxies at fail to be selected by the UV criteria to identify galaxies at . The lost fraction includes not only the old passive systems but also a high proportion of actively star-forming, highly reddened galaxies. As a consequence, the UV-selection fails to recover most of the stellar mass in galaxies at , as expected given that it was not devised with the aim of probing the galaxy mass density, but rather the star-formation rate (Adelberger et al. 2004). However, a significant amount of the SFR density is also missed. Using the SFRs estimated from reddening-corrected UV luminosities (Section 6.1), it is found that the 9 starbursts in our sample that satisfy the criteria produce only % of the SFR density at from galaxies, with the residual being missed because of dust reddening in excess of . The missed objects include all the K20 galaxies with the most extreme starbursts with SFR yr-1.
Comparing the typical star-formation rate level per galaxy, the bright starbursts in the K20 survey appear to be forming stars more vigorously than the UV-selected not strongly reddened galaxies with (Shapley et al. 2004), with average SFRs larger by a factor of . Extending the comparison including also fainter UV selected galaxies, the radio and X-ray measurements (both in agreement with the extinction-corrected estimates based on the UV continuum), imply that the average radio and X-ray luminosities, hence the SFRs, of our star-forming objects are higher than those of the average of all UV selected galaxies (Reddy & Steidel 2004) by a factor of . The selected galaxies studied by Reddy & Steidel (2004) have a significantly higher space density than the galaxies and sample regimes with much lower SFRs.
8.2. Contributions to the Star-formation Rate Density
In this section we derive the contribution of the -selected galaxies to the integrated star formation rate density (SFRD) at , and compare it to an estimate of the SFRD derived from the UV-selected galaxies.
For the volume in the redshift range , a SFRD of yr-1 Mpc-3 is derived from the 24 K20 star-forming galaxies fulfilling the criterion (and of course ), where the error is derived from bootstrap resampling. This may well be an underestimate of the error, given the small number of galaxies used in the estimate, and to them belonging to a population likely to be strongly clustered (D04). For example, assuming that these galaxies are as clustered as –3 red galaxies ( Mpc; e.g., Daddi et al. 2001; 2003), the error would become 35% larger on the lower side and a factor of 3 larger on the upper-side.
This estimate of the SFRD contributed by the objects with is comparable to the global SFRD at as estimated from other surveys (in the same units: , Connolly et al. 1997, corrected for extinction by Steidel et al. 1999; , Heavens et al. 2004), or as predicted by CDM semi-analytical models (0.05–0.10 yr-1 Mpc-3, Somerville et al. 2001) and by CDM hydrodynamical simulations ( yr-1 Mpc-3, Hernquist & Springel 2003). However, our present estimate must be incomplete because it does not include the contributions of all the galaxies, and in particular of those still fulfilling the condition. Fig.14 shows that the SFRD is not yet converging by , and a significant additional contribution from galaxies is therefore expected.
The total SFRD produced by UV-selected galaxies at in the Steidel et al. (2004) sample has not been published yet, but a crude estimate can be derived in comparison to the star-forming galaxies at by considering that the -selected candidates down to have times higher sky density (Steidel et al. 2004), that % of them are in the redshift range covered by the selection (), and that they have times smaller average SFRs. This would yield an integrated contribution by UV-selected galaxies (with ) a factor of 2–2.5 times larger than that of bright galaxies. Hence, taking into account that some galaxies are picked by both criteria, the UV selection may miss of order of –30% of the total SFRD provided by galaxies selected by at least one the two criteria, while the criterion limited to allows to select only a similar fraction.
On a broader perspective, discussing the potentials of the two color criteria ( and ) is perhaps more interesting than comparing the existing samples drawn with them. As mentioned above, much of the limitation of the present application of the criterion actually comes from the fairly bright limiting magnitude, rather than from the color criterion itself. One may expect that applying it to fainter magnitudes a higher fraction of the total SFRD could be recovered. It is not presently known, however, if some fraction of galaxies would be missed by the criterion, especially at , where it may start loosing some very young starburst, as suggested by the top-left panel in Fig. 8. If they exist at faint magnitudes, such young galaxies could be more easily selectable in the UV. These points should be tested by future surveys444We are grateful to the referee (C. Steidel) for having informed us prior of publication that in his sample of galaxies (c.f. Sect. 8.1) the selection appears to miss a fraction of star-forming galaxies with ..
The UV-selection appears to miss the most actively star-forming galaxies not because of the limiting magnitude, but because they are much too reddened [] for satisfying the color selection. The existence of highly reddened star-forming galaxies also at would imply for the UV-selection additional losses of star-forming galaxies (hence of part of the SFRD). A preliminary analysis based on the GOODS/ISAAC sample at (Fig. 7) suggests that at star-forming galaxies with and progressively bluer colors start to appear, and occupy the bluest region where most UV-selected galaxies also lie (Fig. 13, see also Fig. 11 of Adelberger et al. 2004 for comparison). This may be consistent with a general blueing trend at fainter magnitudes, indicative of a trend to lower reddening. The fractional SFRD lost by the UV selection may then therefore decrease with increasing magnitude limit. It should be mentioned, however, that the paucity of red star-forming (as well as of passive) galaxies in the sample of Fig. 7 is at least in part due to the requirement of accurate photometry for the photometric redshifts determination and that, e.g., candidate star-forming galaxies with , , and are found also down to . In addition, a population of faint red galaxies at appear to exist even down to . They tend to be more clustered than LBGs, as expected for the precursors of early-type galaxies (Daddi et al. 2003). In summary, an application of the technique to much fainter -selected surveys could shed light on the amount of reddened star-formation at rates lower than probed by the K20 survey, and better establish the fractions of the SFRD recovered by each of the two criteria.
8.3. -selected Galaxies and Extremely Red Objects
A simple method to select relatively high redshift galaxies relies on requiring very red optical to near-IR colors, typically (e.g. Elston, Rieke & Rieke 1988; Hu & Ridgway 1994; Thompson et al. 1999; Daddi et al. 2000a; Roche et al. 2002, 2003; for a comprehensive review see McCarthy 2004). K20 survey spectroscopy unveiled for the first time the nature of EROs in a sizable sample, and showed that EROs include similar fractions of old and dusty star-forming systems (Cimatti et al. 2002a, 2003; see also Yan et al. 2004).
The redshift range is one of the main differences among the samples produced with the two and ERO methods. Fig. 15 shows that EROs with are found at , coherently with the rationale for their selection (e.g. Daddi et al. 2000a). Many K20 galaxies exist in the same redshift range that are not EROs. In contrast, the strength of the selection (Eq. 2 and 3) is that it provides a fairly complete sample of galaxies in the redshift range . The condition of Eq. 3 that allows to recover old passive galaxies is basically equivalent to the ERO criterion , apart from the higher low-redshift cutoff ( instead of . A very similar cutoff for passive galaxies would be obtained requiring , albeit with a larger contamination by both lower redshift and reddened star-forming galaxies. Fig. 15 shows that only about 50% of selected galaxies at have EROs colors, while only 35% of all the EROs are selected with the criteria, i.e. lie at .
Particularly interesting is the comparison of the physical properties of dusty star-forming EROs to those of starbursts. The two samples include a few common objects, but it appears that on average the SFR of the star-forming galaxies is one order of magnitude higher than that of star-forming EROs. Indeed, the average X-ray 2–10 keV luminosity of dusty EROs in the K20 survey with (Brusa et al. 2002) is a factor of smaller than that measured for the -selected starbursts. Similarly, the average 1.4 GHz luminosity of the same EROs is a factor of smaller than found at (Cimatti et al. 2003). As these estimates are limited to EROs with known spectroscopic redshift, they exclude the highest redshift EROs in common with the selected sample. Forming stars much more vigorously, the reddened starburst galaxies seen at appear therefore to be of a different nature with respect to dust-reddened galaxies at .
Similarly to the method proposed by Pozzetti & Mannucci (2000; PM2000 hereafter), requiring would allow to distinguish dusty EROs from the old ones, extending the diagnostic in (the PM2000 criterion is formally valid only up to ). The two criteria are however substantially different and complementary to each other: while the PM2000 criterion relies on detecting the signature of the 4000 Å break of old galaxies, the criterion aims at detecting the UV tail in the SEDs due to the youngest stars, even in the presence of substantial reddening. We verified that 8/9 of the EROs that are also star-forming galaxies at with , mostly objects with photometric redshifts only, are correctly classified as star-forming galaxies by the PM2000 criterion.
It would be extremely interesting to apply the diagnostic to EROs samples in order to statistically distinguish EROs from those at , either old or star-forming ones. This would allow to solve the long standing issue of whether the EROs overdensities observed in the field of AGN/QSO at are true spatial associations (i.e. clusters or proto-clusters) or are just due to lensing effects (e.g., Cimatti et al. 2000; Best et al. 2003; Wold et al. 2003). In case of true spatial associations one would also know if such enhancements are due to dusty star-forming or passive galaxies with important implications for galaxy formation in clusters.
Finally, we notice that the color properties of star-forming galaxies at , having blue colors and the reddest color, are fully matching those of the mysterious population of red outlier galaxies (Moustakas et al. 1997). These galaxies were found to show blue colors with respect to their large colors and their nature had remained so far unclear.
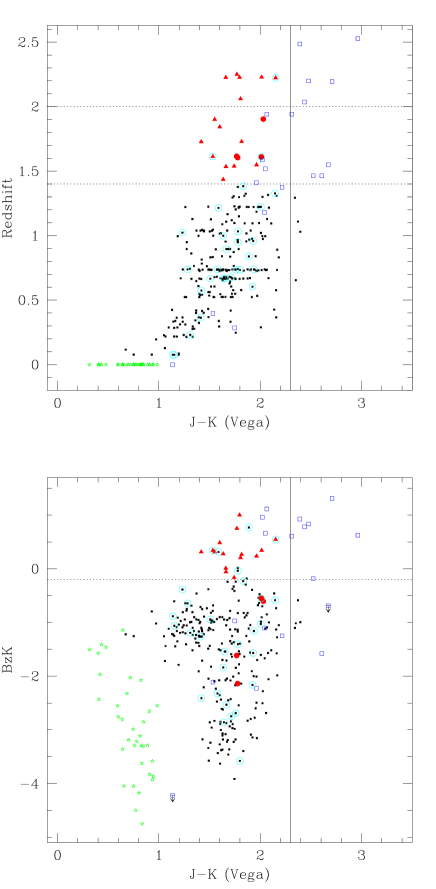
8.4. - vs. -selected Galaxies
Recently, Franx et al. (2003) have proposed the criterion to select evolved galaxies at , and spectroscopic evidence that galaxies are indeed selected by this criterion has been provided for a sample of star-forming galaxies and AGN (van Dokkum et al. 2003; 2004). Based on a single color, the criterion is similar to that for EROs (), and like this one it may eventually result to select both reddened star-forming galaxies and evolved/passive ones. The properties of galaxies in the K20 survey were then examined and compared with those recovered by the criteria. Fig. 16 shows the vs diagram and the redshift vs diagram for galaxies in the K20/GOODS region. Only 4 galaxies with have a spectroscopic redshift, and lie in the range . Additional 3 galaxies have a photometric redshift , and only 6 out of 13, of the objects, have . Therefore, it seems that the contamination of galaxies among red galaxies could be higher than in the van Dokkum et al. (2003) sample. In part this could be due to photometric errors, as the lowest contaminants have , hence close to the edge of the region. Note however that both the van Dokkum et al. spectroscopic sample and the K20/GOODS sample are quite small.
Only 9 out of 32 objects in the K20/GOODS sample at fulfill the condition, but the fraction rises to 5/11 for the galaxies. All the galaxies having and have also , and would be classified as reddened star-forming galaxies rather than purely passive systems. This agrees with the recent results by van Dokkum et al. (2004) and Förster Schreiber et al. (2004). The highest redshift passive systems at in the K20 survey (Cimatti et al. 2004) have .
In summary, it appears that the selection has the advantage of allowing in principle to recover the bulk of the galaxy population for the redshift range for which it is tuned, including the reddest and bluest ones, and to distinguish the passive from the star-forming ones. However, while the selection is efficient only up to , the criterion can allow to pick up the reddest galaxies up to much higher redshifts (Franx et al. 2003).
We finally notice that most of galaxies have (Fig. 16). At this threshold the clustering of faint -selected galaxies at was observed to become quite strong, compared to bluer galaxies (Daddi et al. 2003). This is consistent with -like galaxies contributing to such a clustering enhancement (as suggested by D04), together with the reddest galaxies.
9. Extending the Technique to Select Galaxies with Spitzer Photometry
The criterion is based on the rest-frame colors of (reddened) star-forming and (unreddened) passive galaxies, and then tuned to select those at . Therefore, by choosing a different set of bands that sample the same rest-frame wavelengths one can forge a new criterion tuned to select the same kind of galaxies at a higher redshift.
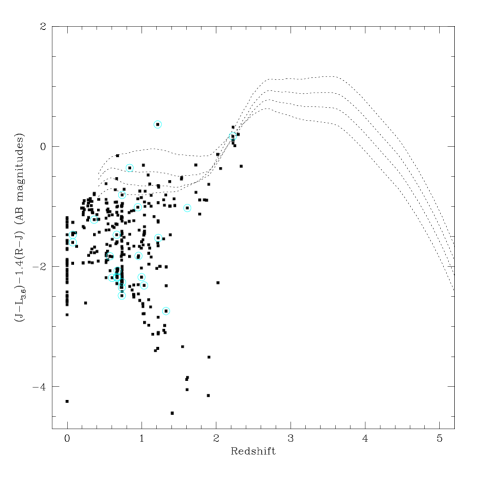
By multiplying by 1.5 the central wavelengths of the bands one obtains values that roughly correspond to the central wavelengths of the bands, and correspondingly a criterion based on the quantity:
| (8) |
can be used to select galaxies in the redshift range , i.e., complementary to the criterion that can select galaxies up to . The quantity has its peak for star-forming galaxies in the above redshift interval, again due to the Balmer break being located between the and -band at 3.6 m. Given that the ratio of the central wavelengths of the bands to the ones is not exactly constant, a factor in Eq. 8 is necessary to make reddening independent in (using the reddening law of Calzetti et al. 2000). Model tracks for the versus colors in the range are nearly identical to those for the versus colors in , already discussed in Section 4 and shown in the panels of Fig. 8. By requiring one should thus in principle cull –4 star-forming galaxies in -band limited samples, independently on their reddening, while objects having and –2.5 should turn out to be passive objects at (if such a population of galaxies exists). As a consistency check, synthetic -band magnitudes were extrapolated for K20 galaxies from their best fitting SEDs to test for contamination by galaxies in selected samples, that results to be small (Fig. 17), though the K20 sample does not cover the redshift range that should be sampled by the criterion. A few galaxies in the K20 sample start to show following the models trend. A possible problem of this selection technique might be contamination by low redshift (e.g. ) galaxies that could arise if significant contribution by dust (e.g. from AGN) is starting to appear in the -band. No contribution of this kind was considered in the derivation of synthetic -band magnitudes. It is unclear how often this can happen for faint low-redshift galaxies. Filtering of low-redshift interlopers may be desirable for the application of this technique if the above contamination should result to be relevant.
If placed at a typical star-forming galaxy in the K20 survey would have –23 (AB). This is much brighter than the limits that should have been reached by the GOODS-SST observations at 3.6 m (Dickinson et al. 2002). As an example, for at one expects colors and , implying the need to reach quite faint magnitudes in the optical/near-IR in order to detect such galaxies, i.e., –28 and –26 (AB scale magnitudes). A first check of this criterion should be possible with the GOODS ACS+ISAAC+SST dataset, that is expected to be deep enough in all the bands. In particular, it will be possible to test whether galaxies exist in the range that are picked up by the selection but missed by the UV-selection, in analogy to what found for the selection.
10. Discussion
10.1. Early-Type Galaxies in Formation
The masses of the galaxies in the K20 survey are overall quite high, with a median of , and in the local universe objects with such high masses are almost uniquely found among early-type galaxies. In D04 we had in fact suggested that the properties of -selected galaxies at are consistent with those expected for the star-forming precursors of massive spheroids. This was also supported by the high SFRs, large sizes, merging-like morphologies and strong redshift space spikes that hint for strong clustering. Additional evidence in this direction comes from their strong photospheric and interstellar lines, indicative of solar metallicity or above, typical of massive spheroids (de Mello et al. 2004).
The properties of the -selected galaxies with suggest that there is a whole population of vigorous starbursts within the range that can qualify as spheroids in the making. Such properties are quite different from those of star-forming galaxies at lower redshifts, e.g., the SFRs are times higher than those of dusty EROs, which in turn may be much less strongly clustered than -selected galaxies (Daddi et al. 2002, 2004).
High redshift dusty star-forming galaxies selected at submm/mm wavelengths (see Blain et al. 2002 for a review) are often considered as the precursors of the present-day massive spheroids. Although a detailed comparison between -selected and submm/mm-selected galaxies is beyond the scope of this paper, we notice that the latter systems have a redshift distribution largely overlapping with that of the former ones (median redshift of ; Chapman et al. 2003), even higher SFRs (Blain et al. 2002), similarly high masses (Genzel et al. 2003) and possibly similarly high clustering (Blain et al. 2004). However, the space density of submm/mm-selected galaxies is a factor of 10–100 lower than that of the -selected ones. Submm/mm sources may be extreme subsets of galaxies.
10.2. Entering the Spheroid-Formation Epoch? A V/Vmax Test
Many lines of evidence suggest that ellipticals and bulges formed the bulk of their stars at , both in clusters (e.g., Bower, Lucey, & Ellis 1992) and in the field (Bernardi et al. 1998, 2003), with much evidence having been accumulated from both low- and high-redshift () observations of passively evolving spheroids (see e.g., Renzini 1999 for an extensive review; see also Thomas et al. 2002). This is further reinforced by the recent discovery of passive early-type galaxies at , with UV-luminosity-weighted ages of 1–2 Gyr, implying formation redshifts beyond –4 (Cimatti et al. 2004). Therefore, a natural question is whether the -selected starbursts belong to the major epoch or to the low redshift tail of spheroid formation.
In order to tentatively distinguish between these alternatives, a test (Schmidt 1968) was performed on the flux limited population of -selected star-forming galaxies at . For each object, is computed as the ratio between the volume within the range and that within , where is the maximum redshift for which the object would still be detected with . To compute we use the observed color of each galaxy to estimate the -correction. In the case of a non evolving population the distribution of values should have an average of 0.5. For the 24 star-forming galaxies with in the K20/GOODS region we derive . Considering only the objects in , thus limiting , results in . A greater than 0.5 suggests that the comoving number density of these galaxies is increasing with redshift, but given the small sample the effect is only at the 2–3 level. Limits of these calculations are also that they are based in part on the use of photometric redshifts and that the results could be well affected by cosmic variance due to the clustering (D04).
The significance and rate of evolution could be however higher than recovered here, because biases are likely to work against the detection of objects at higher and higher redshifts. For example, the above calculation assumes no intrinsic evolution in the luminosity of the galaxies. On the other hand, if objects at lower redshift (e.g., at ) were forming stars with similar rates also at higher redshift (e.g. ), then the former would be intrinsically more luminous than the latter ones, and the amount of evolution would be higher than estimated above. Moreover, the strong bias due to surface brightness dimming with increasing redshift was not considered. Given the typical large sizes and low surface brightness of many of these star-forming galaxies (D04; Fig. 10) one expects this effect to be relevant and to bias to low values the estimates.
Consideration of these effects would further enhance the significance and amplitude of the evolution, suggesting that by we may have just started entering the epoch of widespread starburst activity, i.e., of major formation of galactic spheroids. An application of the test with upcoming larger redshift surveys should shed more light on this important point.
10.3. The Space Density of Vigorous Starbursts: Comparison with Models
We have shown that a substantial population of vigorous starburst galaxies with average yr-1 exists at . The number density of such -selected starbursts can be further compared to predictions of theoretical galaxy formation models.
For example, the GIF semi-analytical models (Kauffmann et al. 1999; Kaviani, Haehnelt & Kauffmann 2003) predict that within the population of galaxies with masses in the range (similar to the one derived for the K20 objects) are either passive galaxies with no ongoing SF or very active starbursts with SFR yr-1. This is in very good agreement with our observations, but in these models the number density of objects with SFR yr-1 is Mpc-3 and Mpc-3 respectively at and , which is a factor of 10–20 below the observed number densities. The space density of passive and massive galaxies is also similarly underpredicted.
Somerville et al. (2004) provide a mock catalog of galaxies with based on an updated semi-analytical model with enhanced starburst activity. While predicting the highest number density of galaxies with SFR yr-1 compared to all other models of this class, still it falls short by about an order of magnitude with respect to the present findings. Also the space density of passively evolving galaxies with at appears to be underpredicted by a similar factor by this model (Cimatti et al. 2004).
In general, CDM semi-analytical models fail to account for the sheer number of galaxies with (Cimatti et al. 2002c; D04; Somerville et al. 2004). An exception is the hierarchical model by Granato et al (2004) based on the assumption of a coeval growth of QSOs and spheroids, which succeeds in producing the high space density of near-IR bright galaxies (see also Silva et al. 2004). However, in its current realization this model predicts that the tail of -selected galaxies is predominantly populated by passively-evolving spheroids (see Fig. 8 in Silva et al. 2004), at variance with the observed prevalence of vigorous starbursts.
The recent CDM hydrodynamical simulations by Nagamine et al. (2004) appear instead quite successful in reproducing the space density of massive galaxies at , as observed in the K20 survey, at least in two out of three of its different realizations. In one of their three simulation sets the authors also recover 2 galaxies with old stellar populations and red colors, consistent with the colors of passive spheroids at found in K20 (Fig. 13) and well matching to the K20 space density of passive sources when accounting for the different volumes. It is not clear instead if these models can reproduce the observed high density of vigorous starbursts with SFR yr-1, as observed in our survey.
As recently pointed out by Cimatti et al. (2004) and Grazebrook et al. (2004), in the traditional semianalytic models the formation of massive spheroids appears to be delayed to much too low redshifts. On the other hand, the Granato et al. (2004) models appear to move in the right direction, by pushing the formation to higher redshift with strong bursts of star-formation, then quenched by strong AGN activity. However, in doing so they may exceed somewhat, as compared to our findings they appear to underpredict the number of starbursting galaxies still present at . The present results, and an application of the selection to substantially larger samples, may help in further tuning theoretical models toward a more realistic description of galaxy formation and evolution.
11. Summary and Conclusions
We have introduced a new criterion for selecting galaxies within the redshift range which is based on the photometry and allows to identify both active star-forming as well as passively-evolving galaxies, and to distinguish between the two classes. The criterion has been tested empirically – using the spectroscopic redshifts and spectral types from the K20 survey () including 32 objects out of 504 with a spectroscopic redshift – and justified by simulations showing that active and passive synthetic stellar populations actually follow this selection criterion and are correctly identified. Albeit smaller in size, other spectroscopic samples such as the GDDS and photometric redshift of faint galaxies from the GOODS samples (as currently available) confirm that the criterion is effective in selecting galaxies in the mentioned redshift range and also for limiting -band magnitudes somewhat fainter than . We have shown that this criterion provides a very efficient way of selecting galaxies at , that is not biased against passive galaxies and star forming galaxies that are highly reddened.
The classification of , galaxies as actively star forming or passive was then complemented by HST/ACS morphologies from the GOODS database, showing that indeed the spectral and morphological classifications are generally consistent: star-forming galaxies show clumpy, asymmetric morphologies typical of starbursts and mergers, while passive galaxies show symmetric surface brightness distribution in general typical of early-type galaxies.
It is shown that the photometry can be used to estimate the internal reddening for the K20 galaxies classified as star-forming, and their intrinsic luminosity at 1500 Å. This allows an estimate of their dust-extinction corrected SFRs. The X-Ray and radio luminosities of these galaxies provide SFR estimates in very good agreement with the ones from the de-reddened 1500 Å luminosity.
A significant population of galaxies with , average SFR yr-1, and median reddening is uncovered as a result, with a high volume density of Mpc-3 and sky density of arcmin-2. These vigorous starbursts produce a SFRD of yr-1 Mpc-3, representing a sizeable fraction of the total SFRD at as currently estimated.
For -selected galaxies at the stellar mass derived from their redshift and multicolor photometry is tightly correlated to the observed -band magnitude (with a dispersion of ), at least down to .
The selection and the above correlations ( vs. and vs. stellar mass) provide a fairly accurate and economic method that might be statistically applied to the very large samples of galaxies coming from the current or imminent wide-area surveys and/or for galaxy samples beyond the present spectroscopic capabilities.
A comparison with the UV-selected galaxies at (Steidel et al. 2004), including those at the same limit, shows that -selected star-forming galaxies have typically higher reddening and SFRs. Among our sample, the galaxies satisfying the UGR selection criterion contribute roughly % of the SFRD at produced by the whole K20 sample. On the other hand the surface density of the Steidel et al. UV-selected galaxies down to is times higher than that of star-forming galaxies in the same redshift range, and their contribution to the SFRD at is a factor higher than that of the , -selected galaxies.
The galaxies at are characterized by a much higher SFR (by a factor on average) compared to dusty, star-forming EROs () at , and . We conclude that these vigorous starbursts at are of a different nature compared to highly reddened galaxies.
A analysis of the infrared-selected galaxies with (Franx et al. 2003) detected within the K20 survey shows that those with are likely to be reddened star-forming objects, rather than passively evolving galaxies. A fraction % of galaxies in the K20 survey is estimated to lie at relatively low redshifts .
- and submm/mm-selected galaxies appear to share properties such as the redshift distribution, high SFRs and high masses, but the former ones have higher space density while the latter ones have higher SFRs. An interesting hypothesis is that submm/mm selected star-forming galaxies might represent extreme subsets of galaxies, at least when lying at .
Being based on the rest-frame shape of the spectra of starburst and passive galaxies, the criterion can be modified to select the same kinds of galaxies within a higher redshift range. In this mood, we propose a criterion to select galaxies within the range , which would complement the selection of galaxies. With uniquely deep -band (m) data that is becoming available from the Spitzer Space Telescope, this criterion should allow a selection of massive galaxies at that may efficiently complement the traditional LBG selection.
The high masses, SFRs, and metallicities of the bright -selected galaxies at , together with a hint for a strong clustering of them, qualify these galaxies as possible precursors of passively evolving EROs and early-type galaxies. A test indicates that the space density of these galaxies may increase with redshift in the range . Current theoretical simulations of hierarchical galaxy formation generally fail to account simultaneously for the space density of both passively evolving and star-forming galaxies at . Hydrodynamical simulations can reproduce our observations better than semyanalitical models.
Some of the above conclusions may be affected by cosmic variance, given the relatively small size of the explored field. To cope with this limitation a project is underway to cull -selected galaxies over a arcmin2 field, times larger than the full K20 survey area, by combining -band data from ESO telescopes with optical data from SuprimeCam at the SUBARU telescope (Kong et al. in preparation), and to follow them up spectroscopically with VIMOS at the VLT. The validity of the selection at faint magnitudes will be further tested in great detail with a planned VLT/FORS2 survey (GMASS project) targeting among others selected galaxies fainter than .
References
- (1) Abraham, R. G., et al. 2004, AJ, 127, 2455
- (2) Adelberger K. L., Steidel C. C., 2000, ApJ, 544, 218
- (3) Adelberger, K. L., Steidel, C. C., Shapley, A. E., Hunt, M. P., Erb, D. K., Reddy, N. A., & Pettini, M. 2004, ApJ, 607, 226
- (4) Alexander, D. M., et al. 2003, AJ, 126, 539
- (5) Arnouts, S., et al. 2001, A&A, 379, 740
- (6) Best, P. N., Lehnert, M. D., Miley, G. K., & Röttgering, H. J. A. 2003, MNRAS, 343, 1
- (7) Bernardi, M., Renzini, A., da Costa, L. N., Wegner, G., Alonso, M. V., Pellegrini, P. S., Rité, C., & Willmer, C. N. A. 1998, ApJ, 508, L143
- (8) Bernardi, M., et al. 2003, AJ, 125, 1882
- (9) Blain, A. W., Smail, I., Ivison, R. J., Kneib, J.-P., & Frayer, D. T. 2002, Phys. Rep., 369, 111
- (10) Blain, A. W., Chapman, S. S., Smail, I., & Ivison, R. 2004, ApJ, 611, 725
- (11) Bolzonella, M., Miralles, J.-M., & Pelló, R. 2000, A&A, 363, 476
- (12) Bolzonella, M., Pelló, R., & Maccagni, D. 2002, A&A, 395, 443
- (13) Bower, R. G., Lucey, J. R., & Ellis, R. S. 1992, MNRAS, 254, 601
- (14) Brusa M., Comastri A., Daddi E., et al., 2002, ApJ, 581, L89
- (15) Bruzual, G. & Charlot, S. 2003, MNRAS, 344, 1000
- (16) Calzetti D., Armus L., Bohlin R. C., et al., 2000, ApJ, 533, 682
- (17) Cimatti, A., Villani, D., Pozzetti, L., & di Serego Alighieri, S. 2000, MNRAS, 318, 453
- (18) Cimatti A., Daddi E., Mignoli M., et al., 2002a, A&A 381, L68
- (19) Cimatti A., Mignoli M., Daddi E., et al., 2002b, A&A 392, 395
- (20) Cimatti A., Pozzetti L., Mignoli M., et al., 2002c, A&A 391, L1
- (21) Cimatti, A., et al. 2003, A&A, 412, L1
- (22) Cimatti A., Daddi E., Renzini A., et al., 2004, Nature, 430, 184
- (23) Chapman, S. C., Blain, A. W., Ivison, R. J., & Smail, I. R. 2003, Nature, 422, 695
- (24) Coleman, G. D., Wu, C.-C., & Weedman, D. W. 1980, ApJS, 43, 393
- (25) Condon J. J., 1992, ARA&A, 30, 575
- (26) Daddi E., Cimatti A., Pozzetti L., et al., 2000a, A&A 361, 535
- (27) Daddi E., Cimatti A., Renzini A., 2000b, A&A 362, L45
- (28) Daddi E., Broadhurst T. J., Zamorani G., et al., 2001, A&A, 376, 825
- (29) Daddi E., Cimatti A., Broadhurst T. J., et al., 2002, A&A 384, L1
- (30) Daddi E., Röttgering H., Labbé I, et al., 2003, ApJ, 588, 50
- (31) Daddi E., Cimatti A., Renzini A., et al., 2004, ApJ, 600, L127 (D04)
- (32) de Mello D., Daddi E., Renzini A., et al., 2004, ApJ, 608, L29
- (33) Dickinson, M., Papovich, C., Ferguson, H. C., & Budavári, T. 2003, ApJ, 587, 25
- (34) Dickinson, M., Giavalisco, M., & The GOODS Team 2003, in The Mass of Galaxies at Low and High Redshift, ed. R. Bender & A. Renzini (Berlin: Springer), 324
- (35) Elston, R., Rieke, G. H., & Rieke, M. J. 1988, ApJ, 331, L77
- (36) Erb, D. K., Shapley, A. E., Steidel, C. C., Pettini, M., Adelberger, K. L., Hunt, M. P., Moorwood, A. F. M., & Cuby, J. 2003, ApJ, 591, 101
- (37) Firth, A. E., et al. 2002, MNRAS, 332, 617
- (38) Fontana, A., et al. 2003, ApJ, 594, L9
- (39) Fontana A., Pozzetti L., Donnarumma I., et al., 2004, A&A, 424, 23 (F04)
- (40) Förster Schreiber N. M., van Dokkum P.G., Franx M., et al. 2004, ApJ in press (astro-ph/0408077)
- (41) Franceschini, A., Aussel, H., Cesarsky, C. J., Elbaz, D., & Fadda, D. 2001, A&A, 378, 1
- (42) Franx M., Labbé I., Rudnick G., et al., 2003, ApJ, 587, L79
- (43) Genzel, R., Baker, A. J., Tacconi, L. J., Lutz, D., Cox, P., Guilloteau, S., & Omont, A. 2003, ApJ, 584, 633
- (44) Giacconi R., Zirm A., Wang J., et al., 2002, ApJS, 139, 369
- (45) Giavalisco M., et al., 2004, ApJ, 600, L93
- (46) Glazebrook, K., et al. 2004, Nature, 430, 181
- (47) Granato, G. L., De Zotti, G., Silva, L., Bressan, A., & Danese, L. 2004, ApJ, 600, 580
- (48) Haarsma, D. B., Partridge, R. B., Windhorst, R. A., & Richards, E. A. 2000, ApJ, 544, 641
- (49) Heavens, A., Panter, B., Jimenez, R., & Dunlop, J. 2004, Nature, 428, 625
- (50) Hu, E. M. & Ridgway, S. E. 1994, AJ, 107, 1303
- (51) Kauffmann, G., Colberg, J. M., Diaferio, A., & White, S. D. M. 1999, MNRAS, 307, 529
- (52) Kaviani, A., Haehnelt, M.G. & Kauffmann, G. 2003, MNRAS, 340, 739
- (53) Kellermann K.I., Fomalont E.B., Rosati P., Shaver P., 2004, in preparation
- (54) Madau, P., Pozzetti, L., & Dickinson, M. 1998, ApJ, 498, 106
- (55) McCarthy, P.J. 2004, ARA&A, 42, 477
- (56) Miyazaki, M., et al. 2003, PASJ, 55, 1079
- (57) Moustakas, L. A., Davis, M., Graham, J. R., Silk, J., Peterson, B. A., & Yoshii, Y. 1997, ApJ, 475, 445
- (58) Nandra K., Mushotzky R. F., Arnaud K., et al., 2002, ApJ, 576, 625
- (59) Nagamine K., Cen R., Ostriker J.P., Springer V., et al., 2004, ApJ submitted (astro-ph/0406032)
- (60) Norman, C., et al. 2004, ApJ, 607, 721
- (61) Pirzkal N., Xu C., Malhotra S., et al. 2004, ApJS in press (astro-ph/0403458)
- (62) Poli, F., et al. 2003, ApJ, 593, L1
- (63) Pozzetti, L. & Mannucci, F. 2000, MNRAS, 317, L17
- (64) Pozzetti L., Cimatti A., Zamorani G., et al., 2003, A&A, 402, 837
- (65) Ranalli P., Comastri A., Setti G., 2003, A&A, 399, 39
- (66) Reddy, N. A. & Steidel, C. C. 2004, ApJ, 603, L13
- (67) Renzini, A. 1999, in The Formation of Galactic Bulges, ed. C.M. Carollo et al. (Cambridge: CUP), 9 (astro-ph/9902108)
- (68) Roche, N. D., Dunlop, J., & Almaini, O. 2003, MNRAS, 346, 803
- (69) Roche, N. D., Almaini, O., Dunlop, J., Ivison, R. J., & Willott, C. J. 2002, MNRAS, 337, 1282
- (70) Rudnick, G., et al. 2003, ApJ, 599, 847
- (71) Saracco, P., et al. 2004, A&A, 420, 125
- (72) Schmidt, M. 1968, ApJ, 151, 393
- (73) Silva, L., Granato, G. L., Bressan, A., & Danese, L. 1998, ApJ, 509, 103
- (74) Silva, L., De Zotti, G., Granato, G. L., Maiolino, R., & Danese, L. 2004, submitted to A&A (astro-ph/0403166)
- (75) Smail, I., Ivison, R. J., Blain, A. W., & Kneib, J.-P. 2002, MNRAS, 331, 495
- (76) Somerville R. S., Primack J. R., Faber S. M., 2001, MNRAS, 320, 504
- (77) Somerville R. S., Moustakas L. A., Mobasher B., et al., 2004, ApJ, 600, L135
- (78) Sharp R.G., Sabbey C.N., Vivas A.K., et al., 2002, MNRAS 337, 1153
- (79) Shapley A.E., Erb D.K., Pettini M., et al. 2004, ApJ, 612, 108
- (80) Springel, V. & Hernquist, L. 2003, MNRAS, 339, 312
- (81) Steidel, C. C., Giavalisco, M., Dickinson, M., & Adelberger, K. L. 1996, AJ, 112, 352
- (82) Steidel, C. C., Adelberger, K. L., Giavalisco, M., Dickinson, M., & Pettini, M. 1999, ApJ, 519, 1
- (83) Steidel, C. C., Adelberger, K. L., Shapley, A. E., Pettini, M., Dickinson, M., & Giavalisco, M. 2003, ApJ, 592, 728
- (84) Steidel, C. C., Shapley, A. E., Pettini, M., Adelberger, K. L., Erb, D. K., Reddy, N. A., & Hunt, M. P. 2004, ApJ, 604, 534
- (85) Szokoly, G. P., et al. 2003, ApJS in press (astro-ph/0312324)
- (86) Thomas, D., Maraston, C., & Bender, R. 2002, Reviews in Modern Astronomy, 15, 219
- (87) Thompson, D., et al. 1999, ApJ, 523, 100
- (88) Totani, T., Yoshii, Y., Iwamuro, F., Maihara, T., & Motohara, K. 2001, ApJ, 558, L87
- (89) van Dokkum P. G., et al., 2003, ApJ, 587, L83
- (90) van Dokkum P. G., Franx M., Förster Schreiber N.M. et al. 2004, ApJ, 611, 703
- (91) Yan, L., Thompson, D., & Soifer, B. T. 2004, AJ, 127, 1274
- (92) Yun, M. S., Reddy, N. A., Scoville, N. Z., Frayer, D. T., Robson, E. I., & Tilanus, R. P. J. 2004, ApJ, 601, 723
- (93) Wold, M., Armus, L., Neugebauer, G., Jarrett, T. H., & Lehnert, M. D. 2003, AJ, 126, 1776
- (94) Vanzella E., Cristiani S., Dickinson M., et al. 2004, A&A submitted (astro-ph/0406591)