11email: j.knapen@star.herts.ac.uk
Structure and star formation in disk galaxies III.
From H images of a carefully selected sample of 57 relatively large, Northern spiral galaxies with low inclination, we study the distribution of the H emission in the circumnuclear and nuclear regions. At a resolution of around 100 parsec, we find that the nuclear H emission in the sample galaxies is often peaked, and significantly more often so among AGN host galaxies. The circumnuclear H emission, within a radius of two kpc, is often patchy in late-type, and absent or in the form of a nuclear ring in early-type galaxies. There is no clear correlation of nuclear or circumnuclear H morphology with the presence or absence of a bar in the host galaxy, except for the nuclear rings which occur in barred hosts. The presence or absence of close bright companion galaxies does not affect the circumnuclear H morphology, but their presence does correlate with a higher fraction of nuclear H peaks. Nuclear rings occur in at least 21% (5%) of spiral galaxies, and occur predominantly in galaxies also hosting an AGN. Only two of our 12 nuclear rings occur in a galaxy which is neither an AGN nor a starburst host. We confirm that weaker bars host larger nuclear rings. The implications of these results on our understanding of the occurrence and morphology of massive star formation, as well as non-stellar activity, in the central regions of galaxies are discussed.
Key Words.:
galaxies: spiral – galaxies: structure – galaxies: nuclei1 Introduction
Observations of the central regions of spiral galaxies reveal a number of features which are believed to be directly related to the dynamics of the host galaxy, such as bars, rings, and enhanced star formation (SF), possibly in the form of a starburst. Over the past decades, and more rapidly so in recent years thanks to a deluge of new high-quality observations and modelling, a general picture has emerged (see, e.g., review by Shlosman 1999) where inflowing gas can lead to SF in the nuclear or circumnuclear regions. Theoretically at least, a connection between the inflowing gas and non-stellar nuclear activity seems plausible (e.g., Shlosman et al. 1989). Observationally, however, it is proving rather difficult to provide evidence for direct links between activity and bars or interactions, the main large-scale mechanisms to cause the loss of angular momentum, and thus to enable gaseous inflow. For instance, the bar fraction in Seyfert host galaxies is higher than that in non-active galaxies, as proven by several recent studies, but at a formal significance level of only some 2.5 (Knapen et al. 2000; Laine et al. 2002; Laurikainen et al. 2004).
Detailed studies of the distribution of the SF in the nuclear and circumnuclear regions have usually been based on the study of small numbers of objects, and where larger samples have been used, these have mostly not been selected without different biasing factors in the sample selection (e.g., the comprehensive study by Buta & Crocker 1993 included nuclear rings found by targeting galaxies which were known to host inner and/or outer rings). In particular, no unbiased statistical studies of star-forming nuclear rings have been published. This is the main justification for the use, in the present paper, of our data set, which lends itself to a statistical study of the nuclear and circumnuclear SF even though in itself the images are not nearly as spectacular as, say, Hubble Space Telescope (HST) images. Our data set consists of a total of 57 continuum-subtracted images of spiral galaxies in the H line. H directly traces massive SF, with a possible contribution from AGN emission in the nuclear regions of active galaxies.
As noted by Buta & Combes (1996) in their review, it is relatively difficult to identify and study nuclear rings, given the large amount of background light from the bulge or inner regions of the disk. This means that only prominent nuclear rings, which can be considered rather extreme in size and/or relative brightness, can be found from the plates on which major galaxy catalogues and classifications are based. For a more complete statistical study, surveys are needed in wavebands which specifically trace nuclear rings. Capitalising on the enhanced massive SF in star-forming nuclear rings, the H line, as used in the current data set, is one of the best tracers available.
From our set of H images, at a typical spatial resolution of around a hundred parsec, we classify the nuclear and circumnuclear H morphology into a small number of distinct categories. This is very similar in principle to work by Pogge (1989a,b). The current work is more than a consistency check, though, and adds further value by the use of data of slightly higher angular resolution, as well as a more thoroughly applied set of criteria, for instance on the spatial extent of the nuclear and circumnuclear regions.
After a brief summary of the properties of the data set (Sect. 2) and an overview of the procedures and terminology used (Sect. 3), we discuss the results in terms of the properties of the host galaxies in Sect. 4. We pay attention to the nuclear rings and their hosts in Sect. 5, discuss possible relations to nuclear activity in Sect. 6, and summarise our findings and conclusions in Sect. 7.
2 Sample selection and observations
The selection criteria for the sample of 57 spiral galaxies, as well as some of its statistical properties, have been described by Knapen et al. (2003, hereafter Paper I). Basically, we selected all galaxies which are larger than 4.2 arcmin in diameter, of spiral type, inclined less than 50∘, and visible from the Northern hemisphere (∘). The resulting sample contains spiral galaxies of all morphological types, with and without bars, with and without nuclear activity, and of all spiral arm classes (cf. Elmegreen & Elmegreen 1987). All sample galaxies are relatively nearby, with an angular scale of 82 parsec/arcsec in the median, and of at most 183 parsec/arcsec (in the case of NGC 5371). For the median value, a two kpc radius is equivalent to just over 24 arcsec, or 100 pixels.
In this paper, we use a set of continuum-subtracted H images of our sample of 57 galaxies, as described by Knapen et al. (2004a, hereafter Paper II). The H line observations were obtained mostly with the 1 m Jacobus Kapteyn Telescope (JKT) on La Palma. Images of several, mostly larger, galaxies were obtained with the 2.5 m Isaac Newton Telescope or the 4.2 m William Herschel Telescope (WHT), as detailed in Paper II. Continuum emission was subtracted using images in the or broad bands or as obtained though a medium-width continuum filter (see Paper II). The spatial resolution of the H images is reasonable with a median value of 1.54 arcsec, well sampled with the original pixel size of 0.331 arcsec (smaller for those images obtained with the WHT), re-sampled in the data reduction process to 0.241 arcsec (see Paper II for details). Whereas the resolution is not ideal for studying circumnuclear emission in detail, this data set does allow us to compare the circumnuclear and nuclear H morphology across a wide range of spiral types.
In Paper II, we discuss the uncertainties resulting from the use of different filters in the continuum subtraction. We show there that these uncertainties are generally small, except possibly in the nuclear regions, and especially in the few cases where the -band filter has been used for the determination of the continuum. This is mostly because the filter transmits at longer wavelengths than the H line, and hence dust extinction can influence the result. We can directly check the impact of dust by comparing our results for the nuclear emission with those obtained by Böker et al. (1999) from Pa images, obtained at NIR wavelengths where the effects of extinction are much reduced. The overlap between their and our samples is only five galaxies, but the nuclear classifications for those agree in all cases: one galaxy (NGC 628) is classified as having no nuclear emission, four others (NGC 3184, 4395, 5474 and 6946) as having a nuclear peak. Of these five, we used the -band filter to subtract the continuum in the case of NGC 628, and the -band for the remaining four galaxies. This test, although unfortunately based on a handful of galaxies only, does show that the classification of nuclear emission as peaked is not systematically affected by the use of broad-band images as continuum.
In a few cases (those of NGC 488, NGC 1169, NGC 3368, NGC 4725 and NGC 6384) the continuum subtraction is less than perfect, and prevents any reliable determination of the nuclear H morphology. In addition, in the case NGC 7741, it is not possible to pinpoint the location of the galaxy nucleus (even in the NIR image of Paper I the nuclear region has multiple emission peaks). The nuclear H morphology has been tabulated as “N/A” (Table 1) in these six cases, and these six galaxies have not been included in the statistical analysis, below, of nuclear emission.
| NGC | Type | Activity | Nucl. H | Circ. Nucl. | Nucl. H | Circ. Nucl. | Ring | Ring |
|---|---|---|---|---|---|---|---|---|
| structure | structure | structure | structure | diam. | diam. | |||
| (RC3) | (NED) | (this paper) | (this paper) | (Pogge) | (Pogge) | (arcsec) | (kpc) | |
| 210 | .SXS3 | peak | patchy | stellar | diffuse bar | |||
| 337A | .SXS8 | none | patchy | - | - | |||
| 488 | .SAR3 | N/A | none | stellar | patchy | |||
| 628 | .SAS5 | none | patchy | none | patchy | |||
| 864 | .SXT5 | peak | none | stellar | patchy bar | |||
| 1042 | .SXT6 | peak | none | stellar | none | |||
| 1068 | RSAT3 | Sy1 Sy2 | peak+amorph | ring | - | - | 46 | 3.2 |
| 1073 | .SBT5 | amorph | patchy | amorph | patchy bar | |||
| 1169 | .SXR3 | N/A | none | - | - | |||
| 1179 | .SXR6 | none | patchy | - | - | |||
| 1300 | .SBT4 | peak | ring | ring | none | 10 | 0.9 | |
| 2775 | .SAR2 | peak | diffuse | none | none | |||
| 2805 | .SXT7 | none | patchy | - | - | |||
| 2985 | PSAT2 | LINER | peak | patchy | - | - | ||
| 3184 | .SXT6 | HII | peak+amorph | f.ring | stellar | v.f.patchy | 82 | 3.4 |
| 3227 | .SXS1P | Sy1.5 | peak+amorph | patchy (bar) | - | - | ||
| 3344 | RSXR4 | peak | ring | - | - | 67 | 2.0 | |
| 3351 | .SBR3 | HII Sbrst | f.peak | ring | ring | none | 20 | 0.8 |
| 3368 | .SXT2 | Sy LINER | N/A | f.diffuse | stellar | patchy | ||
| 3486 | .SXR5 | Sy2 | peak | ring | - | - | 54 | 1.9 |
| 3631 | .SAS5 | none | patchy | - | - | |||
| 3726 | .SXR5 | peak+amorph | patchy | stellar | knot 3.4SW | |||
| 3810 | .SAT5 | peak | patchy | amorph | patchy | |||
| 4030 | .SAS4 | amorph | patchy | - | - | |||
| 4051 | .SXT4 | Sy1.5 | stellar+amorph | f.patchy | - | - | ||
| 4123 | .SBR5 | Sbrst HII | peak | patchy | stellar | f.patchy bar | ||
| 4145 | .SXT7 | HII/LINER | amorph | patchy | none | f.patchy | ||
| 4151 | PSXT2 | Sy1.5 | peak | patchy | - | - | ||
| 4242 | .SXS8 | none | patchy | - | - | |||
| 4254 | .SAS5 | none | patchy | ring | patchy | |||
| 4303 | .SXT4 | HII Sy2 | peak | ring | ring | none | 8 | 0.6 |
| 4314 | .SBT1 | LINER | peak | ring | ring | none | 16 | 0.8 |
| 4321 | .SXS4 | LINER HII | peak | ring | ring | patchy arms | 22 | 1.8 |
| 4395 | .SAS9 | LINER Sy1.8 | peak | patchy | - | - | ||
| 4450 | .SAS2 | LINER | peak | patchy | stellar | none | ||
| 4487 | .SXT6 | peak+amorph | patchy | - | - | |||
| 4535 | .SXS5 | peak | diffuse | stellar | diffuse | |||
| 4548 | .SBT3 | LINER Sy | peak | none | stellar | v.f.patchy | ||
| 4579 | .SXT3 | LINER Sy1.9 | peak | patchy | stellar | v.complex | ||
| 4618 | .SBT9 | HII | peak | patchy | - | - | ||
| 4689 | .SAT4 | none | patchy | none | patchy | |||
| 4725 | .SXR2P | Sy2 | N/A | none | - | - | ||
| 4736 | RSAR2 | Sy2 LINER | peak | ring | stellar | diffuse | 102 | 2.1 |
| 5247 | .SAS4 | none | patchy | none | patchy | |||
| 5248 | .SXT4 | Sy2 HII | amorph | ring | ring | patchy | 17 | 1.9 |
| 5334 | .SBT5 | none | f.patchy | - | - | |||
| 5371 | .SXT4 | LINER | peak | ring | - | - | 5 | 1.0 |
| 5457 | .SXT6 | peak+amorph | patchy | - | - | |||
| 5474 | .SAS6P | HII | peak | patchy | - | - | ||
| 5850 | .SBR3 | peak+amorph | none | diffuse | none | |||
| 5921 | .SBR4 | LINER | peak | none | stellar | none | ||
| 5964 | .SBT7 | none | patchy | - | - | |||
| 6140 | .SBS6P | amorph | patchy | - | - | |||
| 6384 | .SXR4 | LINER | N/A | none | stellar | f.patchy bar | ||
| 6946 | .SXT6 | HII | peak | patchy | - | - | ||
| 7727 | SXS1P | peak+amorph | none | - | - | |||
| 7741 | .SBS6 | N/A | patchy | none | patchy bar |
3 Procedure, terminology and results
We used the Tully (1988) distances to the galaxies to calculate which region in each image corresponds to a radius of 2 kpc, the radius taken here to delimit the circumnuclear region. Using standard image display methods, the nuclear classification was derived from the nuclear H emission (if any) on the smallest measurable scale, corresponding to the central one to a few seeing elements. As mentioned in the previous Section, this corresponds to at most a few hundred parsec.
Before explaining the various categories used in classifying the central H morphology, we will briefly mention a few differences between the terminology used by Pogge (1989b) and the similar one used here. First, Pogge used the term “stellar” to describe centrally peaked emission, but we found only one case (namely that of NGC 4051) where the nuclear emission peak was not significantly more extended than the point spread function in the image, as measured from stars in the original image, before continuum subtraction (and listed in table 1 of Paper II). Thus, we prefer to use the term “peak” in all remaining cases of centrally peaked H emission. Second, we have tried to be more consistent in the use of the terms “nuclear” and “circumnuclear”. In this paper, the latter refers to an area of 2 kpc radius around the nucleus, whereas the former refers to the very innermost region, of at most a few hundred parsec across. In contrast, Pogge (1989b) placed some nuclear rings in the “nuclear” emission list, whereas all such rings would be listed as “circumnuclear” by us.
That said, the overall classification scheme is very similar to the one used by Pogge (1989b). For the nuclear emission, apart from the stellar and peak categories described above, we use the terms none to describe, obviously, the absence of any H emission from the nucleus; amorph which indicates amorphously distributed H emission, without clearly identifiable peaks; and patchy, to describe individual regions of H emission, not centrally peaked, and resembling H ii regions as known in the disks of galaxies. In some cases, a peaked nuclear H distribution is seen surrounded by amorphous emission which clearly extends beyond the nuclear peak. These cases have been marked “peakamorph”.
The circumnuclear H emission is classified as follows. None implies no discernible H emission at all within the circumnuclear area (except possibly in the nucleus); diffuse means that H emission is present, but it cannot easily be ascribed to individual and well-defined H ii regions; patchy is used for galaxies where well-defined patches of H emission are seen, caused by individual H ii regions, but not organised in a ring-like fashion; and, finally, ring, describes a situation where individual H ii regions are organised into a well-defined nuclear ring or pseudo-ring. In a few cases, we use a rather qualitative classifier such as “f.patchy” to indicate the particularly faint nature of the circumnuclear emission.
In Table 1 we list our classifications of the nuclear and circumnuclear H emission, as well as, for comparison, those arrived at by Pogge (1989b) for the galaxies in common between his and our samples (those of our galaxies which were not in his sample are simply listed as “–” in the “Pogge” columns of our Table). Table 1 also lists the morphological type of the sample galaxies obtained from the RC3, a description of the nuclear activity as obtained from the NASA/IPAC Extragalactic Database, NED, and the diameters of the nuclear rings identified in our study, as measured from the H images.
Our results will be analysed below with the aid of tables and figures showing the H morphology for different host galaxy types and types of nuclear activity, but here we just mention that in general, and taking into account the two specific cases of different use of terminology by Pogge and this study, his and our classifications agree very well. Where they do not agree, the differences can usually be sourced to our strict use of the 2 kpc radius to limit the area of circumnuclear emission.
| Emission | Morphological type | Bar type | |||||||||||
|---|---|---|---|---|---|---|---|---|---|---|---|---|---|
| 1 | 2 | 3 | 4 | 5 | 6 | 7 | 8 | 9 | SA | SX | SB | ||
| Total sample | |||||||||||||
| 57 | 3 | 7 | 8 | 12 | 11 | 9 | 3 | 2 | 2 | 15 | 29 | 13 | |
| Nuclear emission | |||||||||||||
| Peak | 26 | 1 | 5 | 4 | 6 | 5 | 3 | 0 | 0 | 2 | 7 | 12 | 7 |
| Peak amorph | 8 | 2 | 0 | 2 | 0 | 1 | 3 | 0 | 0 | 0 | 1 | 6 | 1 |
| Total peak1 | 34 | 3 | 5 | 6 | 6 | 6 | 6 | 0 | 0 | 2 | 8 | 18 | 8 |
| None | 11 | 0 | 0 | 0 | 2 | 4 | 1 | 2 | 2 | 0 | 5 | 4 | 2 |
| Amorph | 5 | 0 | 0 | 0 | 2 | 1 | 1 | 1 | 0 | 0 | 1 | 2 | 2 |
| Stellar + amorph | 1 | ||||||||||||
| N/A2 | 6 | ||||||||||||
| Circumnuclear emission | |||||||||||||
| Patchy | 32 | 1 | 3 | 2 | 4 | 8 | 7 | 3 | 2 | 2 | 11 | 14 | 7 |
| None | 10 | 1 | 1 | 4 | 2 | 1 | 1 | 0 | 0 | 0 | 1 | 6 | 3 |
| Ring | 12 | 1 | 1 | 2 | 6 | 1 | 1 | 0 | 0 | 0 | 23 | 7 | 3 |
| Diffuse | 3 | 0 | 2 | 0 | 0 | 1 | 0 | 0 | 0 | 0 | 1 | 2 | 0 |
As summarised in Table 2, of the 51 galaxies for which the nuclear morphology could be classified, 34 (67%7%, where the uncertainties quoted are Poisson errors, cf. Laine et al. 2002) show a peak (of which 8, or 16%5% of the total, also show amorphous emission around their peak), 11 (22%6%) show no emission at all, five (10%6%) are classed “amorph”, and the category “stellar+amorph” is used for one galaxy (NGC 4051; 2%3%). The circumnuclear H emission is patchy in a total of 32 (56%7%) of the 57 sample galaxies, diffuse in three (5%3%), in the form of a nuclear ring in 12 (21%5%), and absent in 10 (18%5%) galaxies.
4 Host galaxy properties
4.1 Absolute magnitude, diameter, and distance
| Emission | Companions | |||||
|---|---|---|---|---|---|---|
| (kpc) | (Mpc) | (mag) | Yes (%) | No (%) | ||
| Nuclear emission | ||||||
| Peak | 26 | 23.4 | 16.8 | 20.0 | 64 | 36 |
| Peakam. | 8 | 24.0 | 17.0 | 20.3 | 18 | 14 |
| Total peak | 34 | 23.7 | 16.8 | 20.1 | 82 | 50 |
| None | 11 | 26.6 | 21.2 | 20.0 | 7 | 41 |
| Amorph | 5 | 23.0 | 20.7 | 19.7 | 11 | 9 |
| Circumnuclear emission | ||||||
| Patchy | 32 | 23.2 | 17.0 | 20.0 | 57 | 56 |
| None | 10 | 35.6 | 24.3 | 20.4 | 13 | 22 |
| Ring | 12 | 24.9 | 12.1 | 19.8 | 23 | 19 |
| Diffuse | 3 | 23.2 | 16.8 | 20.1 | 7 | 4 |
From the data presented in Table 1 and the properties of the sample galaxies (see Paper I) we have derived information on how the different classes of nuclear and circumnuclear H morphology correlate with the host galaxy parameters diameter, distance, and absolute magnitude (Table 3).
Considering first the nuclear emission, the only trend is that those galaxies which host a nuclear H peak are on average closer than those which don’t host a nuclear peak. This is probably simply due to lower spatial resolution preventing the detection of nuclear peaks. The fact that the peak host galaxies are not larger or brighter than the others must be due to the way in which our sample was constructed, using a lower limit to galaxy diameter.
The distribution of the circumnuclear emission classes shows two clear effects. First, those galaxies which show no circumnuclear H emission are in the median further away, brighter, and considerably larger than other galaxies in the sample. This can be explained as a selection effect simply because any H emission is more likely to go undetected in the more distant galaxies, due to decreasing brightness and spatial resolution. The most distant galaxies must have the largest diameters to make it into our sample (we imposed a lower limit of 4.2 arcmin). Second, the galaxies hosting nuclear rings are significantly closer (and slightly less bright) in the median than other galaxies. The most attractive explanation is again that this is due to a selection effect: namely that nuclear rings can only be detected in nearby galaxies in a survey such as ours, with limited spatial resolution. This might imply that there are more nuclear rings, but unresolved, among the rest of our sample, and hence that the nuclear ring fraction derived in this paper is really a lower limit. Only observations of galaxies at higher spatial resolution could confirm this, but UV imaging with the HST has failed to detect a population of such smaller rings (Maoz et al. 1996a, see also Sect. 5.1).
4.2 Morphological type of the host galaxy


The distribution of nuclear and circumnuclear H emission among the different morphological types of the sample galaxies is summarised in Table 2, and shown graphically in Fig. 1 (nuclear morphology) and Figs. 2 and 3 (circumnuclear). As discussed in Paper II, our sample spans the complete range of spiral types, from Sa to Sm, but peaks near types 4 and 5, Sbc and Sc.
As Fig. 1 shows, a peaked nuclear morphology is the most common. No trends with morphological type are obvious, and further analysis is prevented by the small numbers of galaxies in the “none” and “amorph” classes, or with later morphological types.
The results on circumnuclear H emission morphology (shown as number histograms in Fig. 2, and as histograms of fractions of each morphological type which have certain circumnuclear H morphology in Fig. 3) are more interesting. First, we find that “patchy” emission occurs preferentially in the later-type galaxies, with practically all galaxies of type Sc and later in this class (all of those with type Sd or later; Fig. 3). Second, an absence of circumnuclear emission (class “none”) is most often found in the earlier types. Third, the nuclear ring distribution shows a sharp peak at type 4 (Sbc) and indicates that nuclear rings are absent from late-type galaxies. This will be discussed in more detail below (Sect. 5.1).
The “patchy” class traces individual patches of H emission, as caused by H ii regions, and since these occur more in late- than in early-type galaxies (e.g., Kennicutt et al. 1989; review by Kennicutt 1998), the result found here is as expected. Similarly, the “none” preference for early-type hosts can be easily understood from the relative paucity of gas, massive SF, and H ii regions in those galaxies. But even within this class, some early-type galaxies, presumably the gas-rich ones, show higher fractions of star-forming regions (e.g., Pogge & Eskridge 1987, 1993). Indeed, we do find that significant fractions of even the earliest galaxies in our sample show “patchy” or ring-shaped H circumnuclear morphology (Figs. 2, 3).
4.3 Bars
Table 2 shows the bar presence in the sample galaxies, as derived directly from the RC3 morphological classification. The “SA” galaxies are unbarred, and we consider the “SX” and “SB” galaxies as barred. Of the whole sample of 57, 42 galaxies (74%6%) are barred, roughly as expected (see, e.g., Mulchaey & Regan 1997; Knapen et al. 2000; Eskridge et al. 2000). Apart from the link between bars and nuclear rings, which will be discussed in more detail below (Sect. 5), and taking the margins of uncertainty into account, Table 2 shows no significant effects. Of the 11 galaxies with no nuclear H emission, class “none”, five have no bar (class SA) which is a slightly higher fraction than expected. It is tempting to suggest that this is a result of the expectation that bars will stimulate the central concentration of gas, which can lead to SF and H emission, a picture which would qualitatively fit the numbers observed, but a much enlarged sample with proper NIR imaging to derive the bar presence is needed before such conclusions can be drawn reliably.
4.4 Presence of companion galaxies
The last two columns of Table 3 list the results of an analysis of the presence of close bright companion galaxies, performed using the HyperLEDA database, hosted by the Observatoire de Lyon (Paturel et al. 2003). Our criteria for deciding whether a galaxy has such a companion have been adapted from the works of Schmitt (2001) and Laine et al. (2002), as follows. We consider that a sample galaxy has a close and bright companion if at least one companion galaxy exists either within a cylindrical volume of radius 400 kpc and “depth” of km s-1 in , centred on the sample galaxy, and which is not fainter than the sample galaxy by mag, or within a volume with radius of five times the optical diameter of the galaxy, km s-1, and mag. We find that 30 of our 57 sample galaxies have a close bright companion, although very few of these are in fact strongly interacting or in the process of a merger, but all may well be gravitationally influenced by the companion. The remaining 27 have no close bright companion, although 21 of these do have a weaker companion (fainter by more than mag) within the volume of kpc, km s-1.
In Table 3, we list the fractions of galaxies which have a close bright companion following the criteria described above, and of those which do not. This analysis shows that, first, galaxies with close bright companions have more often a nuclear H peak, and less often an absence of nuclear H emission, and, second, that whether a galaxy has a close bright companion or not does not have a significant effect on the distribution of the circumnuclear H emission. The former result can be interpreted qualitatively in terms of central gas concentration induced by the interaction between the galaxies (e.g., Mihos & Hernquist 1996, who studied the case of mergers of disk galaxies of comparable mass), but the absence of any effect on the circumnuclear star formation is slightly puzzling in this respect.
5 Nuclear rings
5.1 General statistics and host galaxy morphology
Of our 57 sample galaxies, 12 host a nuclear ring, or 21%5%. Since we did not make specific assumptions in our sample selection which might bias the detection of nuclear rings, we can thus state that about a fifth of disk galaxies host nuclear rings, which, as far as we are aware, is the first a priori determination of the nuclear ring fraction in the general population of nearby spiral galaxies. Given the data set used in this paper, we should strictly speak about the fraction of star-forming nuclear rings, which may be a lower limit to the true nuclear ring fraction (e.g., Erwin & Sparke 2001 discuss a category of nuclear rings which do not currently form massive stars and are identified on the basis of their broad-band optical colour appearance; these authors report a total nuclear ring fraction of a third among their sample of early-type, S0-Sa, galaxies).
Maoz et al. (1996a) observed around 100 nearby galaxies in the UV with the HST, and found that only five of these galaxies had a nuclear ring. As recognised by the authors (Maoz et al. 1996b) this is mostly due to the small field of view of their images, of only 22 arcsec. For comparison, six or seven of the 12 nuclear rings listed in Table 1 are larger than that. What is perhaps more surprising is that Maoz and collaborators did not find more small nuclear rings: four of their five were known from ground-based work, the fifth was a small nuclear ring with a diameter of four arcsec.

Nevertheless, our nuclear ring fraction of 21% is a lower limit due to the relatively low angular resolution of our H images. This limits the radii of the nuclear rings found in our study to a few hundred parsec, which implies that small nuclear rings such as those found in NGC 5248 by Laine et al. (2001) and Maoz et al. (2001), of around two arcsec (220 pc) in diameter, or in IC 342 (Böker et al. 1997), of less than 100 pc in diameter, would not be resolved. Although it is clear that nuclear rings with diameters smaller than a few hundred parsec exist, it is unclear at present how common such rings are. Because it is also unknown whether such small rings occur preferentially in later- or earlier-type spirals, we show in Fig. 4 how the relative size of the nuclear rings identified here relates to the morphological type of the host galaxy (similar results are obtained when plotting the physical or projected diameters of rings, in kpc or arcsec, but are not shown here). There is no evidence for a trend, although the three largest rings do occur in galaxies of later types. Buta & Crocker (1993) show a similar figure in their paper and report a “hint of a weak type dependence”, but in the sense that smaller rings occur in galaxies with later types.
As seen in Figs. 2 and 3, nuclear rings occur predominantly in host galaxies with intermediate types, with a preference for type 4, or Sbc galaxies. We find no nuclear rings in galaxies with types later than 6 (Scd). This can be understood within the framework of formation of nuclear rings as a result of gas accumulation near dynamical resonances set up in the disk between stellar orbital precession rate and the bar pattern speed. For this to occur, a sizeable bulge is needed, which is mostly absent from galaxies of the latest types, thus explaining the absence of nuclear rings in these galaxies. Another prerequisite of nuclear rings, the availability of gas, may not be fulfilled in many early-type galaxies, thus explaining the slightly lower nuclear ring fractions in those galaxies compared to, e.g., those of type Sbc.
5.2 Nuclear rings in non-barred hosts?
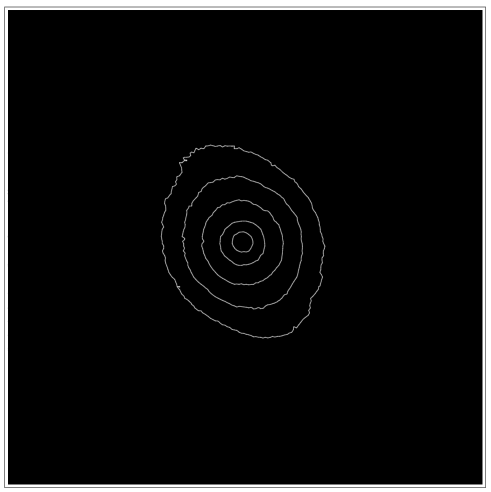
Two nuclear rings occur in galaxies which are classified as non-barred (SA) in the RC3, namely NGC 1068 and NGC 4736. It is well known that NGC 1068 hosts a relatively small bar (of radius 14 arcsec or about 1 kpc; Laine et al. 2002) which is easily visible in the NIR, yet hardly at all at optical wavelengths (Scoville et al. 1988; Thronson et al. 1989). NGC 4736 is a similar case, where a small nuclear bar is seen in optical and especially NIR images (Shaw et al. 1993; Möllenhoff et al. 1995; Wong & Blitz 2000; Fig. 5). In Fig. 5, the maximum elongation of the isophotes is seen to occur at a radius of about 10 arcsec or 200 pc, although Möllenhoff et al. model the bar to be slightly larger. In addition, the disk of NGC 4736 is ovally distorted (Bosma et al. 1977; Möllenhoff et al. 1995; Wong & Blitz 2000). We can thus state that all our nuclear rings occur in barred galaxies, which confirms the current interpretation where the rings form as a result of gas accumulation near one or more ILRs driven by a bar.
Although a direct link between nuclear rings and barred host galaxies can be traced back to the early work of, e.g., Sérsic & Pastoriza (1967), rings of all types (nuclear, inner, outer) do occur in galaxies classified as unbarred, but as Buta & Combes (1996) indicate in their review, some non-axisymmetry in the gravitational potential can usually be identified, either due to a small or otherwise not obvious bar (e.g., NGC 1068 and NGC 4736, discussed above), an oval, or an interaction. As an example we mention the nuclear ring in the small galaxy NGC 278, which is not only classed as unbarred, but which also shows no sign at all of a large or nuclear bar in high-quality optical and NIR images. There is, however, evidence from H i observations for a recent interaction and minor merger, and this event is postulated to be the cause of a non-axisymmetry in the gravitational potential, which in turn causes the nuclear ring (Knapen et al. 2004b).
5.3 Large nuclear rings occur in weak bars

Knapen et al. (2002) used measurements of the relative sizes of nuclear rings to confirm observationally the expectation from theory and modelling (Knapen et al. 1995; Heller & Shlosman 1996) that stronger bars host smaller nuclear rings. This result confirms the expectation that nuclear rings, being gaseous features, can only occur in those regions where the main orbit family in the bar (that of the so-called orbits) does not intersect with the second one, of orbits. In the case of stronger, or thinner, bars, the gas will thus have to settle further in, and any nuclear rings must be smaller (see fig. 11 of Knapen et al. 1995). When plotting the relative sizes (ring diameter divided by the diameter of their host galaxy) of 10 nuclear rings, Knapen et al. (2002) indeed found this (their fig. 8). With the 12 nuclear rings of the current paper, plus four from Knapen et al. (2002) which are not in our current sample, we can now check the result found before with more nuclear rings, spanning a wider range in both relative sizes and bar strengths.
The result of this exercise is shown in Fig. 6, where we plot the relative size of the nuclear rings, defined here as the diameter of the ring, as measured from our H images and tabulated in Table 1, divided by the diameter of the complete disk of its host galaxy ( from the RC3), against the gravitational torque due to the bar. Values of have been taken mostly from Block et al. (2001), who analysed the same sample as analysed in this paper, but where other measurements were available from the literature (Buta & Block 2001; Laurikainen & Salo 2002) averages were used. For NGC 1530 and NGC 6951 (a nuclear ring galaxy from Knapen et al. 2002 included in Fig. 6) new values for were derived by Buta et al. (2003) and Block et al. (2004) using a refinement of the original technique, which allows the separate contributions from spiral arms and bar to the overall gravitational torque to be quantified. As a conservative estimate, we can state that typical uncertainties in are less than 0.1, and in the relative ring size, less than 10%.
Figure 6, then, clearly confirms the rather more preliminary results presented by Knapen et al. (2002), of stronger bars hosting smaller nuclear rings. In fact, we can now refine this conclusion to state that whereas weak bars can host nuclear rings of any size (with an upper limit, by definition, corresponding to the radius of 2 kpc which we assumed as the limit to the circumnuclear region), strong bars can only host small nuclear rings. As summarised already in the first paragraph of this Section, this is in agreement with the predictions following from earlier numerical and theoretical interpretation of the formation and evolution of nuclear rings in relation to resonances and orbit families in bars (Knapen et al. 1995; Heller & Shlosman 1996).
5.4 Inner rings
In addition to the nuclear rings discussed above, the images of the sample galaxies also show a number of well-defined inner rings. A non-exhaustive but illustrative list of such rings includes the ones in NGC 2775, of 82 arcsec or 6.7 kpc in radius, in NGC 3368 (150 arcsec or 5.9 kpc), in NGC 4725 (300 arcsec or 18 kpc), or in NGC 5850 (140 arcsec or 18.9 kpc). A study of these inner rings is outside the scope of this paper. We note in this context, though, that we classified the well-known ring in NGC 4736 (e.g., Sandage 1961; Lynds 1974; Pogge 1989b) as a nuclear ring, based on its small physical diameter (of 2.1 kpc, using an image scale derived from the Tully 1988 distance of 4.3 Mpc to the galaxy), even though due to the small distance the angular diameter of the ring is rather large (102 arcsec) and it has historically often been referred to as an inner ring (e.g., van der Kruit 1976; Bosma et al. 1977; Möllenhoff et al. 1995; Martin & Belley 1997).
6 Links to non-stellar activity
| Total | AGN | H ii/SB | non-AGN | non-AGN non-SB | |
| Nuclear emission | |||||
| Sample size | 51 | 18 | 6 | 33 | 27 |
| Peak | 26 (51%) | 13 (72%) | 5 (83%) | 13 (39%) | 8 (30%) |
| Peak + amorph | 8 (16%) | 2 (11%) | 1 ( 17%) | 6 (18%) | 5 (19%) |
| Total peak1 | 34 ( 67%) | 15 (83%) | 6 (100%) | 19 (58%) | 13 (48%) |
| None | 11 (22%) | – | – | 11 (33%) | 11 (41%) |
| Amorph | 5 (10%) | 2 (11%) | – | 3 (9%) | 3 (11%) |
| Stellar + amorph | 1 (2%) | 1 (6%) | – | – | – |
| Circumnuclear emission | |||||
| Sample size | 57 | 21 | 6 | 36 | 30 |
| Patchy | 32 (56%) | 8 (38%) | 4 (67%) | 24 (67%) | 20 (67%) |
| None | 10 (18%) | 4 (19%) | – | 6 (17%) | 6 (20%) |
| Ring | 12 (21%) | 8 (38%) | 2 (33%) | 4 (11%) | 2 (7%) |
| Diffuse | 3 (5%) | 1 (5%) | – | 2 (6%) | 2 (7%) |


The nuclear and circumnuclear H morphologies of the sample galaxies as classed by their nuclear activity is shown in Table 4, and shown in Figs. 7 for the nuclear, and 8 for the circumnuclear morphology (where fractions rather than numbers are now plotted in the histograms). The different classes were defined on the basis of the galaxy classifications in the NED, as follows. We class as “AGN” all those galaxies where the NED classes galaxies as either Seyfert (of any type) or LINER (including classifications such as LINER/starburst). We thus place all galaxies in this bin for which there is evidence for non-stellar nuclear activity. The “H ii/SB” category contains all those galaxies either classified as H ii or as starburst in the NED. The final classes, non-AGN and non-AGN/non-SB, were derived from the previous two classes, where the latter class contains those galaxies for which the NED does not list any evidence for either AGN or starburst activity. With these classes, we can thus make a rough distinction between AGN, starbursts, and galaxies without any nuclear activity. The NED classification of the sample galaxies has been tabulated in Paper I.
To check the NED classification, we correlated our sample with that of Ho et al. (1997), who give nuclear activity classes for over 450 galaxies based on their own detailed spectroscopy. We find that for the 43 galaxies in both samples the classifications (for our purpose, thus in broad categories “AGN” and “starburst”) by Ho et al. and as obtained from the NED agree well, with disagreements only in less than 10% of the cases. We thus feel confident to use the information from the NED, but are aware of the caveat that where no spectroscopic information of a galaxy’s nucleus is available from the literature, the galaxy would automatically be classed as “non-AGN, non-starburst” in our analysis. Given, however, that our sample galaxies are nearby, bright, and generally well-studied, we assume that only a tiny minority of galaxies, if any at all, can fall in this category.
The results for nuclear morphology (Fig. 7) are not surprising: most AGN are centrally peaked in H, all starbursts are, and most of the non-peaked morphologies are found among the non-AGN/non-SB galaxies. Another result worth reiterating in this context is that even among the non-AGN/non-SB galaxies, almost half have peaked nuclear H emission.
The AGN and the rings lead to a very interesting circumnuclear H emission result (Fig. 8). Whereas more than half (56%) of all galaxies have patchy circumnuclear emission, only 38% of the AGN have. An equally high fraction though (38% of the AGN hosts) have nuclear rings. Less surprisingly, the starbursts all have patchy (four out of six) or ring (the remaining two) H morphology.
Of the 12 nuclear rings we identified, only two (17% of nuclear rings) occur in a galaxy which hosts neither a starburst nor an AGN, and the great majority (8/12 or 67% of the rings) occurs in AGN hosts. This result, and the one described in the previous paragraph, strongly indicate that there is a direct statistical link between nuclear rings and non-stellar nuclear activity. This link has, to our knowledge, not been indicated before, and is interesting because the spatial scales involved in either of these processes are rather different: a few 100 parsec to a kiloparsec for the nuclear rings, versus much smaller scales, possibly of the order of AUs, for the black hole accretion powering the AGN. Yet the link between star-forming nuclear rings, regarded as prime indicators of very recent gas inflow, and AGN indicates that recent gas inflow on scales of up to a kpc may have more to do with the AGN as other studies, for instance of bar fractions in AGN and non-AGN (Knapen et al. 2000; Laine et al. 2002), would lead one to believe. We note the effect and its possible implications here, but point out the need to confirm it through the study of larger samples of nuclear rings. We also point out a possibly related result reported in the literature, namely that of correlations between inner and outer rings in galaxies and the occurrence of AGN activity, e.g. by Arsenault (1989) and by Hunt & Malkan (1999), which are intriguing if only because the spatial scales of those rings are even further removed from typical AGN scales.
7 Conclusions
From a complete set of H images of a carefully selected sample of 57 relatively large, Northern spiral galaxies with low inclination, we study the distribution of the H emission in the nuclear and circumnuclear regions, emission which traces predominantly massive young stars. The images form part of a larger set comprising also NIR and optical broad-band (, and ) images of all galaxies (Papers I, II). The majority of the H images have been taken with the 1 m JKT on La Palma over the past few years, at a spatial resolution of around 1.5 arcsec, or around 100 parsec. The main results described in the current paper can be summarised as follows.
-
•
The nuclear H emission is peaked in most of the sample galaxies, and significantly more often so among AGN host galaxies than among non-AGN.
-
•
The circumnuclear H emission, defined to be that originating within a radius of two kpc, is often patchy in late-type, and absent or in the form of a nuclear ring in early-type galaxies.
-
•
There is no clear correlation of nuclear or circumnuclear H morphology with the presence or absence of a bar in the host galaxy, except for the nuclear rings which all occur in barred hosts.
-
•
The presence or absence of close bright companion galaxies does not affect the circumnuclear H morphology, but their presence does correlate with a higher fraction of nuclear H peaks.
-
•
Star-forming nuclear rings occur in one of every five galaxies (21%5%), although at the rather low spatial resolution in our images this number must be considered a lower limit.
-
•
We confirm earlier results that only weaker bars can host larger nuclear rings, an effect which is explained in terms of the predominant orbit families in bars and their relation to rings.
-
•
The nuclear rings identified here occur predominantly in galaxies also hosting an AGN, and only two of our 12 nuclear rings occur in a galaxy which is neither an AGN nor a starburst host. This indicates some link between nuclear rings and non-stellar nuclear activity, and since nuclear rings are prime indicators of very recent gas inflow, common fuelling processes may be involved.
Acknowledgements.
I thank my collaborators on Paper II, Tom Bradley, Daniel Bramich, Stuart Folkes and Sharon Stedman, for their help in producing the H images used in the current paper. Torsten Böker and Isaac Shlosman are acknowledged for helpful comments. We used the HyperLEDA database, hosted by the Observatoire de Lyon (http://leda.univ-lyon1.fr/). This research has made use of the NASA/IPAC Extragalactic Database (NED) which is operated by the Jet Propulsion Laboratory, California Institute of Technology, under contract with the National Aeronautics and Space Administration.References
- Arsenault (1989) Arsenault, R. 1989, A&A, 217, 66
- Block et al. (2001) Block, D. L., Puerari, I., Knapen, J. H., Elmegreen, B. G., Buta, R., Stedman, S., & Elmegreen, D. M. 2001, A&A, 375, 761
- Block et al. (2004) Block, D. L., Buta, R., Knapen, J. H., Elmegreen, D. M., Elmegreen, B. G., & Puerari, I. 2004, AJ, 128, 183
- Boker, Forster-Schreiber, & Genzel (1997) Böker, T., Förster-Schreiber, N. M., & Genzel, R. 1997, AJ, 114, 1883
- Böker et al. (1999) Böker, T., Calzetti, D., Sparks, W., et al. 1999, ApJS, 124, 95
- Bosma, van der Hulst, & Sullivan (1977) Bosma, A., van der Hulst, J. M., & Sullivan, W. T. 1977, A&A, 57, 373
- Buta & Block (2001) Buta, R., & Block, D. L. 2001, ApJ, 550, 243
- Buta, Block, & Knapen (2003) Buta, R., Block, D. L., & Knapen, J. H. 2003, AJ, 126, 1148
- (9) Buta, R., & Combes, F. 1996, Fund. Cosmic Phys., 17, 95
- Buta & Crocker (1993) Buta, R., & Crocker, D. A. 1993, AJ, 105, 1344
- de Vaucouleurs et al. (1991) de Vaucouleurs, G., de Vaucouleurs, A., Corwin, J. R., et al. 1991, Third reference catalogue of Bright galaxies (New York: Springer-Verlag; RC3)
- Elmegreen ( 1987) Elmegreen, D. M., & Elmegreen, B. G. 1987, ApJ, 314, 3
- Erwin & Sparke (2002) Erwin, P., & Sparke, L. S. 2002, AJ, 124, 65
- Eskridge et al. (2000) Eskridge, P. B., Frogel, J. A., Pogge, R. W., et al. 2000, AJ, 119, 536
- Heller & Shlosman (1996) Heller, C. H., & Shlosman, I. 1996, ApJ, 471, 143
- Ho, Filippenko, & Sargent (1997) Ho, L. C., Filippenko, A. V., & Sargent, W. L. W. 1997, ApJS, 112, 315
- Hunt & Malkan (1999) Hunt, L. K. & Malkan, M. A. 1999, ApJ, 516, 660
- Kennicutt (1998) Kennicutt, R. C. 1998, ARA&A, 36, 189
- Kennicutt, Edgar, & Hodge (1989) Kennicutt, R. C., Edgar, B. K., & Hodge, P. W. 1989, ApJ, 337, 761
- Knapen et al. (1995) Knapen, J. H., Beckman, J. E., Heller, C. H., Shlosman, I., & de Jong, R. S. 1995, ApJ, 454, 623
- Knapen et al. (2000) Knapen, J. H., Shlosman, I., & Peletier, R. F., 2000, ApJ, 529, 93
- Knapen, Pérez-Ramírez, & Laine (2002) Knapen, J. H., Pérez-Ramírez, D., & Laine, S. 2002, MNRAS, 337, 808
- Knapen, de Jong, Stedman, & Bramich (2003) Knapen, J. H., de Jong, R. S., Stedman, S., & Bramich, D. M. 2003, MNRAS, 344, 527 (Erratum MNRAS, 346, 333, 2003; Paper I)
- (24) Knapen J. H., Stedman, S., Bramich, D. M, Folkes, S. L., & Bradley, T. R. 2004a, A&A, in press (astro-ph/0408434; Paper II)
- (25) Knapen, J. H., Whyte, L. F., de Blok, W. J. G., & van der Hulst, J. M. 2004b, A&A, 423, 481
- Laine et al. (2001) Laine, S., Knapen, J. H., Pérez-Ramírez, D., Englmaier, P., & Matthias, M. 2001, MNRAS, 324, 891
- Laine, Shlosman, Knapen, & Peletier (2002) Laine, S., Shlosman, I., Knapen, J. H., & Peletier, R. F. 2002, ApJ, 567, 97
- Laurikainen & Salo (2002) Laurikainen, E. & Salo, H. 2002, MNRAS, 337, 1118
- Laurikainen, Salo, & Buta (2004) Laurikainen, E., Salo, H., & Buta, R. 2004, ApJ, 607, 103
- Lynds ( 1974) Lynds, B. T., 1974, ApJS, 28, 391
- Maoz et al. (1996) Maoz, D., Filippenko, A. V., Ho, L. C., Macchetto, F. D., Rix, H., & Schneider, D. P. 1996a, ApJS, 107, 215
- Maoz et al. (1996) Maoz, D., Barth, A. J., Sternberg, A., Filippenko, A. V., Ho, L. C., Macchetto, F. D., Rix, H.-W., & Schneider, D. P. 1996b, AJ, 111, 2248
- Maoz et al. (2001) Maoz, D., Barth, A. J., Ho, L. C., Sternberg, A., & Filippenko, A. V. 2001, AJ, 121, 3048
- Martin & Belley (1997) Martin, P. & Belley, J. 1997, A&A, 321, 363
- Mihos & Hernquist (1996) Mihos, J. C. & Hernquist, L. 1996, ApJ, 464, 641
- Moellenhoff, Matthias, & Gerhard (1995) Möllenhoff, C., Matthias, M., & Gerhard, O. E. 1995, A&A, 301, 359
- Mulchaey & Regan (1997) Mulchaey, J. S., & Regan, M. W. 1997, ApJ, 482, L135
- Paturel et al. (2003) Paturel, G., Petit, C., Prugniel, P., Theureau, G., Rousseau, J., Brouty, M., Dubois, P., & Cambrésy, L. 2003, A&A, 412, 45
- Pogge (1989a) Pogge, R. W. 1989a, ApJ, 345, 730
- Pogge (1989b) Pogge, R. W. 1989b, ApJS, 71, 433
- Pogge & Eskridge (1987) Pogge, R. W., & Eskridge, P. B. 1987, AJ, 93, 291
- Pogge & Eskridge (1993) Pogge, R. W., & Eskridge, P. B. 1993, AJ, 106, 1405
- (43) Sandage, A. 1961, The Hubble Atlas of galaxies (Washington, DC: Carnegie Institution of Washington)
- Schmitt (2001) Schmitt, H. R. 2001, AJ, 122, 2243
- Scoville, Matthews, Carico, & Sanders (1988) Scoville, N. Z., Matthews, K., Carico, D. P., & Sanders, D. B. 1988, ApJ, 327, L61
- Sérsic & Pastoriza (1967) Sérsic, J. L., & Pastoriza, M. 1967, PASP, 79, 152
- Shaw, Combes, Axon, & Wright (1993) Shaw, M. A., Combes, F., Axon, D. J., & Wright, G. S. 1993, A&A, 273, 31
- (48) Shlosman, I. 1999, in ASP Conf. Ser. 187, The Evolution of Galaxies on Cosmological Timescales, eds. J. E. Beckman, & T.J. Mahoney (San Francisco: Astronomical Society of the Pacific), 100
- (49) Shlosman, I., Frank, J., & Begelman, M.C. 1989, Nature 338, 45
- Thronson et al. (1989) Thronson, H. A., Hereld, M., Majewski, S., et al. 1989, ApJ, 343, 158
- Tully (1988) Tully, R. B. 1988, Nearby galaxies catalog (Cambridge: Cambridge University Press)
- van der Kruit (1976) van der Kruit, P. C. 1976, A&A, 52, 85
- Wong & Blitz (2000) Wong, T., & Blitz, L. 2000, ApJ, 540, 771