The variable cyclotron line in GX 3012
We present pulse phase resolved spectra of the hypergiant high mass X-ray binary GX 3012. We observed the source in 2001 October with RXTE continuously for a total on-source time of almost 200 ksec. We model the continuum with both, a heavily absorbed partial covering model and a reflection model. In either case we find that the well known cyclotron resonant scattering feature (CRSF) at 35 keV is – although present at all pulse phases – strongly variable over the pulse: the line position varies by 25% from 30 keV in the fall of the secondary pulse to 38 keV in the fall of the main pulse where it is deepest. The line variability implies that we are seeing regions of magnetic field strength varying between G and G.
Key Words.:
X-rays: stars – stars: magnetic fields – stars: pulsars: individual: GX 301-2e-mail: kreyken@astro.uni-tuebingen.de
1 Introduction
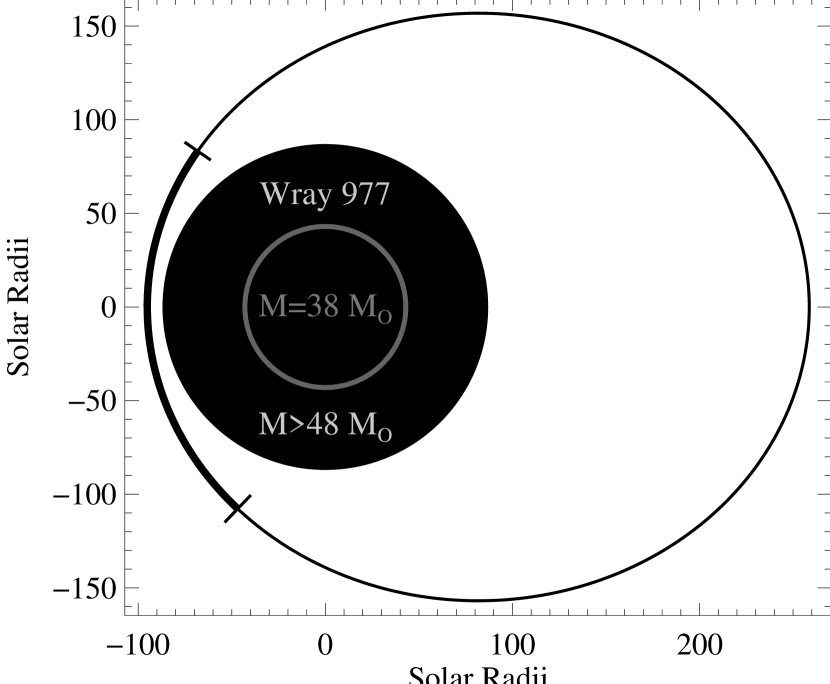
GX 301$-$2 (4U 122362) is a High Mass X-ray Binary system consisting of a neutron star accreting from the strong stellar wind of the early type B-emission line star Wray 977. Due to difficulties in classifying Wray 977, the system parameters are rather uncertain. In a detailed analysis, Kaper et al. (1995) classified Wray 977 as a B1 Iae+ hypergiant at a distance of 5.3 kpc; we will adopt these values throughout this paper. If this classification is correct, Wray 977 is one of the most luminous and massive stars in our galaxy, with a luminosity of and a mass in excess of 48 (best fit 75 ). With one of the highest known wind mass loss rates in the Galaxy (), the very slow wind () can easily feed the neutron star with enough material to explain the observed X-ray luminosity of . We note that Koh et al. (1997) doubt these extreme parameters for Wray 977 as they are only barely compatible with their analysis, and argue that the earlier distance of 1.8 kpc (Parkes et al., 1980) and a spectral type of B2 Iae is correct, with a correspondingly reduced luminosity of the Be primary. Even with these more moderate parameters, however, the system is unique. Note that the following analysis does not depend on the detailed choice of system parameters.

The neutron star is in an eccentric () orbit with a period of days (Koh et al., 1997; Sato et al., 1986). Due to the violent wind accretion the source is extremely variable – X-ray luminosity changes of a factor of five within one hour being common (Rothschild & Soong, 1987). The underlying orbital variability, however, always follows the same pattern (Fig. 1): Shortly before periastron passage, the neutron star intercepts the gas stream from Wray 977 (Leahy, 1991, 2002), resulting in an extended X-ray flare during which the luminosity increases by a factor of 25 (see Fig. 1 and Pravdo et al., 1995). During periastron passage, the neutron star passes through the dense inner wind of Wray 977, above the stellar surface (see Pravdo & Ghosh, 2001, and Fig. 2), and the X-ray activity decreases until it reaches a minimum after the periastron passage. This behavior is probably due to the neutron star being almost eclipsed by Wray 977 (Leahy, 2002) and an intrinsically lower luminosity compared to the flare. Following this minimum, the X-ray luminosity increases slowly again over the orbit with a possible second maximum near apastron, where the neutron star intercepts the spiral shaped gas stream from Wray 977 a second time (Leahy, 2002).

Using the Rossi X-ray Timing Explorer (RXTE) we observed GX 3012 starting in 2000 October (JD 2451829.8 to JD 2451868.3) covering the greater part of the pre-periastron flare and the complete periastron passage in one contiguous 200 ksec long observation (Fig. 3). We used the same procedures as in our earlier analysis of RXTE data from Vela~X-1 (Kreykenbohm et al., 2002). Due to the improved calibration of the Proportional Counter Array (PCA), the systematic uncertainties associated with the PCA differ with respect to our earlier work (compare Table 1 and Kreykenbohm et al., 2002, Table 1). All analysis was done using FTOOLS 5.2 and XSPEC 11.2.0au (Arnaud, 1996). Phase resolved spectra were produced with a modified version of the FTOOL fasebin, which properly accounts for the HEXTE dead time (Kreykenbohm et al., 2002).
The remainder of this paper is structured as follows. In Sect. 2 we discuss the pulse period and pulse profiles. Sect. 3 discusses the different possible spectral models and detailed fits to phase resolved spectra with special emphasis on the behavior of the cyclotron line. We summarize our results in Sect. 4.
| Channels | Energy | Systematics |
|---|---|---|
| 0–15 | 2–8 keV | 1.0% |
| 16–39 | 8–18 keV | 0.5% |
| 40–57 | 18–29 keV | 2.0% |
| 58–128 | 29–120 keV | 5.0% |
2 Pulse profiles
With a pulse period of 700 sec (Swank et al., 1976), GX 3012 is one of the slowest pulsars known. Since the first measurement of the period with Ariel-5 (White et al., 1976), it has undergone dramatic variations: the period was stable at 700 sec until 1984, then the pulsar was spun up between 1985 and 1990 (Koh et al., 1997; Bildsten et al., 1997) to a period of 675 sec. In 1993, the spin behavior reversed (Pravdo & Ghosh, 2001) and the pulsar has since been spinning down almost continously: we determined the pulse period of our observation (JD 2451830.8) to be 684.2 sec (see below). These long lasting spin-up and spin-down trends are in favor of GX 3012 being predominantly a disk accreting system. Similar to other HMXB systems like Vela X-1, however, the pulse to pulse variations are very strong and the overall short term evolution of the pulse period is best described by a random walk model as is typical for a wind accretor (de Kool & Anzer, 1993).
To obtain pulse profiles, the bin (PCA) or photon arrival (HEXTE) times were first barycentered and then corrected for the orbital motion of GX 3012 using the ephemeris of Koh et al. (1997). We used epoch folding (Leahy et al., 1983) to determine the pulse period during the periastron passage to be sec, thus confirming that GX 3012 is continuing its spin down.
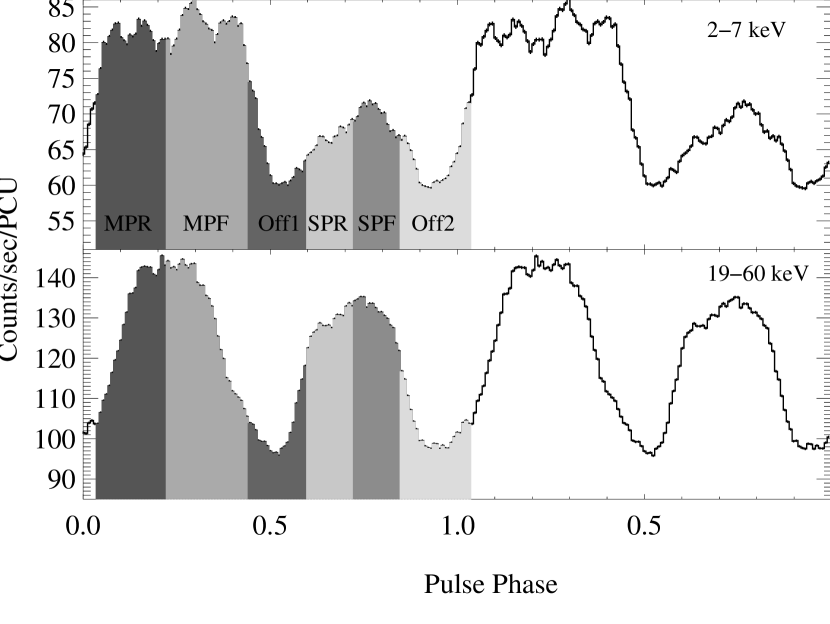
We used this period to create energy resolved pulse profiles. The long period, the pulse to pulse variations, and the strong variability of the source exacerbate the determination of a pulse profile. In our case, GX 3012 is brighter by a factor of more than ten during the pre-periastron flare compared to the low during the actual periastron passage (Fig. 3). We therefore created several sets of energy resolved pulse profiles using PCA-data: For the first set we used data taken during the flare only (see Fig. 4), while we used data from the low and directly after the pre-periastron flare for the second and third set (Fig. 5). In general, the average pulse profile of GX 3012 is very well defined and similar to that of Vela X-1: it consists of two strong pulses at higher energies evolving into a more complex shape with substructures below 12 keV. As one of the peaks is stronger in all energy bands than the other, we designate this peak as the main pulse and the weaker peak as the secondary pulse. The secondary peak is strongly energy-dependent: it is very weak (compared to the main pulse) at energies below 10 keV. At energies above 20 keV it is significantly stronger, in fact, almost as strong as the main pulse. At these higher energies, the profile is approximately sinusoidal; however, the main pulse remains stronger throughout the energy band covered here. Also similar to Vela X-1 is that the long term pulse profile is very stable. There are, however, significant short term variations.

The interpretation of this energy dependence of the pulse profile is not straightforward. Above 20 keV, the sinusoidal pulse shape can be attributed to contributions from the two magnetic poles of the neutron star. It has been argued that anisotropic propagation of the X-rays in the magnetized plasma of the accretion column (Nagel, 1981) or a complicated configuration of the magnetic field (Mytrophanov & Tsygan, 1978) could produce the complex pulse profile at lower energies as well. Alternatively, in analogy to Vela X-1, which also shows a strong energy dependence of the pulse profile (Kreykenbohm et al., 1999, 2002), increased photoelectric absorption or the accretion column passing through the line of sight can also be invoked to explain the observed profiles (Nagase et al., 1983). Due to the large and Compton thick absorbing column during the flare (, see below) it seems more likely that this latter explanation holds for GX 3012 as well. To investigate the causes of the pulse profile variations, a detailed spectroscopic analysis of the pulse phase resolved X-ray spectrum is required.
3 Phase resolved spectra
3.1 Introduction
As mentioned above, in the standard picture of accreting X-ray pulsars the strong magnetic field of the neutron star couples to the infalling material and channels it onto the two magnetic poles where two hot spots emerge (Burnard et al., 1991). If the magnetic axis is offset from the rotational axis, the rotation of the neutron star gives rise to pulsations (Davidson & Ostriker, 1973). The X-ray spectrum observed from the accretion column and the hot spot has generally been modeled as an exponentially cutoff power law, which is modified by strongly varying photoelectric absorption from the accretion stream or the stellar wind at low energies (White et al., 1980, 1983). Furthermore, an Fe K fluorescence line is observed at 6.4 keV. Swank et al. (1976) also observed an iron edge near 7 keV.
The strong magnetic field () at the neutron stars’ magnetic poles leads to the formation of cyclotron resonant scattering features (CRSFs, “cyclotron lines”). These lines result from resonant scattering of electrons in Landau levels in the magnetic field of neutron star (see Coburn et al., 2002; Araya & Harding, 1999; Mészáros & Nagel, 1985, and references therein). The energy of the feature is nominally given by
| (1) |
where is the centroid energy of the CRSF, is the gravitational redshift at the scattering site (if the scattering occurs at the surface of the neutron star, , depending on the equation of state), and the magnetic field strength. The energy of the fundamental CRSF thus gives a direct measure of the magnetic field strength in the line forming region.
Since the physical conditions are expected to vary over the emission region, the X-ray spectrum is expected to change with the viewing angle and therefore with pulse phase. This change is especially important when analyzing CRSFs since their shape depends strongly on the viewing angle (Araya-Góchez & Harding, 2000; Araya & Harding, 1999; Isenberg et al., 1998a), thus making a spectrum averaged over the whole pulse period difficult to interpret. We therefore analyzed the data from GX 3012 using six phase intervals as defined in Fig. 5: the rise and fall of the main pulse, the rise and fall of the secondary pulse, and the two pulse minima. These intervals were chosen to give a good coverage of the pulse with a similar signal to noise ratio.
3.2 The spectral model
The lack of theoretical models of high enough quality for comparison with observational data forces the use of empirical spectral models for the characterization of the observed continuum (Kreykenbohm et al., 1999). Here, we describe the continuum produced in the accretion column of the neutron star, , by a power law with photon index which is cutoff by the Fermi-Dirac cutoff (Tanaka, 1986),
| (2) |
where is a normalization constant, and where and are called the cutoff and folding energy of the Fermi-Dirac cutoff. This continuum shape is then modified by a CRSF modeled as an absorption line with a Gaussian optical depth profile (Coburn et al., 2002, Eqs. 6 and 7),
| (3) |
where is the energy, the width, and the depth of the CRSF. The shape of this absorption line is simpler than the pseudo-Lorentzian line shape (as used by the XSPEC model CYCLABS and in earlier works; see, e.g., Makishima & Ohashi, 1990) and gives equally good fits. The overall X-ray spectrum emitted by the neutron star is then given by
| (4) |
where is the continuum before scattering as given by, e.g., Eq. 2. Due to the strong stellar wind of Wray 977, however, the observed X-ray spectrum of GX 3012 is strongly modified by photoelectric absorption, especially during times when the neutron star is close to Wray 977, such as in our observation. As the material enshrouding the neutron star is most likely clumpy, we expect (part of) the neutron star’s X-rays to be strongly absorbed close to the neutron star ( in Eq. 5). Furthermore, all X-rays emerging from this zone will also be subject to photoelectric absorption in the overall stellar wind of Wray 977 ( in Eq. 5). A model describing such a physical situation is the absorbed partial covering model, which has the form
| (5) |
where is the bound free absorption cross section per Hydrogen atom (Wilms et al., 2000), and are the column densities of the two components, and is the covering fraction of the absorber responsible for . The possibility of a fluorescent Fe K line is accounted for by a Gaussian emission line, .
A second possible scenario takes into account that during periastron passage the neutron star is extremely close to the surface of Wray 977. A large fraction of the neutron star’s X-rays are thus intercepted by Wray 977 where they are backscattered by Thomson scattering or absorbed. This situation is analogous to the Compton reflection hump observed in active galactic nuclei (Lightman & White, 1988). In principle, the X-rays backscattered from within the atmosphere of Wray 977 could be responsible for a significant part of the total observed X-ray flux. A model describing this physical situation has the form
| (6) |
where all symbols are as described above and where describes the spectrum resulting from Compton reflecting X-rays with spectral shape off gas with covering factor (Magdziarz & Zdziarski, 1995). Again, this spectrum is photoabsorbed in the strong stellar wind of Wray 977.
We note that these two pictures are not exclusive: the accretion stream might well be patchy close to the neutron star, and the X-ray spectrum emerging from the accretion stream would then be reprocessed in the atmosphere of Wray 977. Detailed spectral fitting shows, however, that applying either of the above models already results in . Combining the partial covering model and the reflection model is therefore not necessary. With the available spectral data alone, it is not possible to test which of the two continuum models is the more realistic one – the absorption column of the partial covering model is so high that it mimics the features of the soft end of the reflection spectrum (note that the shape of the reflection spectrum below 10 keV is essentially identical to the shape of the incident continuum, absorbed by a column equivalent to one Thomson optical depth). Since the major aim of this work is the study of the cyclotron line, which is not affected by the details of the modeling of the continuum below 10 keV, we will concentrate our discussion in the remainder of this paper on the behavior of the source as reflected in the fits of the absorbed partial covering model (Table 4). The corresponding fit parameters from the reflection model are listed in Table 4.
To allow the comparison of the spectral shape used here with other parameterizations of the continuum, we also modeled the data with several other standard pulsar continua (with and without a CRSF), especially using the high energy cutoff (White et al., 1983, see Table 2). Residuals for these continua for the rise of the secondary pulse are shown in Fig. 6. In this pulse region (phase region SPR, see Fig.5) the CRSF is very prominent such that the data are especially suited to illustrate the difficulties of the standard spectral models.

| Parameter | HEC | SHEC | SHEC + CRSF |
|---|---|---|---|
| 26.4 | 17.2 | 16.9 | |
| 0.14 | -0.32 | -0.34 | |
| [keV] | 19.86 | 18.43 | 18.22 |
| [keV] | 6.08 | 5.29 | 5.44 |
| Fe [keV] | 6.50 | 6.47 | 6.46 |
| Fe- [keV] | 0.25 | 0.38 | 0.38 |
| – | – | 0.14 | |
| [keV] | – | – | 34.9 |
| – | – | 3.4 | |
| (dof) | 1620.4 (64) | 157.1 (61) | 99.9 (58) |

3.3 Spectral fits
Since the source is extremely variable, we accumulated phase resolved spectra not only for the whole data set, but separately also for the pre-periastron flare and the low following the flare. With a total usable exposure time of 176 ks for PCA and 89 ks live time for HEXTE the phase resolved spectra from the whole data set provide excellent statistical quality (note that the exposure time in HEXTE is typically lower by 40% due to the dead time of the instrument; during our observation, the orbit of RXTE was very close to the South Atlantic Anomaly thus giving rise to an increased particle background resulting in a deadtime of about 50% in the HEXTE). In the following paragraphs, we will use this complete dataset for our analysis. See Tables 4 and 4 for a list of the spectral parameters.
The total usable exposure time during the flare is 25 ksec for PCA and 12 ksec for HEXTE. Even though this is much shorter than that of the whole observation, the flare spectra dominate over the rest of the observation due to the much higher flux during the flare. Since the low luminosity post periastron data have a much lower statistical quality, the uncertainties of all parameters from this time are fairly large and the CRSF could not be detected in any phase region with high significance.
Since the data from the flare are very similar to the data from the complete set we only discuss the spectral parameters for the complete data set (unless mentioned otherwise). The data from the extended low following the pre-periastron flare (see Fig. 1 and Fig. 3) have a low statistical quality and are therefore not discussed in detail.
3.3.1 The X-ray spectrum below 10 keV
As is expected from the physical picture outlined in Sect. 3.2, the spectral parameters identified with the stellar wind – , , and the parameters of the Fe K line – do not depend significantly on the pulse phase as they originate very far away from the neutron star compared to the accretion column where the X-rays and the pulse forms.
The high column density of the stellar wind as measured during the whole observation, indicates how deep the neutron star is embedded in the wind. With a column density of as high as , the second component of the partial covering model is close to being Compton thick. As explained above, this large value is responsible for our inability to differentiate between the partial covering model and the Compton reflection model.
In the low following the pre-periastron flare, the absorbing columns are measured to be even higher. The column density for the “weakly” absorbed component, , varies between and and is thus twice as large as during the flare, and also the column density is increased: it varies between to over . However, the observed count rate is not only due to the strong photoelectric absorption but also due to an intrinsically lower source luminosity: while the unabsorbed flux during the flare is about erg s-1, the absorbed flux, however, is erg s-1. During the low the unabsorbed flux is lower by a factor of three ( erg s-1) and the absorbed flux by a factor of more then six ( ergs s-1).
The high column density of the wind is also responsible for the strong Fe K fluorescence line. The line energy of , corresponding to an ionization level from Fe v to Fe ix, implies that the iron, and thus probably all circumstellar material, is mildly ionized. The width of the line, , is close to the energy resolution of the PCA, the very small uncertainties indicate that the line width is indeed measured.
3.3.2 The pulsar continuum and the cyclotron line
Pulse phase spectroscopy allows us to study the variation of the pulsar emission over the X-ray pulse. Our data analysis shows that the photon index is almost constant over the pulse and only varies between and . Note that the spectrum is slightly but systematically softer in all phase bins during the pre-periastron flare. The parameters of the cutoff also do not vary over the pulse: The folding energy is only variable between 5.0 keV and 5.9 keV, while the cutoff energy is consistent with a constant value of 15.5 keV except for the rise of the main pulse where it is marginally lower ().
This continuum model alone, however, does not result in an acceptable fit in any of the phase bins (see e.g., Fig. 7b). In all phase bins a large absorption line like structure is present between 30 keV and 40 keV (see Fig. 9). After the inclusion of a CRSF, the fits are acceptable in all phase bins with (see Tables 4 and 4). The improvement is extremely significant: according to the -Test (Bevington & Robinson, 1992)111Note that in even if systematic uncertainties are not an issue, however, the extremely low false alarm probabilities make the detection of the line stable against even crude mistakes in the computation of the significance. the probability of a chance improvement is in the fall of the secondary pulse (the bin with the smallest improvement). We remark that the CRSF is found at almost the same energy and the same width (within uncertainties), but with a higher when using the SHEC model applied in earlier publications (compare Tables 2 and 4).
Contrary to the continuum, the depth and the position of the CRSF (see Eq. 3 for definition of the CRSF parameters) are strongly variable with pulse phase (see Tables 4, 4, and Fig 10). This behavior is fairly typical of most CRSF sources (e.g., Vela X-1 or Her~X-1). We find that the line is deepest in the minimum between the main pulse and the secondary pulse (phase bin OFF1) with , and it is also of comparable depth in the adjacent phase bins, the fall of the main pulse (MPF, ) and the rise of the secondary pulse (SPR, ). While the depth of the CRSF in these three phase bins has a lower limit of 0.20, the CRSF is significantly less deep in the other three phase bins. At the same time, the position of the CRSF changes from in the fall of the secondary pulse and keV at the rise of the main pulse to significantly higher energies in the fall of the main pulse and the pulse minimum, where it becomes as high as (Fig. 10). Assuming a canonical mass of 1.4 and a radius of 10 km for the neutron star, the typical gravitational redshift amounts to 29% at the surface of the neutron star, such that the measured values imply a magnetic field between G and G for GX 3012.
This change of the CRSF energy is correlated with its depth: the line is deepest in the phase bins where the CRSF is at the highest energies (correlation coefficient ). Note that this behavior is not due to the intrinsically lower signal during the interpulse: during the fall and the rise of the main pulse, where the data are of comparable statistical quality (and the source has a similar flux), we find a significant difference of the spectral parameters. We finally note that the line width of the CRSF is always in the range from 3 keV to 7 keV, typical for CRSFs at these energies.


| Phase | [keV] | [keV] | [keV] | [keV] | [keV] | (dof) | Flux | |||||||
|---|---|---|---|---|---|---|---|---|---|---|---|---|---|---|
| MPR | 22.7 | 268.5 | -0.12 | 9.9 | 5.78 | 6.48 | 0.31 | – | – | – | 255.0 | ( 62) | 4.11 | |
| MPR + CRSF | 22.2 | 249.0 | -0.05 | 12.8 | 5.88 | 6.48 | 0.33 | 0.10 | 31.0 | 3.5 | 73.9 | ( 59) | 1.25 | 1.87 |
| MPF | 21.8 | 265.1 | 0.07 | 15.8 | 5.44 | 6.48 | 0.33 | – | – | – | 364.2 | ( 62) | 5.87 | |
| MPF + CRSF | 22.5 | 242.8 | 0.06 | 15.0 | 5.93 | 6.48 | 0.34 | 0.29 | 38.0 | 6.1 | 50.4 | ( 59) | 0.85 | 1.93 |
| OFF1 | 22.6 | 249.6 | 0.03 | 16.1 | 5.09 | 6.49 | 0.34 | – | – | – | 140.6 | ( 62) | 2.27 | |
| OFF1 + CRSF | 22.6 | 230.7 | -0.18 | 16.3 | 5.52 | 6.50 | 0.34 | 0.33 | 37.3 | 7.6 | 42.4 | ( 59) | 0.72 | 1.37 |
| SPR | 20.5 | 218.8 | -0.19 | 16.2 | 4.97 | 6.49 | 0.33 | – | – | – | 251.7 | ( 62) | 4.06 | |
| SPR + CRSF | 20.8 | 211.0 | -0.21 | 15.2 | 5.35 | 6.49 | 0.33 | 0.25 | 35.2 | 5.1 | 56.0 | ( 59) | 0.95 | 1.47 |
| SPF | 20.0 | 234.0 | -0.34 | 12.8 | 5.29 | 6.48 | 0.32 | – | – | – | 176.8 | ( 62) | 2.85 | |
| SPF + CRSF | 20.2 | 204.0 | -0.25 | 15.0 | 5.39 | 6.49 | 0.33 | 0.10 | 30.0 | 3.0 | 77.8 | ( 59) | 1.32 | 1.52 |
| OFF2 | 21.7 | 267.0 | -0.11 | 13.3 | 5.12 | 6.50 | 0.33 | – | – | – | 170.2 | ( 62) | 2.74 | |
| OFF2 + CRSF | 22.7 | 244.6 | -0.03 | 14.1 | 5.30 | 6.50 | 0.34 | 0.14 | 31.9 | 4.0 | 51.0 | ( 59) | 0.86 | 1.31 |
| Phase | [] | [keV] | [keV] | Refl | [keV] | [keV] | [keV] | (dof) | Flux | |||||
|---|---|---|---|---|---|---|---|---|---|---|---|---|---|---|
| MPR | 21.0 | 0.07 | 10.4 | 6.74 | -3.5 | 6.48 | 0.35 | – | – | – | 234.8 | ( 60) | 3.91 | |
| MPR+CRSF | 21.2 | 0.09 | 12.8 | 6.67 | -2.6 | 6.47 | 0.35 | 0.14 | 31.8 | 2.2 | 79.1 | ( 63) | 1.26 | 1.87 |
| MPF | 22.0 | 0.20 | 17.2 | 5.98 | -1.7 | 6.47 | 0.36 | – | – | – | 356.9 | ( 60) | 5.95 | |
| MPF+CRSF | 21.6 | 0.13 | 15.1 | 6.49 | -1.9 | 6.47 | 0.36 | 0.28 | 38.7 | 4.7 | 51.0 | ( 63) | 0.81 | 1.93 |
| OFF1 | 21.7 | 0.14 | 16.9 | 5.65 | -2.2 | 6.49 | 0.36 | – | – | – | 125.6 | ( 60) | 2.09 | |
| OFF1+CRSF | 21.8 | 0.12 | 15.6 | 6.16 | -2.5 | 6.49 | 0.35 | 0.28 | 38.8 | 6.3 | 49.7 | ( 63) | 0.79 | 1.37 |
| SPR | 19.9 | -0.11 | 16.1 | 5.57 | -2.5 | 6.48 | 0.33 | – | – | – | 222.5 | ( 60) | 3.71 | |
| SPR+CRSF | 19.8 | -0.13 | 14.8 | 5.91 | -2.8 | 6.48 | 0.33 | 0.29 | 35.6 | 2.9 | 55.5 | ( 63) | 0.88 | 1.47 |
| SPF | 18.9 | -0.24 | 11.8 | 6.08 | -3.3 | 6.48 | 0.33 | – | – | – | 144.6 | ( 60) | 2.41 | |
| SPF+CRSF | 19.1 | -0.23 | 13.3 | 6.03 | -2.6 | 6.47 | 0.33 | 0.09 | 32.0 | 0.9 | 82.9 | ( 63) | 1.32 | 1.52 |
| OFF2 | 21.1 | 0.08 | 15.0 | 5.86 | -3.2 | 6.49 | 0.36 | – | – | – | 158.5 | ( 60) | 2.64 | |
| OFF2+CRSF | 21.5 | 0.10 | 15.4 | 5.96 | -2.9 | 6.49 | 0.35 | 0.14 | 32.5 | 3.1 | 55.7 | ( 63) | 0.88 | 1.31 |
As we illustrate in Fig. 9, in addition to the changes of the depth and position of the CRSF, there are indications for a change in the shape of the feature itself. After fitting the CRSF in the rise of the main pulse some residuals remain (see Fig. 8), indicating that the CRSF has a non-Gaussian line shape. Furthermore, the remaining residuals at 50 keV could indicate the presence of an emission wing. The existence of such emission wings and overall variations of the line profile over the pulse have been predicted by the numerical simulations of Araya & Harding (1999).
We also searched for any yet undetected second CRSF. As the addition of a second CRSF at any energy does not improve the fit, we tried to force an additional CRSF on the best fit at twice or half the energy of the 35 keV CRSF, especially in the phase bins where the is like the rise of the main pulse. A line between 15 keV and 20 keV can be excluded with very high confidence: the upper limit for the depth of a line in this energy range is less than . A CRSF at twice the energy (between 60 keV and 80 keV) can not be excluded with such a high confidence, but it is still very unlikely that there is a secondary line present; the upper limit for the depth of such a line is 0.3, which given the low statistical quality of the data at 70 keV is very low. Typical line depths in this regime are expected to be 1.0: a CRSF with a depth of 0.3 and a width of 4 keV can be fitted almost everywhere above 70 keV without affecting the resulting significantly. Therefore, we conclude that no other CRSF is present in the data; we caution, however, that the source is only weakly detected above 60 keV and therefore we cannot exclude the presence of a feature in this energy range.
4 Summary and discussion
4.1 CRSF Variability
The major result of this paper is the observation of a variation of the energy of the cyclotron line by almost 8 keV (corresponding to about 25%) from in the fall of the secondary pulse to in fall of the main pulse. This large variation is similar to that found in several other sources, such as 4U~1626$-$67 (Heindl & Chakrabarty, 1999) with a variation of 25%, 4U~0115$+$63 with a variation of 20% in the harmonic (Heindl et al., 1999; Santangelo et al., 1999), Cen~X-3 with a variation of 30% (Burderi et al., 2000), or Her~X-1 with 25% (Gruber et al., 2001, 1980). On the other hand, the energies of the CRSFs in Vela X-1 varies only by 10% with pulse phase (Kreykenbohm et al., 2002). Consistent with earlier interpretations, the strong energy variation of the cyclotron line in GX 3012 argues that during different phases of the X-ray pulse, regions with different magnetic fields are observed. There are several plausible scenarios for such a suggestion.
First consider a simple scenario that we observe an accretion column in a pure dipole field. In such a case the observed 25% change of the cyclotron line energy would translate into a change in the height of the scattering region of 5 km (or 50% of the neutron star radius). Such a change is rather unlikely, given that accretion columns are generally predicted to have heights of less than 1 km (Burnard et al., 1991; Becker, 1998; Brown & Bildsten, 1998). Apart from these theoretical considerations, a very tall accretion column would also imply a rather uncommon magnetic field configuration for GX 3012: For a 5 km high accretion column, the emission pattern is very likely a pure fan beam. To entirely block the lower parts of the accretion column such that the X-ray spectrum is dominated by the “top” of the column requires that the angle between the magnetic field axis and the spin axis, , is at least , and larger if relativistic light bending is included. Detailed models for the emission pattern of XRBs, which include relativistic light propagation (Kraus et al., 1996; Blum & Kraus, 2000), as well as the statistical analysis of accreting neutron star pulse profiles (Bulik et al., 2003), however, imply . We conclude, therefore, that the accretion column of GX 3012 is much lower than what would be expected if the variation of were due to a pure dipole field geometry.
A second possibility for the cyclotron line variability, which has been discussed, e.g., for Cen X-3, would be the presence of a very wide polar cap. For a dipole configuration, Burderi et al. (2000) show that an opening angle of the order of is required to produce a 30% variation of the line energy. Such a large polar cap, however, is unlikely to produce the observed X-ray pulse shape – the pulse profile is expected to be much broader in this case. Furthermore, as already noted by Burderi et al. (2000), such large polar caps would imply that the line energy varies symmetrically about the pulse maximum, which is not the case for any of the pulsars with a strong variation of the line energy. Finally, we also note that the strong magnetic field confines the accreting plasma, resulting in a much smaller opening angle of the neutron star’s hot spot (Litwin et al., 2001; Becker, 1998; Basko & Sunyaev, 1976). As a result we conclude that the extended polar cap scenario is an unlikely explanation for the large variation of the energy of the CRSF.
A third and final scenario for the pulse variation is that the observed X-rays come from an accretion mound, as suggested, e.g., by Burnard et al. (1991). In this case the observed variation of the line energy is mainly due to the higher multipole components of the magnetic field in the mound and the X-ray emissivity profile is a combination of a fan and a pencil beam.
Parenthetically, we note that slight variations of the line energy are also predicted for the case of homogeneous magnetic fields, as the location, depth, and shape of the CRSF are predicted to change with viewing angle, i.e., pulse phase (Mészáros & Nagel, 1985; Isenberg et al., 1998b; Araya & Harding, 1999; Araya-Góchez & Harding, 2000). The strongest of these effects are the emission wings of the fundamental CRSF caused by “photon spawning” (Araya & Harding, 1999; Araya-Góchez & Harding, 2000), where electrons excited into a higher Landau level by resonant scattering of a photon, decay into the ground state by emitting photons at an energy which is roughly that of the fundamental CRSF. As a result the fundamental line is predicted to be shallower and have a more complex shape than the higher harmonics. When folded through the HEXTE response matrix, these variable complex line profiles can result in slight changes of the measured line energy. These changes, however, are much smaller than the 25% energy variation seen here, and can thus be excluded as the cause for the observed variation. Nevertheless, the inspection of the residuals of the pulse phase resolved fits indicates a possible change of the shape of the CRSF over the pulse (Fig. 9). Similar to, e.g., 4U 011563 (Heindl et al., 1999; Santangelo et al., 1999), the presence of an unresolved complex structure of the fundamental could be postulated to explain the not fully satisfactory values in some phase bins (e.g., for bin MPR (see Fig. 8), as compared to in the other phase bins). With the increasing energy resolution of modern gamma-ray detectors, it is foreseeable that such profiles will be resolvable with newer instruments such as, e.g., the SPI instrument on INTEGRAL.
4.2 Implications of the Line variability
In recent years, several groups have searched for correlations between the parameters of the CRSF and the X-ray continuum in the hope of deducing information about the line and continuum formation process (Makishima et al., 1999; Coburn, 2001, and references therein). A major disadvantage of these searches, however, has been that they typically used pulse averaged data instead of pulse resolved spectroscopy, complicating the interpretation of the correlations found.
One of the most interesting new correlations found in the large sample of X-ray pulsars observed with RXTE and analyzed in a uniform manner by Coburn (2001) and Coburn et al. (2002) has been between the relative width of the CRSF, , and its depth, . As noted by Coburn et al. (2002), part of the –-plane is inaccessible to RXTE due to observational constraints; however, our data all fall into the range that is well observable. As shown in Fig. 11, our phase resolved results for GX 3012 confirm the overall correlation: deeper CRSFs are generally broader. We note that this agreement between the phase averaged and the phase resolved data suggests that the correlations found by Coburn et al. (2002) from the phase averaged data are indeed real and not due to effects of the averaging.
Having many data points for one object helps in understanding the - correlation in terms of a physical model. As we have outlined in the previous section, it is likely that the X-rays observed from GX 3012 are produced in an accretion mound of moderate height at the magnetic poles of the neutron star. Consider first the case that only one pole is visible. Over the X-ray pulse we view this pole under different viewing angles, , where is the angle between the line of sight and the magnetic field in the accretion column. For the high temperatures of the accretion column, the line width is expected to be dominated by thermal broadening. As shown, e.g., by Mészáros & Nagel (1985), the anisotropic velocity field of the electrons in the accretion column leads to fractional line widths of
| (7) |
where is the temperature of the electrons along the magnetic field lines. Basic Comptonization theory suggests that can be estimated from the folding energy of the pulsar continuum, (e.g., Burderi et al., 2000, and references therein). If we furthermore assume that the seed photons for the Compton upscattering in the accretion column are created throughout the volume of the accretion column, then detailed Monte Carlo simulations, e.g., of Isenberg et al. (1998b) show that the depth of the CRSF is expected to be largest for a slab geometry when the line of sight is almost perpendicular to the direction of the magnetic field. For a uniform temperature accretion column, where is constant, these slab models thus predict an anti-correlation between and , in contradiction to the observation. On the other hand, assuming a cylindrical geometry, the depth of the CRSF is expected to be largest when the line of sight is parallel to the magnetic field (Isenberg et al., 1998b, Fig. 19). This geometry therefore predicts a correlation between and , in good agreement with the observation.
We note, however, that even phase resolved data are difficult to interpret. In the above discussion, we assumed that the observed data are dominated by emission from one homogeneous emission region. In reality, this is not the case and the observed data are generally a mixture of contributions from both magnetic poles, which could influence the observed correlation. While it is difficult to disentangle the contributions from the two poles (Kraus et al., 1996; Blum & Kraus, 2000), it seems likely that the physical conditions at both poles are slightly different. We would then expect the parameters of the X-ray continuum emitted by each pole to be different, which would be reflected by changes in the observed continuum parameters. In GX 3012, however, the continuum parameters as exemplified by are remarkably stable, suggesting either that only one magnetic pole contributes to the observed data, or that the poles have similar temperature. For this reason, it seems unlikely that a mixture of flux from the two poles causes the observed correlation. Given the contradiction of predicted spectra of a slab geometry with the observations, the slab geometry can either be ruled out or additional physical processes are operating.


Finally, we note a second correlation found in our phase resolved data that is also present in the phase average data (Coburn et al., 2002): a correlation between the line width and the energy of the line shown in Fig. 12. In terms of the simple cyclotron line broadening theory of Eq. 7 this correlation is rather unexpected since such a strong correlation (0.93 for GX 3012) is only possible if does not vary appreciably or is close to , where a relativistic treatment of Eqn. 7 is required and becomes independent of . A variation of is required, however, since strong X-ray pulses are observed. For theta close to , however, we would not expect to see strong pulsations, contrary to what is observed. We therefore think that smaller values of theta are more likely. As an example, for , the correlation constrains the viewing angle to vary by around its mean value, tight even in the case of a pure fan beam.
4.3 Summary
To summarize, our analysis of the RXTE data of GX 3012 shows
-
1.
The continuum of GX 3012 is well described by an absorbed and partially covered pulsar continuum model. An alternative explanation for the X-ray spectrum is a reflected and absorbed pulsar continuum. Current data do not allow us to distinguish between these alternatives.
-
2.
GX 3012 shows a strong cyclotron line at an energy of 35 keV. The line energy, depth, and width are variable with the pulse phase and do not depend on the chosen continuum model.
-
3.
The variability of the CRSF energy as well as the pulse profile suggest that the X-rays from GX 3012 originate in an accretion mound, and that the change in energy is not due to a change in height in a dipole field.
-
4.
The correlation between the relative width of the line and its depth is suggestive of changes in the angle between the line of sight and the magnetic field at the neutron star pole, in agreement with the standard paradigm for pulsating X-ray sources, but contradiction with the numerical simulations for the depth of the line for certain geometries.
Acknowledgements.
This work has been financed by DLR grant 50OR0002, DAAD grants for the collaboration with UCSD and the Universidad di Alicante, NASA grants BAS5-10729 and NAS5-30720, and NSF travel grant NSF-INT-0003773.References
- Araya & Harding (1999) Araya, R. A. & Harding, A. K. 1999, ApJ, 517, 334
- Araya-Góchez & Harding (2000) Araya-Góchez, R. A. & Harding, A. K. 2000, ApJ, 544, 1067
- Arnaud (1996) Arnaud, K. A. 1996, in Astronomical Data Analysis Software and Systems V, ed. J. H. Jacoby & J. Barnes, ASP Conf. Ser. 101, San Francisco, 17
- Basko & Sunyaev (1976) Basko, M. M. & Sunyaev, R. A. 1976, MNRAS, 175, 395
- Becker (1998) Becker, P. A. 1998, ApJ, 498, 790
- Bevington & Robinson (1992) Bevington, P. R. & Robinson, D. K. 1992, Data Reduction and Error Analysis for the Physical Sciences (Boston: McGraw-Hill)
- Bildsten et al. (1997) Bildsten, L., Chakrabarty, D., Chiu, J., et al. 1997, Astrophys. J., Suppl. Ser., 113, 367
- Blum & Kraus (2000) Blum, S. & Kraus, U. 2000, ApJ, 529, 968
- Brown & Bildsten (1998) Brown, E. F. & Bildsten, L. 1998, ApJ, 496, 915
- Bulik et al. (2003) Bulik, T., Gondek-Rosińska, D., Santangelo, A., et al. 2003, A&A, 404, 1023
- Burderi et al. (2000) Burderi, L., Di Salvo, T., Robba, N. R., La Barbera, A., & Guainazzi, M. 2000, ApJ, 530, 429
- Burnard et al. (1991) Burnard, D. J., Arons, J., & Klein, R. I. 1991, ApJ, 367, 575
- Coburn (2001) Coburn, W. 2001, Ph.D. Thesis, University of California, San Diego
- Coburn et al. (2002) Coburn, W., Heindl, W. A., Rothschild, R. E., et al. 2002, ApJ, 580, 394
- Davidson & Ostriker (1973) Davidson, K. & Ostriker, J. P. 1973, ApJ, 179, 585
- de Kool & Anzer (1993) de Kool, M. & Anzer, U. 1993, MNRAS, 262, 726
- Gruber et al. (2001) Gruber, D. E., Heindl, W. A., Rothschild, R. E., et al. 2001, ApJ, 562, 499
- Gruber et al. (1980) Gruber, D. E., Matteson, J. L., Nolan, P. L., et al. 1980, ApJ, 240, L127
- Heindl & Chakrabarty (1999) Heindl, W. A. & Chakrabarty, D. 1999, in Highlights in X-ray Astronomy, 25–28
- Heindl et al. (1999) Heindl, W. A., Coburn, W., Gruber, D. E., et al. 1999, ApJ, 521, L49
- Isenberg et al. (1998a) Isenberg, M., Lamb, D. Q., & Wang, J. C. L. 1998a, ApJ, 493, 154
- Isenberg et al. (1998b) —. 1998b, ApJ, 505, 688
- Kaper et al. (1995) Kaper, L., Lamers, H. J. G. L. M., Ruymaekers, E., van den Heuvel, E. P., & Zuiderwijk, E. J. 1995, A&A, 300, 446
- Koh et al. (1997) Koh, D. T., Bildsten, L., Chakrabarty, D., et al. 1997, ApJ, 479, 933
- Kraus et al. (1996) Kraus, U., Blum, S., Schulte, J., Ruder, H., & Mészáros, P. 1996, ApJ, 467, 794
- Kretschmar et al. (1997) Kretschmar, P., Kreykenbohm, I., Wilms, J., et al. 1997, in The Transparent Universe, Proc. 2nd INTEGRAL Workshop, ed. C. Winkler, T. J.-L. Courvoisier, & P. Durouchoux, ESA SP 382, Noordwijk, 141–144
- Kreykenbohm et al. (2002) Kreykenbohm, I., Coburn, W., Wilms, J., et al. 2002, A&A, 395, 129
- Kreykenbohm et al. (1999) Kreykenbohm, I., Kretschmar, P., Wilms, J., et al. 1999, A&A, 341, 141
- Leahy (1991) Leahy, D. A. 1991, MNRAS, 250, 310
- Leahy (2002) —. 2002, A&A, 391, 219
- Leahy et al. (1983) Leahy, D. A., Darbo, W., Elsner, R. F., et al. 1983, ApJ, 266, 160
- Lightman & White (1988) Lightman, A. P. & White, T. R. 1988, ApJ, 335, 57
- Litwin et al. (2001) Litwin, C., Brown, E. F., & Rosner, R. 2001, ApJ, 553, 788
- Magdziarz & Zdziarski (1995) Magdziarz, P. & Zdziarski, A. A. 1995, MNRAS, 273, 837
- Makishima et al. (1999) Makishima, K., Mihara, T., Nagase, F., & Tanaka, Y. 1999, ApJ, 525, 978
- Makishima & Ohashi (1990) Makishima, K. & Ohashi, T. 1990, PASJ, 42, 239
- Mészáros & Nagel (1985) Mészáros, P. & Nagel, W. 1985, ApJ, 298, 147
- Mihara (1995) Mihara, T. 1995, PhD thesis, RIKEN, Tokio
- Mihara et al. (1998) Mihara, T., Makishima, K., & Nagase, F. 1998, in AllSky Monitor Survey Conference, RIKEN, 135–140
- Mytrophanov & Tsygan (1978) Mytrophanov, I. G. & Tsygan, A. I. 1978, A&A, 70, 133
- Nagase et al. (1983) Nagase, F., Hayakawa, S., Makino, F., Sato, N., & Makishima, K. 1983, PASJ, 35, 47
- Nagel (1981) Nagel, W. 1981, ApJ, 251, 278
- Parkes et al. (1980) Parkes, G. E., Mason, K. O., Murdin, P. G., & Culhane, J. L. 1980, MNRAS, 191, 547
- Pravdo et al. (1995) Pravdo, S. H., Day, C. S. R., Angelini, L., et al. 1995, ApJ, 454, 872
- Pravdo & Ghosh (2001) Pravdo, S. H. & Ghosh, P. 2001, ApJ, 554, 383
- Rothschild & Soong (1987) Rothschild, R. E. & Soong, Y. 1987, ApJ, 315, 154
- Santangelo et al. (1999) Santangelo, A., Segreto, A., Giarrusso, S., et al. 1999, ApJ, L85
- Sato et al. (1986) Sato, N., Nagase, F., Kawai, N., et al. 1986, ApJ, 304, 241
- Swank et al. (1976) Swank, J. H., Becker, R. H., Boldt, E. A., et al. 1976, ApJ, 209, L57
- Tanaka (1986) Tanaka, Y. 1986, in Radiation Hydrodynamics in Stars and Compact Objects, ed. D. Mihalas & K.-H. A. Winkler, IAU Coll. 89 (Heidelberg: Springer), 198
- White et al. (1976) White, N. E., Mason, K. O., Huckle, H. E., Charles, P. A., & Sanford, P. W. 1976, ApJ, 209, L119
- White et al. (1980) White, N. E., Pravdo, S. H., Becker, R. H., et al. 1980, ApJ, 239, 655
- White et al. (1983) White, N. E., Swank, J. H., & Holt, S. S. 1983, ApJ, 270, 711
- Wilms et al. (2000) Wilms, J., Allen, A., & McCray, R. 2000, ApJ, 542, 914
- Wilms et al. (1999) Wilms, J., Nowak, M. A., Dove, J. B., Fender, R. P., & Di Matteo, T. 1999, ApJ, 522, 460