11email: mauron@graal.univ-montp2.fr 22institutetext: Laboratoire d’Astrophysique, Observatoire de Grenoble, Université Joseph Fourier, BP 53, F-38041 Grenoble Cedex 09, France 22email: tkendall@obs.ujf-grenoble.fr ††thanks: Based on observations carried out with the European Southern Observatory VLT/UVES, program 70.C-0100
An optical absorption study of the Helix Planetary Nebula
We present the first results of an optical absorption study of NGC 7293, the Helix planetary nebula (PN), designed to search definitively for diffuse band (DIB) absorptions perhaps arising in the carbon-rich circumstellar matter of the PN. We used the VLT-UVES spectrograph to achieve high resolution (R=50000) spectra of 8 stars located angularly close to and behind the Helix. These targets were selected through their photometric UBV or 2MASS properties, permitting derivation of spectral types (mainly F-G dwarfs) and distance that place several of them far (700–1500 pc) beyond the Helix (210 pc). Through a detailed analysis of the Na i and Ca ii lines to the 8 targets, we find that two lines of sight situated close to the nebula as mapped in CO and H i exhibit very strong Na i absorption. This absorption is unlikely to arise in the foreground or background interstellar medium which has a relatively low column density, because the Helix is at high galactic latitude . It is much more probable that it is due to the PN neutral or molecular material. This circumstellar origin is reinforced by the fact that no corresponding Ca ii line is observed (as it would usually be from the ISM), which is in agreement with the very high Ca depletion often observed in PNs. No trace of any DIB features was found in these two circumstellar lines of sight, nor to the other targets. The two circumstellar sightlines discovered in this work open the way to search for molecular species such as C2 which are not observable at radio wavelengths, and to obtain more information on the rich neutral and molecular content of the Helix.
Key Words.:
Stars; individual: NGC 7293 – stars: planetary nebulae – stars: circumstellar matter – ISM: lines and bands – ISM: molecules1 Introduction
The identification of the carriers of the diffuse interstellar bands (DIBs) has proved one of the most difficult problems in observational molecular astrophysics (see Herbig her95 (1995), hereafter H95, for a review). DIBs have been widely observed throughout the interstellar medium (ISM) for nearly a century, but no convincing identification of a carrier has yet been forthcoming. In addition, the origin of the carrier(s) remains unknown. Numerous studies have suggested that DIB carriers are not present in the circumstellar matter of evolved cool O-rich or C-rich stars that inject various dust or molecular compounds into the ISM (Snow sno73 (1973); Snow & Wallerstein snw72 (1972); Zacs et al. zac03 (2003)). However, there are a few exceptions that would certainly deserve further attention, e.g. the unusual 6177 Å band seen in some evolved objects by Le Bertre & Lequeux (leb93 (1993)), or the case of DIBs possibly observed against the A-type companion of the carbon star CS 776 (Le Bertre leb90 (1990); for this object, see also comments in H95 and in Kendall et al. ken02 (2002)).
The initial findings of Scarrott et al. (sca92 (1992)) and Sarre et al. (sar95 (1995)) connecting the optical emission bands in the Red Rectangle (RR) with a subset of well-known DIBs have been qualified recently by Van Winckel et al. (vwi02 (2002)) and Glinski & Anderson (gli02 (2002)) on the basis of e.g. a 2 Å wavelength mismatch between the 5797 DIB in the ISM and the nearby 5800 Å RR emission band. This mismatch remains at the largest observed distances from the central star, leading both authors to conclude that the carriers of the DIB and the RR band are not identical. However, Van Winckel et al. (vwi02 (2002)) also note five further possible matches between DIB wavelengths and RR features, and there certainly exist in the RR molecules closely related to the likely DIB carriers.
A hitherto undisputed fact is that a subset of diffuse bands are also clearly seen in emission in the circumstellar layers of the unusual, carbon rich, R CrB-type variable V854 Cen (Rao & Lambert rao93 (1993)). DIB carriers perhaps exist also in the envelopes of rare, hotter C-rich post-AGB objects (Zacs et al. zac99 (1999); Klochkova et al. klo99 (1999); Klochkova et al. klo00 (2000); Klochkova et al. klo01 (2001)), although this is not certain. A clear-cut case concerning a post-AGB object is HR 4049, which has a carbon-rich envelope; no diffuse band of circumstellar origin could be found in the spectrum of the central hot star (Waters et al. wat89 (1989)). Because it is often thought that large carbon bearing molecules might be the (or one of the) DIB carriers (e.g. H95, Duley dul98 (1998)), every effort is desirable to test this hypothesis by seeking DIBs at carbon-rich sites of origin where these molecules may be abundant.
In a recent paper (Kendall et al. ken02 (2002)), we have pioneered a new observational method using optical absorption spectroscopy of background objects to probe the spatially extended circumstellar envelope (CSE) of the archetypal extreme mass-losing carbon star IRC +10∘ 216. By searching for absorptions against the relatively smooth continua of thick-disk background targets, the method alleviated confusion with photospheric features in the highly complex spectrum of the central, cool, evolved object. These observations showed that DIB carriers are of very low abundance, or non-existent, around IRC +10∘ 216, and we suggested that the DIB carriers might be sought in compact, UV-rich regions where ionised and neutral molecular material interact. Such sites are the circumstellar shells of planetary nebulae (PN), and this paper reports our first attempts to detect DIBs in the Helix PN.
In fact, DIB carriers have already been sought in a few other carbon-rich PN, most notably NGC 7027 (Le Bertre & Lequeux leb92 (1992)) and no circumstellar diffuse bands have been detected. However, it is justified to apply our method of background target spectroscopy to PN and especially to use several lines of sight. This is an important point, since the clear clumpiness and inhomogeneity of typical PN shells means that DIB carriers, and other species, may not be distributed uniformly throughout such shells. Indeed, in cases where only the central star is observed through relatively low density material, the column density may be insufficient for observable absorptions to arise.
Therefore, in this paper, we report the first results of a similar absorption spectroscopy experiment performed using 8 targets seen through, or located angularly very close to, the Helix. As explained below in more detail (Sect. 2), this PN was selected primarily because of its proximity, its high galactic latitude, and its wealth in ionized, neutral and molecular content.
| IAU | Id. | texp | Sp. | Notes | |||||
|---|---|---|---|---|---|---|---|---|---|
| name | (J2000) | (mag) | (mag) | (mag) | (min) | (pc) | |||
| USNO-B1.0 0691-0897349 | 1 | 22 29 47.3 20 50 31 | 13.17 | 0.51 | 1.02 | 66.2 | F8V | 680 | on PN |
| USNO-B1.0 0691-0897340 | 2 | 22 29 38.6 20 50 14 | 13.54 | 0.39 | - | 46.1 | - | 210 | nucleus |
| USNO-B1.0 0692-0882100 | 3 | 22 29 33.5 20 46 18 | 12.04 | 0.64 | 1.08 | 22.7 | G2V | 290 | on-PN |
| USNO-B1.0 0691-0897309 | 4 | 22 29 19.0 20 48 48 | 13.94 | - | 0.75 | 66.7 | F2V | 1500 | on-PN |
| USNO-B1.0 0690-0897407 | 5 | 22 29 46.5 20 56 33 | 13.57 | - | 0.68 | 47.4 | F0V | 1500 | on-PN |
| USNO-B1.0 0691-0897499 | 6 | 22 30 28.0 20 48 31 | 12.31 | 0.59 | 1.16 | 14.6 | G1V | 380 | off-PN |
| USNO-B1.0 0692-0882044 | 7 | 22 29 09.4 20 46 07 | 10.02 | 0.89 | 1.88 | 01.7 | K1III | 760 | on-PN |
| USNO-B1.0 0690-0897288 | 8 | 22 29 13.1 20 57 49 | 10.36 | 0.73 | - | 05.2 | F5V | 240 | off-PN |
2 The Helix Nebula and the background stars used for absorption spectroscopy
The Helix Nebula is undoubtedly the best target of its kind for this study, being close ( = pc, from parallax mas; Young et al. you99 (1999)), as well as rich in carbon, dust and being irradiated by a strong central UV source. Its high galactic latitude () minimises confusion with the foreground or background ISM: the maps of Burnstein & Heiles (bur82 (1982)) and Schlegel et al. (sch98 (1998)) show a very low interstellar (IS) reddening of 0.03 mag. The nebula has been detected in the lines of H i, H2 and CO, together with other species (CN, HCN, HNC, HCO+ and C i) which strongly indicate a carbon-rich medium (Young et al. you99 (1999); Speck et al. spe02 (2002)). While the H i and CO (2–1) maps (Rodriguez et al. rod02 (2002); Young et al. you99 (1999), respectively) roughly outline the main body of the optical PN, i.e. as traced by ionised species, these maps reveal strong inhomogeneity in the form of a marked “knotty” structure. This is fully consistent with the presence of the well known numerous dust globules seen in optical images. Also, the radio maps show that the global PN geometry is not spherical, but approximately disk-like and seen nearly pole-on. This complex structure makes obvious the necessity of considering as many background stars as possible. Finally, because the neutral phase of the PN contains 3 to 6 times more mass than the molecular phase (Rodriguez et al. rod02 (2002); Young et al. you99 (1999)), it can be expected that essentially the neutral material, but perhaps also some molecular knots, may be probed by observing background stars.
Optical images (Fig. 1) show a large number of potential targets within or near the PN shell which might function as sightlines to probe the nebula and the ISM in angularly nearby sightlines. Targets were first selected using homogeneous, accurate photometry from 2MASS. For some of them, a magnitude is available in Simbad. By comparing the and/or colours of our targets to template Population I dwarfs, an approximate spectral type could be inferred. Then, absolute magnitudes and therefore distances were derived. Where independent , colours are available in Simbad, we find excellent agreement with the predictions of the or colours. Only about half of the targets which were bright enough to obtain high signal-to-noise () spectra could eventually be observed, owing to poor weather.
The derived types and distances for these 8 observed targets are given in Table 1. The targets have 10–14 and are located directly behind, or close to, the shell. With the exception of the nucleus, target #2, the sightlines probed have spectral types F or G. The uncertainties on distances are of the order of 20%. Distances would be 30% smaller (or less) if we had adopted the luminosity of low-metallicity subdwarfs, but they would be considerably larger if we had adopted the luminosity of giants. In the end, several targets are clearly much more distant ( 400 pc) than the Helix. As we shall see below, all these targets provide a very usable continuum for absorption spectroscopy despite their photospheric lines. Moreover, for each target, the precise velocity of the photospheric Na i D lines could be easily predicted through consideration of 20 prominent unblended Fe i lines available in our spectra (vertical bars in Fig. 2).
3 Observations and data reduction
Observations were performed on 2002 October 11–12 using the Very Large Telescope with the Ultraviolet and Visual Echelle Spectrograph (UVES) at the European Southern Observatory, Cerro Paranal, Chile. Total integration times of up to one hour were achieved, depending on the target magnitude. Using the 0.8″ slit (R = 50000) with both red and blue dichroics, spectra were obtained over three wavelength ranges, 3500–4520 Å, 4630–5600 Å and 5670–6650 Å. These ranges include in particular the strongest DIBs at 5780, 5797, 6283 and 6614 Å, the Na i D and Ca ii H & K lines. The target signal-to-noise ratio of 70 (per 0.017Å bin) was achieved over the most part of these ranges, except in the blue region comprising the Ca ii lines where is generally poor because the target is not hot enough (with the exception of the nucleus). The data analysis was carried out by using the reduced spectra that are provided by the ESO/UVES reduction pipeline, and by using the ESO MIDAS and the NOAO IRAF packages.
| Star | V | Sp. | dist. | Wλ(D1) | Wλ(D2) | Wλ(K) | Notes | |
|---|---|---|---|---|---|---|---|---|
| name | (deg) | (mag) | (pc) | (mA) | (mA) | (mA) | ||
| PHL 346 | 2.86 | 11.47 | B1 | 10000 | - | - | 199 | (1)(4) |
| HD 214080 | 4.70 | 6.83 | B1Ib | 3000 | 171 | 207 | 149 | (2) |
| HD 210191 | 5.38 | 5.81 | B2.5IV | 460 | 90 | 164 | 285 | (2)(3) |
4 The interstellar medium in the direction of the Helix Nebula
Before interpreting the spectra of our program stars, e.g. the Na i and Ca ii profiles, one has to estimate the effect of the foreground and background ISM, deriving, at least approximately, the expected strength of the IS lines. One source of information is the maps derived by Schlegel et al. (sch98 (1998)). By considering a zone of 3° 3° centred on the Helix (the nucleus is at = 362, = 1) but excluding a central region of 1° 1° to avoid the nebula itself, we find that would be on average 0.035 mag. with = 0.005, as derived from 20 independent positions. One has to note that the above only represents the local scatter of as given by the Schlegel et al. maps which have an angular resolution of 6′. This does not exclude moderately larger deviations from this mean when one considers the very narrow pencil-like sightlines to background stars.
Based on this estimate of , one can derive the expected column density of Na i. From Bohlin et al. (boh78 (1978)), the hydrogen (H i + 2H2) column density is obtainable with (H)/ = 5.8 10+21 cm-2, with deviations from this mean generally less than a factor 1.5. Consequently, we obtain (H) = 2.0 10+20 cm-2. For this column density, the correlation found by Ferlet et al. (fer85 (1985)) with (Na i) suggest that (Na i) = 1.0 10+12 cm-2 with a scatter of about a factor 3 (see their Fig. 1). This Na i column density is relatively small but is already in the non linear regime of the curve of growth for typical IS sightlines. It corresponds to a typical equivalent width (Wλ) in the Na i D2 (5890 Å) line Wλ(D2) 200 mÅ. Consequently, we expect that Wλ(D2) observed towards our targets be close to 200 mÅ.
Another source of information concerning the ISM in the direction of the Helix is obtained by considering available observations of Na i or other atoms for stars angularly close to the Helix. By interrogating the catalogue of Garcia (gar91 (1991)), we find 3 stars with IS information available and located at less than 6° from the Helix centre. The data, taken from Albert (alb83 (1983)) and Keenan et al. (kee88 (1988)), are listed in Table 2, and the values of Wλ(D2) are found to be also 200 mÅ in excellent agreement with estimations made above. It is interesting also to note that Albert (alb83 (1983)) gives for HD 214080 = 0.05 in very good agreement with = 0.047 provided by the Schegel et al. maps in the direction of this star. In contrast, for HD 210191, Albert (alb83 (1983)) gives = 0.07 whereas the maps of Schlegel et al. give = 0.025. It is possible that Albert (alb83 (1983)) overestimates the extinction because the intrinsic colour of HD 210191 has to be derived from its spectral classification and may have been incorrectly taken as too blue.
An equally important point to consider is the expected range of heliocentric velocities for IS lines. By considering Fig. 2 of Albert (alb83 (1983)), it is clear that the H i (21 cm) line, the Na i and the Ca ii lines toward HD 214080 and HD 210191 are all consistently found within the velocity interval = 25 km s-1 to +20 km s-1, which corresponds to = 28 to +17 km s-1 (for the direction of the Helix = –3, in km s-1). Concerning PHL 346, Keenan et al. (kee88 (1988)) find the Ca ii K IS line at = +21 km s-1, or = +18 km s-1, in good agreement with the other two bright stars.
To conclude, the above considerations suggest that IS lines in our target sightlines should display typical Wλ of 200 mÅ for Na i D2, and about the same for the Ca ii K line (see Table 2). We expect the IS lines to have within the interval from 28 to +17 km s-1, although a velocity slightly outside of this expected range is not excluded, because it is based on 3 sightlines which are not exactly toward the Helix, but angularly shifted by a few degrees.

5 Results and analysis
5.1 Characterising the nebular absorption using Na i D profiles
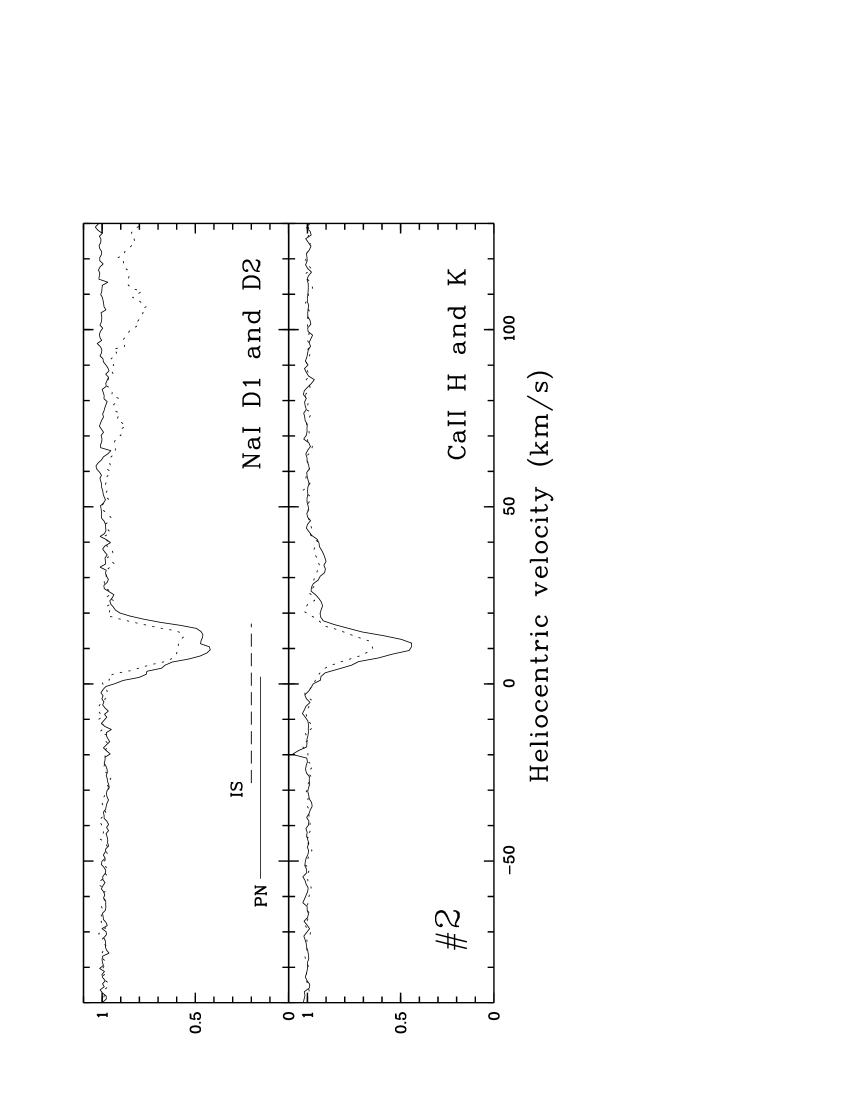
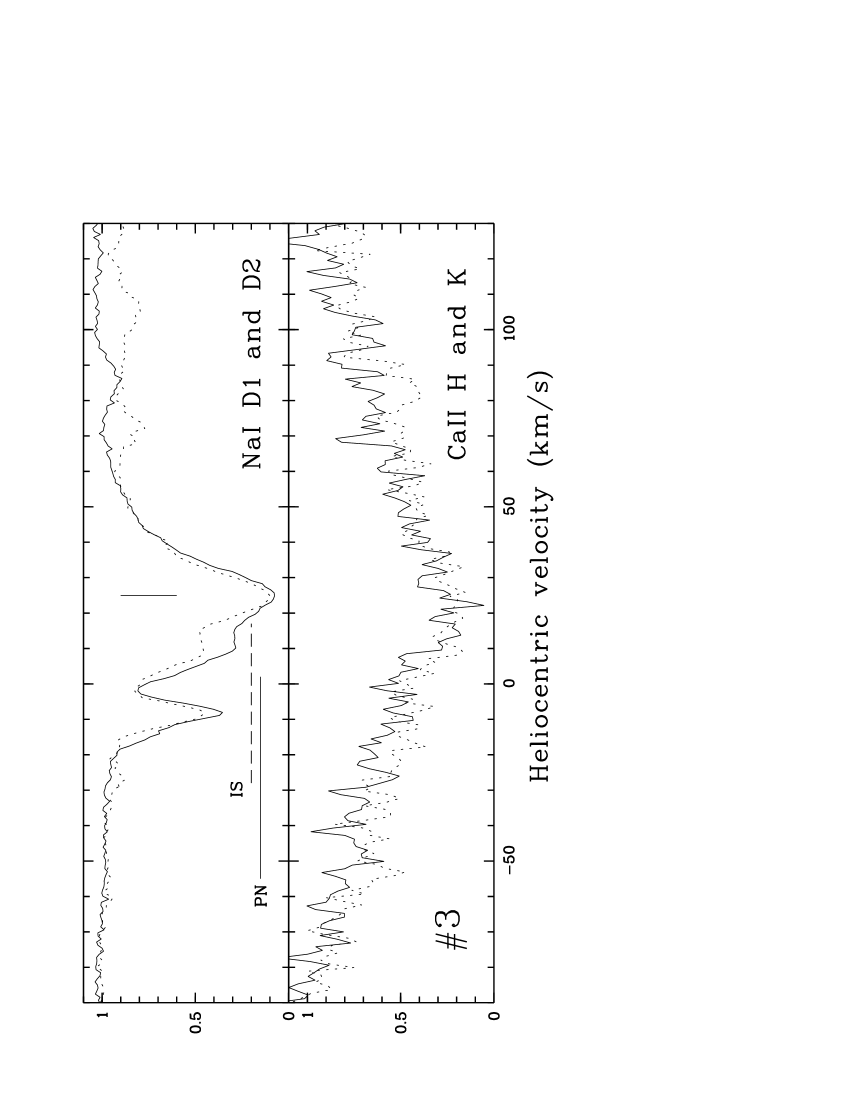
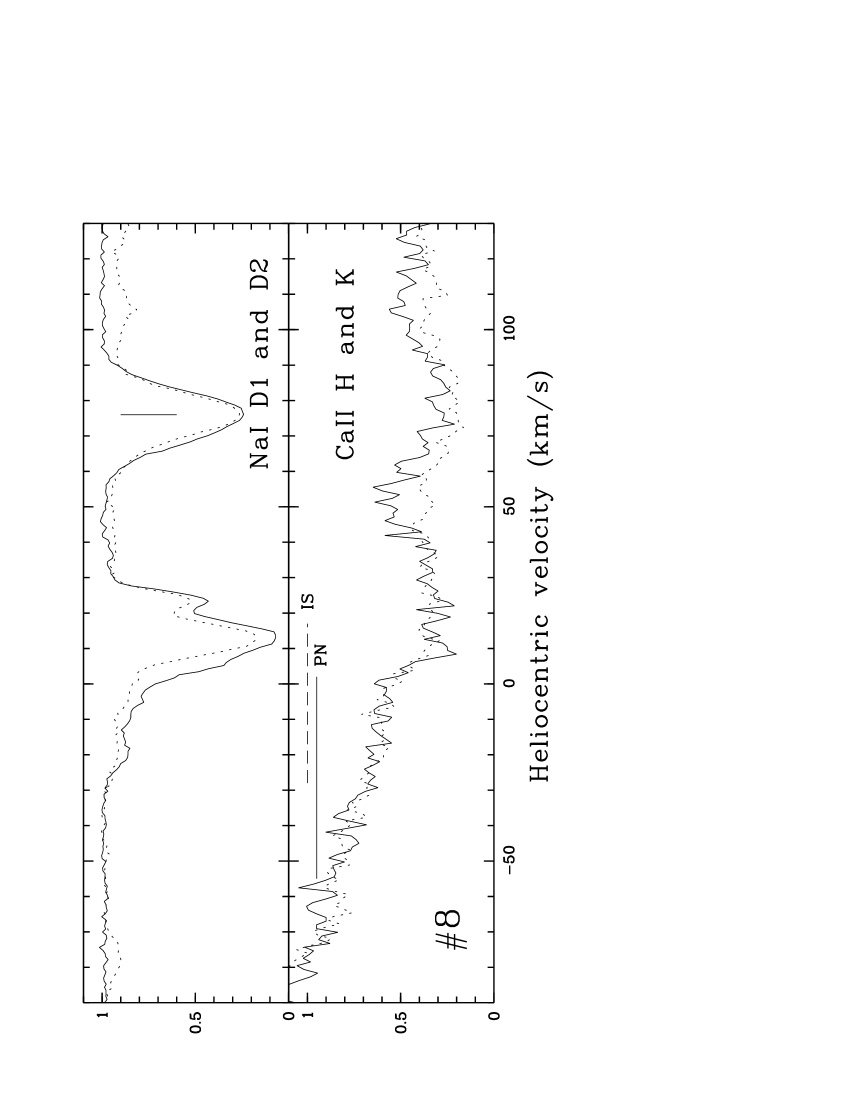
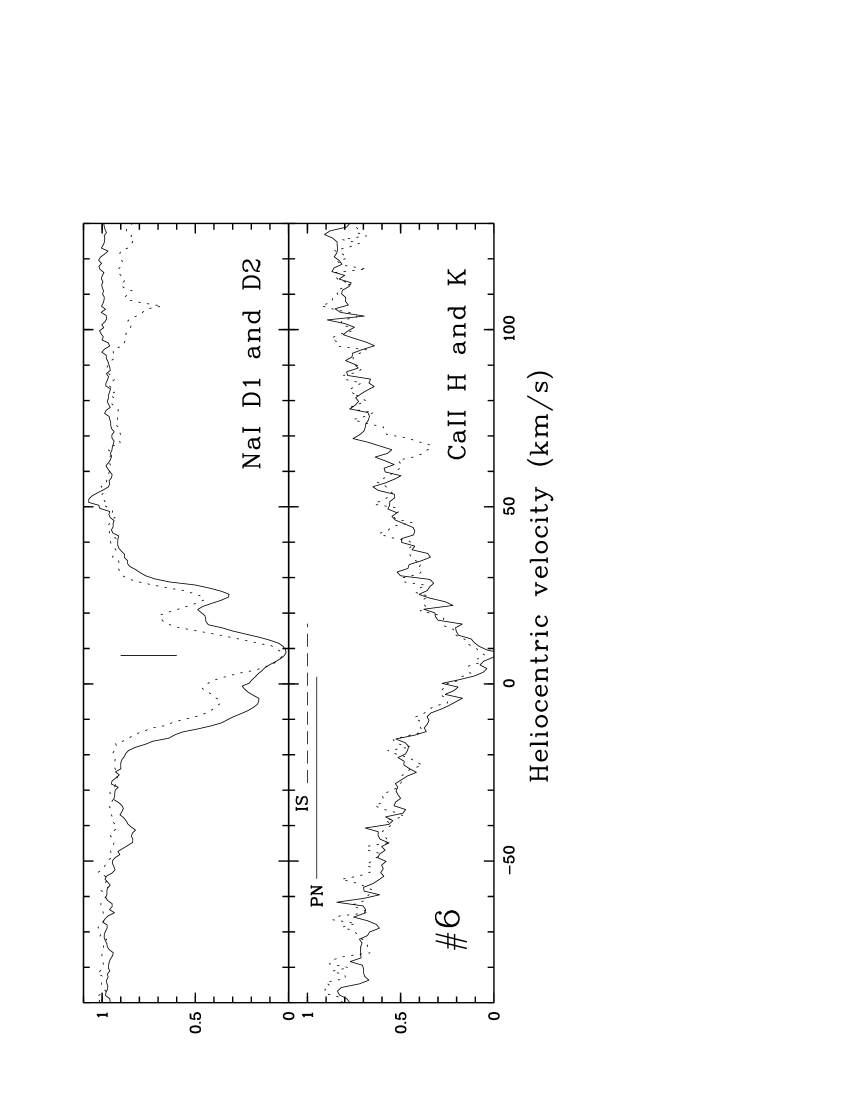
Figure 2 displays the Na i D1 and D2 line profiles for all eight targets. It is important to realize first that, for a given target, any detail seen in both D1 and D2 profiles should be the signature of the same IS (or possibly circumstellar) component, and one can indeed see in these spectra many components with corresponding fully consistent D1 and D2 features. This compensates for one of the difficulties of our experiment: one has to be careful about the fact that the stellar continua of our targets are not flat, as they would be for OB type stars. Consequently, depending on the radial velocity of the targets, the Na i IS (or circumstellar) lines may be blended with photospheric Na i lines in the target stars themselves, or, possibly, with a different photospheric feature. Finally, since Na i has now been detected in a number of PNs (Dinerstein & Sneden din88 (1988); Dinerstein et al. din95 (1995)), one can expect some circumstellar contribution, that could well be significant.
In Fig. 2, the approximate range of velocities for IS components (discussed above) is indicated by a horizontal dashed line labelled “IS”. Concerning the velocities of possible circumstellar components, we have plotted with a horizontal solid line labelled “PN” the range of the Helix gas: this range is from 55 to +2 km s-1, as derived from CO and H i line profiles (integrated over the PN). In principle, in order to predict at which velocity one could expect a circumstellar component, one might consider the CO or H i maps and look at the profiles at the exact position of each target. In practice, this provides little information: none of the 8 targets are covered by the H i map of Rodriguez et al. (rod02 (2002); their Fig. 4), and CO is detected only to target #3, after a careful examination of Fig. 1 of Young et al. (you99 (1999)); the case of target #3 is discussed below. Therefore, we adopt the view that circumstellar Na i components may occur anywhere within the CO or H i velocity range.
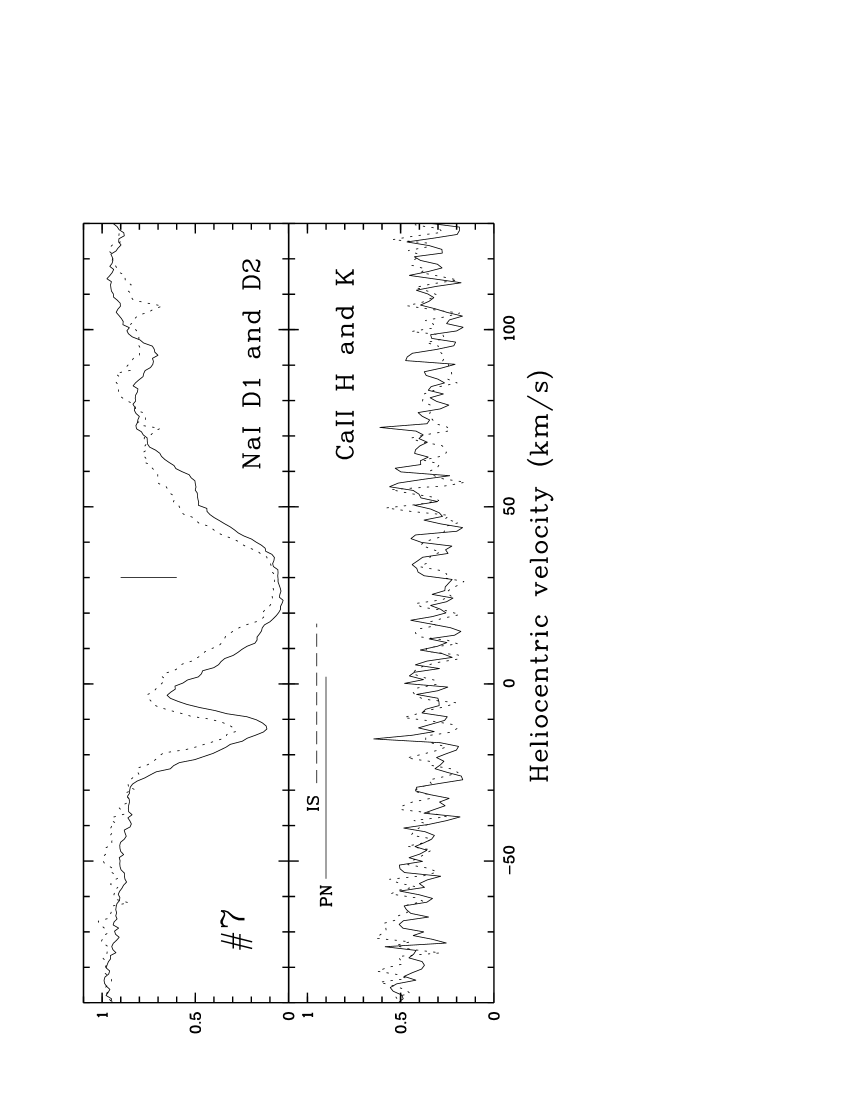
5.1.1 Targets 1, 3, 6 and 7 (Fig.2, left panels)
The case of blending with photospheric Na is obviously present for targets #1, #3, #6 and #7. In the light of the above comments, these four targets show nothing exceptional which is not explained by photospheric plus IS contributions. We note one component at km s-1 for #1 and #6. This is +7 km s-1 outside the expected velocity range of IS lines, and not near the of the Helix itself or that of the target photospheres. It may be a local feature of the ISM affecting only these lines of sight.
There is also a distinct component at km s-1 for #3 and #7, and this might a priori be assigned to IS matter in these lines of sight, since their Wλ(D2) are 100 and 230 mÅ for #3 and #7 respectively, and because this velocity falls in the expected range for IS absorptions. The relatively small value for #3 (suggesting a lack of a circumstellar contribution) is surprising in view of the location of this target within the CO isophotes (see Fig. 1 of Young et al. you99 (1999)).This line of sight should trace neutral/molecular nebular material, but this is not apparent in Na i and it may be that the Helix is located beyond this star, which is the nearest of all the targets. In any case, the component is not at the observed CO velocity in this region, between 30 and 50 km s-1, see Fig. 3 of Young et al. (you99 (1999)). For target #7, well off the PN and CO contours, the strength of this particular component is typical of the ISM in the direction of the Helix.
5.1.2 Targets 2, 8 (Fig. 2, upper right panels)
One can pursue this analysis further by considering target #2 (the PN nucleus) and target #8, for which no blending with photospheric lines exists. For the nucleus, this is because no photospheric Na i line is expected, given its likely very hot . Target #8 is cooler with an estimated F5V spectral type, but its is such (+76 km s-1) that the Na i components are unaffected by any photospheric Na line, or indeed any other line, since the D1 and D2 profiles resemble each other accurately. The distances of these two stars are 210–240 pc. For #2, Wλ(D2) is found to be 150 mÅ, and we do not expect any circumstellar absorption, because of the PN geometry, or photospheric absorption, so by definition this is the ISM probed towards the nucleus itself, at its fairly well-known distance.
For target #8, well off the PN, the photospheric and (presumably) IS components are well separated (as mentioned above) and we can measure the photospheric (D2) strength as 250 mÅ (seemingly typical of all our F–G type targets). The IS component is surprisingly strong at 410 mÅ. Because the absorption velocities in both #2 and #8 are at +15 km s-1, not within the Helix range, the simplest interpretation is that we are again tracing the foreground ISM, although one cannot entirely rule out a nebular contribution.
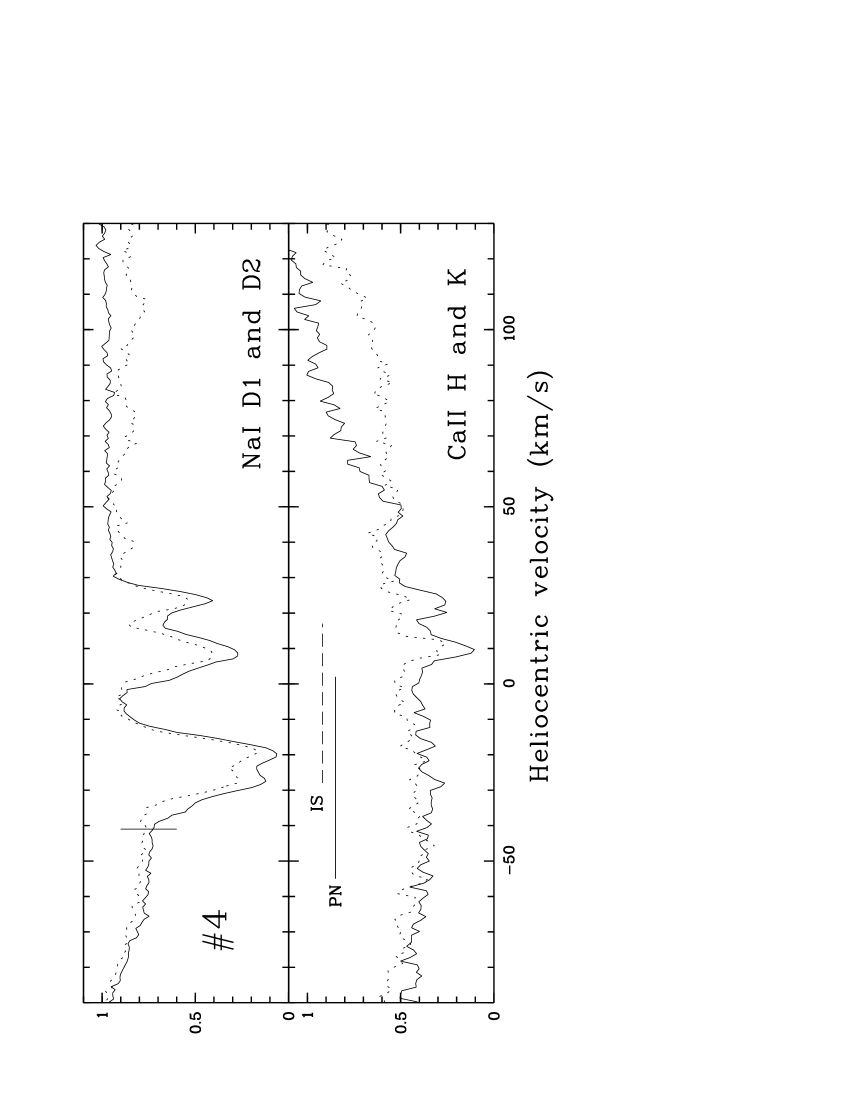
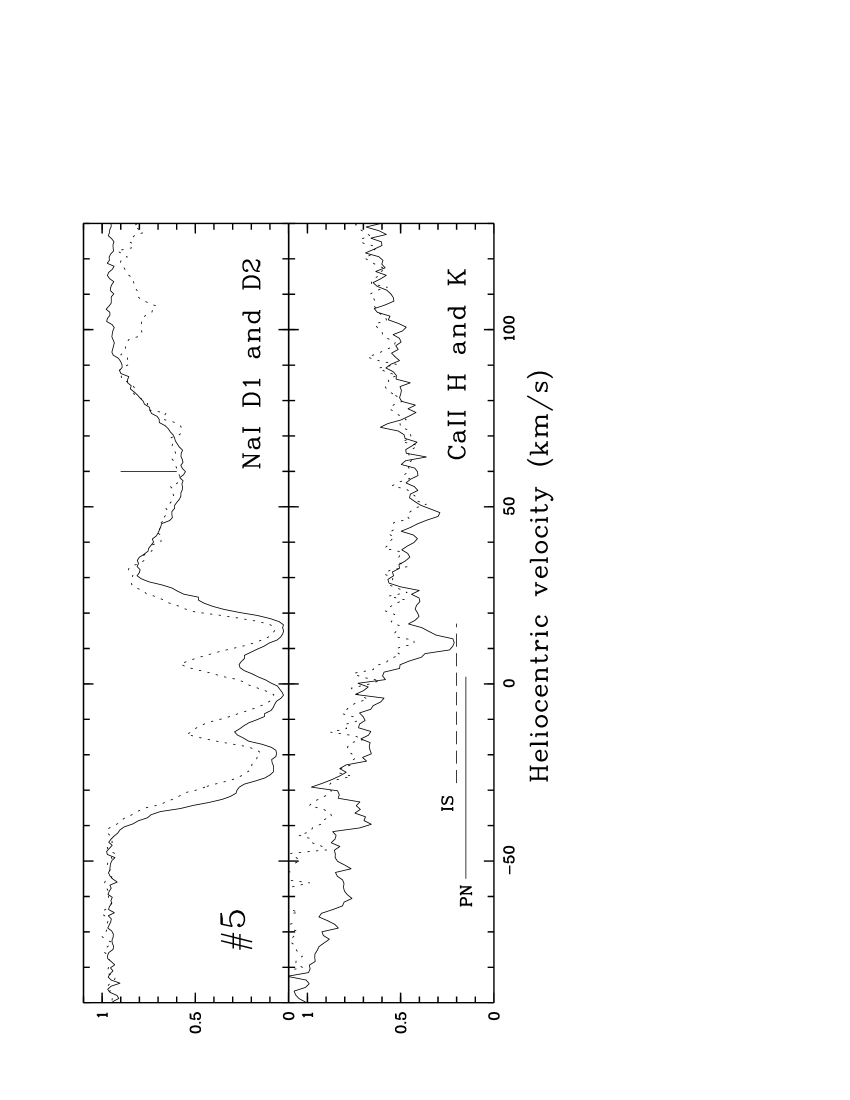
5.1.3 Targets 4 and 5 (Fig. 2, lower right panels)
Finally, targets #4 and #5 are particularly interesting for our purposes because they are distant ( 1500 pc), and because they are located close to the edge or angularly slightly outside the bulk of the ionized PN gas. They are close to the lowest contours of the available H i and CO maps. Therefore, one can expect that these line of sight probe some neutral PN gas. Examination of the data indeed suggest this is the case.
Given the strength of the Na i absorptions towards #5, and that their velocity range lie largely within the PN CO velocity range, we are led to attribute at least a significant part of the absorption to circumstellar material. The case of #4 is perhaps even more clear cut; there is a strong, well-resolved component centred very closely on the of the Helix which lies at the (negative) velocity limit of where IS absorptions are expected. This component is at 25 km s-1; the equivalent width of the individual component in D2 is 350 mÅ, exceeding the canonical ISM expectation by nearly a factor of 2. Similarly, we note that #5 has by far the greatest total Na i equivalent width, in both D1 and D2, of all the targets, certainly where the photosphere is well removed in velocity (#7 has comparable absorption strength but includes a significant photospheric component). This in itself lends support to the thesis that we are probing nebular Na i towards #4 and #5.
The surprising strength of the Na i lines to target #5 suggests a further favourable argument; summing over the three components, one finds Wλ(D2) 1000 mÅ, much stronger than the expected level from the ISM. Moreover, the individual D1 and D2 components, which are only partially resolved our velocity resolution (6 km s-1), are in fact probably saturated, and the ratio Wλ(D2)/Wλ(D1) is found to be 980/740 1.3, significantly less than a factor of 2, indicating that the lines are not formed in the linear regime of the curve of growth. A much better resolution ( 1 km s-1) would be necessary to accurately derive column densities, and assess, e.g. the importance of blending, saturation and wing shapes. However, one can obtain a rough estimate by comparing the data to IS cases described in previous studies of IS Na i lines. By considering the IS Na i survey of Hobbs (hob78 (1978)), a Wλ(D2) value of 1000 mÅ is enormous compared to usual IS lines of sight, especially when one considers the Helix high galactic latitude. In Hobbs’ survey, the largest D2 Na i widths are at 500, 520 and 530 mÅ, and the corresponding (Na i) are 3.1, 1.3 and 7.8 10+13 cm-2. In view of these numbers, one can reasonably estimate that to #5 the column density (Na i) is of the order of at least 4 10+13 cm-2, or 20 or 40 times stronger than the expectation from the galactic layer ( 1–2 10+12 cm-2, Sect. 4).
To conclude, we strongly favour a circumstellar origin for the Na i components described above. Finding some Na i in the neutral gas of the Helix is also consistent with other observations on several PNs (Dinerstein & Sneden din88 (1988), Dinerstein et al. din95 (1995)). In addition, we shall see in the following that further evidence for a circumstellar origin is carried by the Ca ii lines analysed below.
5.2 Analysis of the Ca ii lines
In Fig. 2 are displayed the Ca ii regions for all targets. Except for the nucleus (#2) that provides a generous, flat continuum, all other targets show broad, deep Ca ii photospheric lines, implying unfortunately low ratios. Note that with the exception of #7, the spectra have been normalised to the highest point in the displayed range so as to best display the details, since the IS or circumstellar features must be sought against the local continuum noise. For #7, the signal is much too faint and the too poor for showing any detection, because the velocity range falls in the very deep core of the Ca ii lines (#7 a K giant). For this star, the line profile have been shifted up by 0.2 for clarity.
The IS Ca ii line is clearly seen to target #2, with a strength in very good agreement with those of the neighbouring stars of Table 2. This IS component at +10 km s-1 is also seen, more or less clearly, to #1, #8, #4 and #5. For #3, #6 and #7, the noise is too large.
It is therefore quite surprising to notice that, for #4, absolutely no trace of a Ca ii line is seen for the strong, double component at km s-1. Similarly, it is even more striking that, to #5, the components at km s-1 , being nearly saturated in Na D, have no Ca ii counterparts. The contrast with the case of #2 is obvious.
This lack of Ca ii components can be easily understood in the case of absorption by circumstellar matter. There have been already a number of studies concerning abundances in the gas phase of PN that showed that Ca is very depleted in the ionized phase, otherwise e.g. the [Ca ii] 7291 Å and 7323 Å forbidden lines would be of great strength, whereas they are generally absent. The commonly accepted explanation is that, even in the ionized phase, Ca is almost completely locked in very robust grains that resist the effects of the hard UV radiation or interaction with the PN plasma (see for example Shields shi83 (1983); Ferland fer93 (1993); Volk et al. vol97 (1997); Dopita et al. dop94 (1994); Dopita et al. dop00 (2000)). These grains are not easily directly observed (or/and their abundance measured), but they are necessary to explain the strong depletion of various refractories. This extreme Ca depletion in PNs is quite general and occurs in both O-rich or C-rich PNs. It seems to us natural to deduce that since Ca is depleted in PNs, e.g. their ionized phase, Ca is also very depleted in the neutral phase that we are probing with Na i (Na is not a refractory species and is not, or only very lightly, depleted). Our interpretation is the Ca atoms reside in the hard cores, condensed at high temperature, of the heterogeneous grains that form in the cool AGB winds and that eventually lose their more fragile envelope during the PN formation.
5.3 A search for circumstellar diffuse bands

We searched for DIBs in all the targets spectra, and found none. For targets probing the ISM (see above), this lack of DIBs is fully expected, because the IS excess is only 0.03, and the of our spectra is limited, despite 1 hr exposure times with VLT-UVES. For example, from the work of Kumar (kum86 (1986)) on low colour excess stars (see his Table 1), one finds that, for = 0.10 0.01, the 6614 Å DIB equivalent width (noted ) is (6614) = 20 mÅ (4 stars, = 2 mÅ); for = 0.075 0.005, (6614) = 5 mÅ (8 stars, = 4 mÅ). Alternatively, Galazutdinov et al. (gal98 (1998)) show for the 5780 DIB that equivalent widths of the order of 30–40 mÅ are observed for their lowest colour excess sightlines ( = 0.05 0.01, comparable to those discussed above). The DIB strengths due to the ISM in the direction of the Helix are thus quite small (perhaps as low as 5 mÅ but possibly up to 30 mÅ) and simulations presented below show that our experiments cannot detect such weak DIB signals. However, our experiment may only be perhaps a factor 2–3 insufficiently sensitive to detect the ISM in the strongest DIBs.
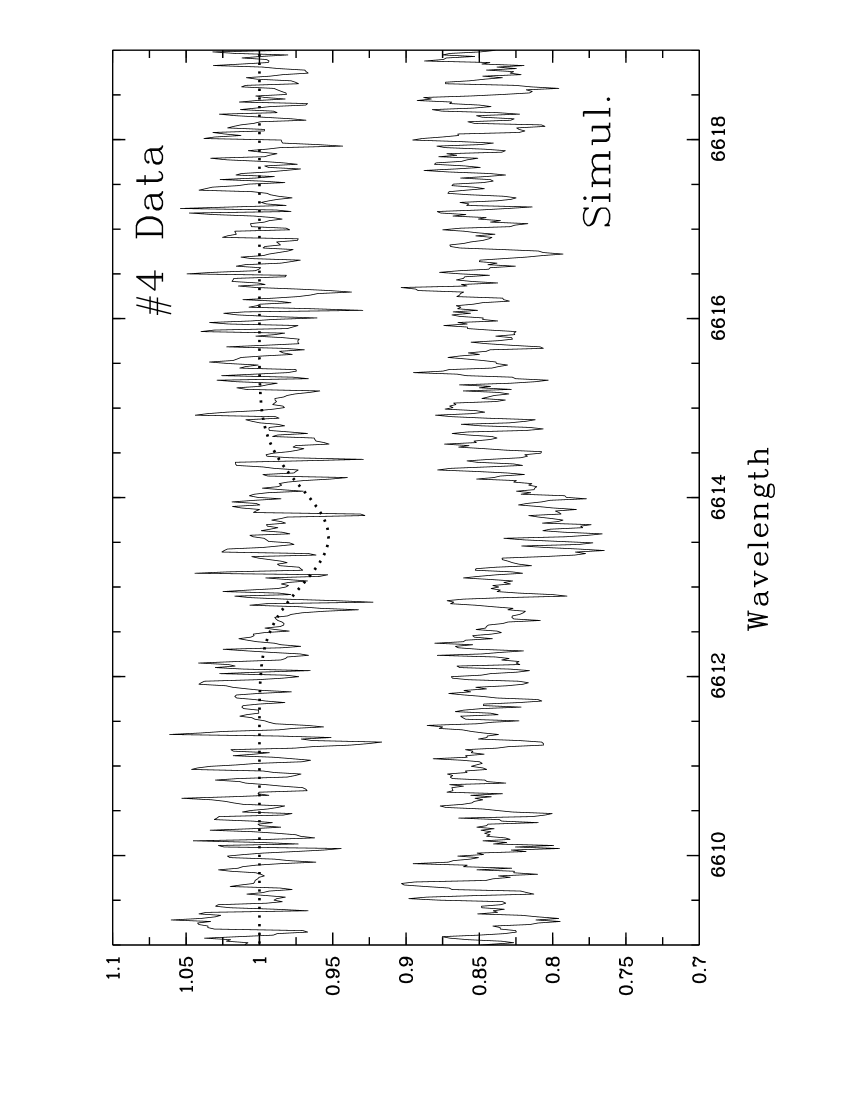
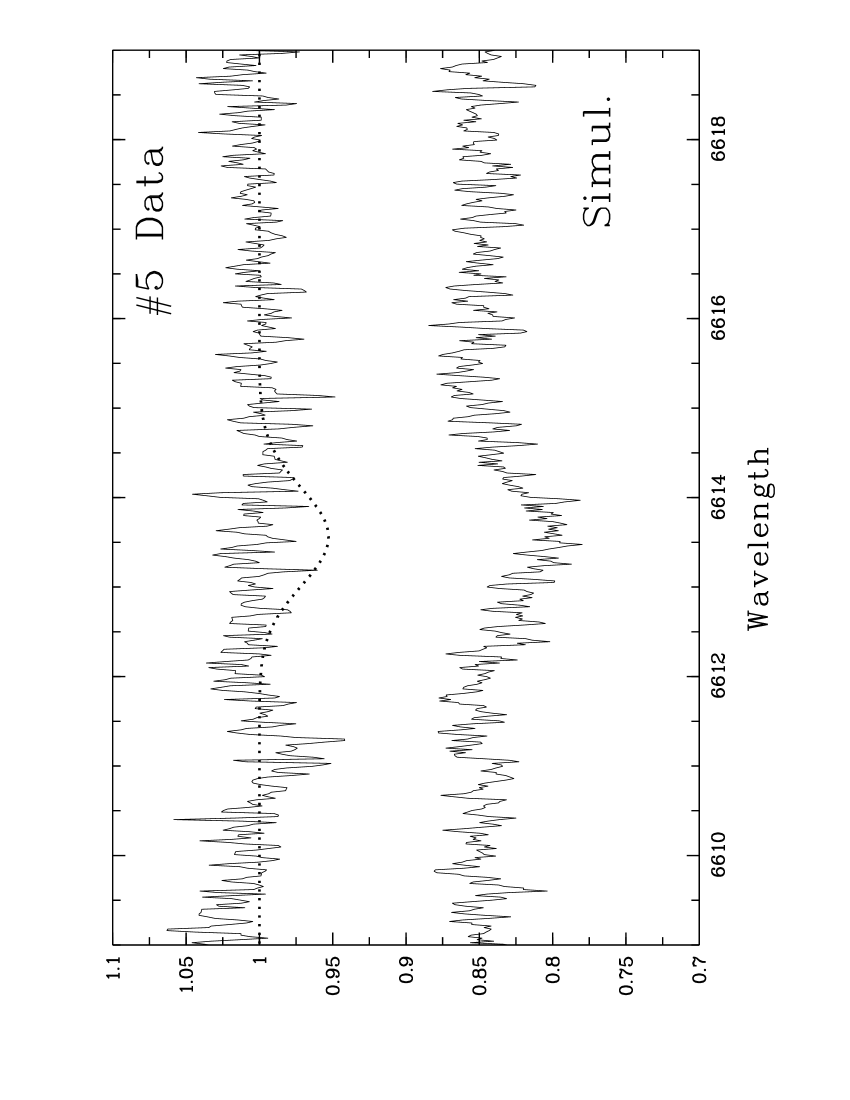
Figure 3 shows the observed spectra of targets #4 and #5 in the region of the 6614 Å DIB (labelled “Data”). For both objects, we also show the DIB profiles that would be seen if their equivalent width were 50 mÅ either with an infinite (overplotted dotted line), or with an added noise similar to the data (lower curve). The DIB profile was approximated by a Gaussian with FWHM 1.0 Å (Walker et al. wal00 (2000)). The DIB central wavelength is the rest value, 6613.56 Å, as given by Galazutdinov et al. (gal00 (2000)), with uncertainty 0.1 Å. No velocity shift was applied since the Earth velocity shift of +20 km s-1 and the average heliocentric velocity of the Helix ( km s-1) almost cancel. One can see that for #4, a 50 mÅ 6614 Å DIB would be fairly detectable, and for #5 where the is better, it would be very clearly seen. On the basis of these plots, a 3 upper limit to (6614) for target #5 is taken as 25 mÅ.
The limits for other DIBs, e.g. at 5780 Å, are not better (see Fig. 3). The 5780 Å DIB is generally stronger in equivalent width than 6614, but it is also twice wider; 2.0 Å FWHM, as observed by Galazutdinov et al. (gal98 (1998)). In our spectra, its detection is not easier than for 6614, especially because of faint photospheric lines lying in this region. In the end, for (5780), we derive an upper limit of 70 mÅ.
Instead of comparing the data with simulations, one might derive 3 upper limits with the usual formula, as given by, e.g., Cowie & Songaila (cow86 (1986)): for a line that falls over resolution elements, the detectable equivalent width is = 3 , where is the signal-to-noise ratio in each resolution element. For the 6614 DIB, one finds with our data 10 mÅ. However, the above formula, while taking into account the observed , assumes an absence of other (photospheric) lines, which may not be the case (see Fig. 3). Therefore, we believe that the limits derived from simulations are more appropriate.
6 Discussion
The primary goal of this work was to search for circumstellar diffuse bands: none were found, but we discovered two targets, #4 and #5, whose lines of sight indeed probe some neutral PN gas, with such a strong Na i absorption, and strong Ca depletion, that the two together cannot possibly be due to the foreground or background ISM.
A further indication that the sightline to #5 is far from typically interstellar is obtained by plotting (5780) (D2) (Fig. 4). The data for IS lines were taken from the compilation of Herbig (her93 (1993)) and involves sightlines with between 0 and 1.5. We see a clear increase of (5780) with increasing D2 equivalent width. The representative point of sightline #5 is the full black square. Not only (D2) appears huge compared to other sightlines, especially when one realizes that #5 is at high galactic latitude, but this plot suggests that if only IS matter were probed, then we would see (5780) 400 mÅ, which is definitely not the case. Therefore, the material seen in the line of sight to #5 must be overwhelmingly of circumstellar origin.
The fact that no DIBs have been seen is consistent with their absence in several other archetypal sources with carbon-rich circumstellar material. For example, in the case of IRC +10∘ 216 which is very rich in molecules, including carbon chains, no DIB was detected on a sightline for which the Na i absorption lines were heavily saturated, the K i lines were very strong with 500 mÅ (Kendall et al. ken02 (2002)), and the C2 molecule was detected (Kendall et al. ken04 (2004)). In the case of the post-AGB star HR 4049, Waters et al. (wat89 (1989)) showed that the circumstellar dust is carbon-rich and displays the emission features at 7, 9 and 11.3 m attributed to PAHs, but no DIB was detected. Waters et al. (wat89 (1989)) obtained a stringent limit on the DIB abundance, with mÅ despite a large circumstellar reddening, being between 0.19 and 0.29. Compared to these two objects, the Helix is a third interesting case; its nucleus is much hotter than HR 4049, but the PN also still contains much circumstellar molecular and dusty material left by the AGB progenitor wind. A peculiarity of the Helix is that there are no PAH mid-infrared features, interpreted by Cox et al. (cox98 (1998)) as due to a destruction of small grains by the hard radiation field of the nucleus in the early PN phase.
Finding no DIBs in these three typical but quite different objects suggests that DIBs are not fabricated in AGB envelopes or PNs. However, it will now become even more necessary to .) fully explain the origin of the emission bands in the Red Rectangle and their possible relation to DIBs; and .) further examine the few cases of carbon stars and post-AGB objects mentioned in Sect. 1 for which evidence for circumstellar diffuse bands have been put forward.
It will also be interesting to perform specific observations of targets #4 and #5 with a higher spectral resolution and/or a better signal-to-noise ratio in order to detect other species, e.g. K i, C2 or CN, to establish whether these circumstellar lines of sight probe any molecular matter, to infer the total hydrogen column density and obtain a more quantitative upper limit to the DIB abundance.

7 Summary and conclusions
1.– With the goal of studying the neutral gas of the Helix PN and the presence of circumstellar diffuse bands, VLT/UVES spectroscopy was achieved on 8 targets lying within 13′ of the PN centre, including its nucleus. Using available 2MASS and UBV photometry, the spectral types of the targets could be estimated. This allowed the derivation of distances, which are found to be in the range 200 pc to 1500 pc. Thus, several targets are located far beyond the Helix and can be used as background sources, angularly placed on or off the visible nebula.
2.– Of the 8 targets, four (including the nucleus) can particularly be exploited because they show little blending between the interstellar/circumstellar Na i lines and the photospheric lines of the background target itself, which are either absent, favorably shifted by the stellar radial velocity, or/and broadened by stellar rotation.
3.– By analysing the extinction maps around the Helix, and IS lines observed towards 3 bright stars in a 5° zone around the Helix, we could estimate the expected contribution of the foreground and background ISM, in terms of equivalent width of the Na i lines (Wλ(D2) 200mÅ), and the expected range of heliocentric velocities for IS lines.
4.– It appears that many of the Na i components observed in the target spectra are probably of IS origin. However, for two targets (# 4 and #5), our analysis shows that circumstellar Na i is observed in absorption. For #5, a very strong Na i column density is derived, at least 20 times larger than the expected IS contribution. The circumstellar origin is also supported by the fact that no corresponding absorption Ca ii K line is detected, in contrast to IS lines. This fact is well understood: since Ca is always very depleted in the ionized phases of planetary nebulae, it is probably depleted as well and locked in the circumstellar grains of the cool neutral phase, where dust has not yet been subject to strong UV radiation and plasma interaction.
5.– No diffuse bands were detected. The expected bands from the foreground and background ISM are not strong enough ((6614) 5 to 20 mÅ) to be seen in our spectra. Nor do the circumstellar lines of sight to #4 and #5 show any bands. Qualitatively, our data do not favour abundant fabrication of diffuse band carriers in the Helix.
Acknowledgements.
The authors warmly thank Claudio Melo, Jonathan Smoker, and the ESO staff, for their assistance during observations. Thanks also to Christophe Mercier at Montpellier for his help in making Figure 1. We also thank the anonymous referee for comments that helped to improve the paper. N.M. acknowledges support from the French CNRS Program Physico-chimie du Milieu Interstellaire. T.R.K. acknowledges support from the French Ministère de la Recherche. The publication makes use of data products from 2MASS, which is a joint project of the Univ. of Massachusetts and the Infrared Analysis and Processing Centre, California Institute of Technology, funded by NASA and NSF. This research has also made use of the ESO MIDAS data analysis software, the NOAO IRAF software and the SIMBAD database, operated at CDS, Strasbourg, France.References
- (1) Albert, C.E. 1983, ApJ, 272, 509
- (2) Bohlin, R.C., Savage, B.D., & Drake, J.F. 1978, ApJ, 224, 132
- (3) Cowie, L.L., & Songaila, A., 1986, ARA&A, 24, 499
- (4) Cox, P., Boulanger, F., Huggins, P.J., et al. 1998, ApJ, 495, L23
- (5) Burnstein, D., & Heiles, C. 1982, AJ, 87, 1165
- (6) Dinerstein, H.L., & Sneden, C. 1988, ApJL, 335, L23
- (7) Dinerstein, H.L., Sneden, C., & Uglum, J. 1995, ApJ, 447, 262
- (8) Dopita, M.A., Vassiliadis, E., Meatheringham, S.J., Ford, H.C., et al. 1994, ApJ, 426, 150
- (9) Dopita, M.A., & Sutherland, R.S. 2000, ApJ, 539, 742
- (10) Duley, W.W. 1998, MNRAS, 301,955
- (11) Ferland, G.J. 1993, in Planetary Nebulae, ed. R. Weinberger & A. Acker (Dordrecht, Reidel), 123
- (12) Ferlet, R., Vidal-Madjar, A., & Gry, C. 1985, ApJ, 298, 838
- (13) Garcia, B. 1991, A&AS, 89, 469
- (14) Galazutdinov, G.A., Krelowski, J., Moutou, C., & Musaev, F.A. 1998, MNRAS, 295, 437
- (15) Galazutdinov, G.A., Musaev, F.A., Krelowski, J., & Walker, G.A.H. 2000, PASP, 112, 648
- (16) Glinski, R.J., & Anderson, C.M. 2002, MNRAS, 332, L17
- (17) Herbig, G.H. 1993, ApJ, 407, 142
- (18) Herbig, G.H. 1995, ARA&A, 33, 19
- (19) Hobbs, L.M. 1978, ApJSS, 38, 129
- (20) Huggins, P.J., Cox, P., Forveille, T., Bachiller, R., & Young, K. 1999, in IAU Symposium 191, Asymptotic Giant Branch Stars, ed. T. Le Bertre, A. Lebre & C. Waelkens (Astronomical Society of the Pacific), 425
- (21) Keenan, F.P., Conlon, E.S., Brown, P.J.F., & Dufton, P.L. 1988, A&A, 192, 295
- (22) Kendall, T.R., Mauron, N., McCombie, J., & Sarre, P.J. 2002, A&A, 387, 624
- (23) Kendall, T.R., Mauron, N., McCombie, J., & Sarre, P.J. 2004, Ap&SS, 289, 203
- (24) Klochkova, V.G., Szczerba, R., Panchuk, V.E., & Volk, K. 1999, A&A, 354, 905
- (25) Klochkova, V.G., Szczerba, R., & Panchuk, V.E. 2000, Astr. Lett., 26, 88
- (26) Klochkova, V.G., Panchuk, V.E., & Szczerba, R. 2001, in Post-AGB objects as a Phase of Stellar Evolution, ed. R. Szczerba & S.K. Gorny (Kluwer Academic Publishers), 265
- (27) Kumar, C.K. 1986, ApJ, 306, 38
- (28) Le Bertre, T. 1990, A&A, 236, 472
- (29) Le Bertre, T., & Lequeux, J. 1992, A&A, 255, 288
- (30) Le Bertre, T., & Lequeux, J. 1993, A&A, 274, 909
- (31) Rao, N.K., & Lambert, D.L. 1993, MNRAS, 263, L27
- (32) Rodriguez, L.F., Goss, W.M., & Williams, R. 2002, ApJ, 574, 179
- (33) Sarre, P.J., Miles, J.R., & Scarrott, S.M. 1995, Science, 269, 674
- (34) Scarrott, S.M., Watkin, S., Miles, J.R., & Sarre, P.J. 1992, MNRAS, 255, 11
- (35) Schlegel, D.J., Finkbeiner, D.P., & Davis, M. 1998, ApJ, 500, 525.
- (36) Shields, G.A. 1983, in Planetary Nebulae, ed. D.R. Flower (IAU), 259
- (37) Speck, A.K., Meixner, M., Fong, D., McCullough, P.R., Moser, D.E., & Ueta, T. 2002, AJ, 123, 346
- (38) Snow, T.P. 1973, PASP, 85, 590
- (39) Snow, T.P., Wallerstein, G. 1972, PASP, 84, 492
- (40) Van Winckel, H., Cohen, M., & Gull, T.R. 2002, A&A, 390, 147
- (41) Volk, K., Dinerstein, H., & Sneden, C.1997, in IAU Symposium 180, Planetary Nebulae, ed. H.J. Habing & H.J.G.L.M. Lamers (Kluwer Academic, Publishers, Dordrecht), 284
- (42) Walker, G.A.H., Bohlender, D.A., & Krelowski, J. 2000, ApJ, 530, 362
- (43) Waters, L.B.F.M., Lamers, H.J.G.L.M., Snow, T.P., et al. 1989, A&A, 211,208
- (44) Young, K., Cox, P., Huggins, P.J., Forveille, Y., & Bachiller, R. 1997, ApJ, 482, L101
- (45) Young, K., Cox, P., Huggins, P.J., Forveille, T., & Bachiller, R. 1999, ApJ, 522, 837
- (46) Zacs, L., Schmidt, M.R., & Szczerba, R. 1999, MNRAS, 306, 903
- (47) Zacs, L., Spelmanis, R., Musaev, F.A., & Galazutdinov, G.A. 2003, MNRAS, 339, 460