Evidence for a Geometrically Thick Self-Gravitating Accretion Disk in NGC 3079
Abstract
We have mapped, for the first time, the full velocity extent of the water maser emission in NGC 3079. The largely north-south distribution of emission, aligned with a kpc-scale molecular disk, and the segregation of blue- and red-shifted emission on the sky are suggestive of a nearly edge-on molecular disk on pc-scales. Positions and line-of-sight velocities of blue- and red-shifted maser emission are consistent with a central mass of enclosed within a radius of pc. The corresponding mean mass density of pc-3 is suggestive of a central black hole, which is consistent with the detection of hard X-ray excess ( keV) and an Fe K line from the nucleus. Because the rotation curve traced by the maser emission is flat, the mass of the pc-scale disk is significant with respect to the central mass. Since the velocity dispersion of the maser features does not decrease with radius and constitutes a large fraction of the orbital velocity, the disk is probably thick and flared. The rotation curve and the physical conditions necessary to support maser emission imply a Toomre -parameter that is . Thus, the disk is most likely clumpy, and we argue that it is probably forming stars. Overall, the accretion disk in NGC 3079 stands in contrast to the compact, thin, warped, differentially rotating disk in the archetypal maser galaxy NGC 4258.
We have also mapped radio continuum emission in the vicinity of the disk and identify a new, time-variable, non-thermal component (E) that is not collinear with the previously imaged putative jet. Based on the large luminosity and the unusually steep spectrum (), we exclude a radio supernova as the progenitor of E. However, because its spectrum is consistent with an aging electron energy distribution, E might be a rapidly cooling remnant, which may indicate that the jet axis wobbles. Alternatively, considering its location, the component might mark a shock in a wide-angle outflow that is interacting with a dense ambient medium. In this context, masers at high latitudes above the disk, mapped in this and previous studies, may be tracing an inward extension of the kpc-scale bipolar wide-angle outflow previously observed along the galactic minor axis.
1 Introduction
NGC 3079 is a relatively nearby ( km s-1), edge-on spiral galaxy classified as Seyfert 2 (Ford et al. 1986; Ho, Filippenko, & Sargent, 1997) or a LINER (Heckman, 1980). Observations of large-scale structure in this galaxy indicate the presence of a powerful outflow that appears to originate within the nucleus. Along the minor axis of the galaxy, at a position angle (P.A.) of , a bipolar super-wind inflates a kpc-scale superbubble visible in radio continuum emission (Duric & Seaquist, 1988; Baan & Irwin, 1995; Irwin & Saikia, 2003), [NII]+ emission (Veilleux et al., 1994), and soft X-ray continuum emission (Cecil, Bland-Hawthorn, & Veilleux, 2002). The apex of the superbubble is embedded in a dense molecular kpc-scale disk traced by CO (Koda et al., 2002), HCN, and HCO+ emission (Kohno et al., 2001). The circumnuclear molecular disk is aligned with, and rotates in the same sense as, the much larger galaxy disk such that the north side is approaching and the near side is projected to the west of its major axis.
There is compelling evidence that NGC 3079 contains an active galactic nucleus (AGN). The X-ray spectrum exhibits a continuum excess in the keV band and a keV Fe K line, which are both believed to be unambiguous indicators of nuclear activity (Iyomoto et al., 2001; Cecil et al., 2002). Both soft and hard X-ray data are suggestive of unusually high hydrogen column density towards the nucleus, cm-2 (Iyomoto et al., 2001), which, in the context of the AGN unified model, is indicative of an almost edge-on obscuring structure along the line of sight to the nucleus (Lawrence & Elvis, 1982; Antonucci, 1993). The existence of nuclear activity is also indirectly supported by radio observations of the nucleus. Continuum images of the inner-pc region obtained with Very Long Baseline Interferometry (VLBI) reveal a linear distribution of compact knots consistent with a jet (Irwin & Seaquist, 1988). Furthermore, the galaxy harbors one of the most luminous (i.e., assuming isotropic emission of radiation) water masers known (Henkel et al., 1984; Haschick & Baan, 1985), and such maser emission generally is associated with AGN activity (Braatz, Wilson, & Henkel, 1997). In fact, the isotropic luminosity of the brightest, spatially unresolved spectral feature in NGC 3079 () is comparable to luminosities of other AGN related masers such as NGC 4258 and NGC 1068 but at least two orders of magnitude greater than the isotropic luminosity corresponding to the total integrated maser flux from starburst galaxies such as M82 (Baudry, Brouillet, & Henkel, 1994) and NGC 253 (Ho et al., 1987) and from the W49N maser, the most luminous maser in our galaxy associated with a region of intense star formation (Gwinn, 1994).
The nucleus of NGC 3079 may also host a starburst; the most convincing evidence comes from infrared (IR) and far-infrared (FIR) observations. Lawrence et al. (1985) found color excess and an extended m nuclear source indicative of large amounts of dust in the nuclear region. The IRAS to m flux ratio is , which is suggestive of warm dust on kpc scales and qualifies NGC 3079 as a starburst galaxy (Soifer et al., 1989; Braine et al., 1997). FIR observations of the galaxy with ISOPHOT reveal a powerful point source of FWHM kpc coincident with the nucleus (Klaas & Walker, 2002). The SED of this point source is indicative of K dust temperature. The luminosity of from IRAS (Soifer et al., 1987) or from ISOPHOT (Klaas & Walker, 2002) yields a star formation rate of yr-1 on kpc scales (Veilleux et al., 1994), under the assumption that star formation alone contributes to the infrared flux. The presence of nuclear star formation may also be inferred from large quantities of molecular gas associated with the nucleus. The observations of CO emission indicate a dynamical mass of enclosed within a radius of pc (Koda et al., 2002), as well as an unusually large molecular surface gas density relative to other normal, starburst, or active galaxies of pc-2 (Planesas, Colina, & Perez-Olea 1997; Sakamoto et al., 1999; Koda et al., 2002). Although sufficient to fuel a starburst, such a high concentration of gas does not necessarily imply intense nuclear star formation (Jogee, 2001). However, the dynamical and gas masses deduced from CO observations by Koda et al. (2002) are suggestive of a Toomre- parameter that is less than unity within 150 pc of the nucleus and for isothermal sound speeds km s-1, consistent with the presence of molecular gas. Thus, the unusually high concentration of gas in the nucleus of NGC 3079 is subject to gravitational instabilities and might be actively forming stars. Detailed studies of the kpc-scale superbubble are also indicative of the nuclear starburst. The inferred starburst age ( years) and gas depletion time ( years) are longer than the dynamical age of the superbubble ( years), which is consistent with a starburst driving the bubble expansion (Veilleux et al., 1994). Furthermore, based on (1) the similarity of the superwind in NGC 3079 to that in prominent starburst galaxies like M82 and NGC 253 and (2) the general lack of correlation between the properties of outflow and nuclear activity in a sample of galaxies, Strickland et al. (2004a) argue that supernova feedback is responsible for the superbubble in NGC 3079. The correlation between diffuse halo X-ray luminosity per unit stellar mass and the infrared luminosity per unit mass in a sample of seven starburst and three “normal” galaxies (see Fig.4 in Strickland et al., 2004a) is supportive of the starburst hypothesis, although that correlation does not imply causation particularly in the context of an alleged starburst-AGN connection.
Arguments have been made against the existence of a nuclear starburst in NGC 3079. The ratio of FIR luminosity to the molecular gas mass (i.e., the star formation efficiency) computed on kpc scales is , which is greater than the value of for the Milky Way and for Giant Molecular Clouds, but below the average value of observed for starburst galaxies (Young et al., 1986; Planesas et al., 1997). In fact, small-beam () m flux of NGC 3079 measured by Lawrence et al. (1985) yields of only on smaller scales, which is suggestive of low star formation efficiency in the nuclear region (Hawarden et al., 1995). Furthermore, since the m flux in a aperture is only 4% of the larger beam color corrected IRAS flux, the infrared emission is not centrally concentrated, contrary to expectation for a nuclear starburst (Devereux, 1987). The nuclear region of NGC 3079 ( pc) is characterized by a flat spectrum between and m in contrast to what is observed for starburst galaxies (Lawrence et al., 1985; Hawarden et al., 1986; Klaas & Walker, 2002). According to Hawarden et al. (1995), low extinction towards the parts of the nucleus not obscured by the molecular disk, the lack of a m compact source coincident with the relatively well-defined apex of the superbubble, as well as the unusually high HBr ratio all argue against the starburst hypothesis. However, the validity of these arguments may be in doubt because of extremely heavy obscuration in the nuclear region due to dust lanes and the massive kpc-scale molecular disk. Indeed, asymmetry in the K-band image of the nucleus implies considerable extinction even at m (Israel et al., 1998).
If the nuclear starburst hypothesis is accepted, then it is not unreasonable to suppose the coexistence of star formation and nuclear activity in the inner parsec of NGC 3079, although the particular relationship between the two remains uncertain. It has been suggested that star formation and nuclear activity are likely to coexist in galactic nuclei, either because they are coupled through evolutionary mechanisms, or simply because they both depend on gas inflow and accretion (Cid Fernandes et al., 2001, and references therein). The existence of star formation and of young stellar populations with ages of years in the circumnuclear tori of radii pc has been proposed to explain the UV excess of many Seyfert 2 galaxies (Terlevich, 1996). Our galaxy contains a population of young, hot, bright, and massive stars within the inner-pc of the central black hole (Genzel et al. 1996, 2003), which might have formed in-situ in a preexisting accretion disk (Milosavljević & Loeb, 2004). A young stellar population with an age of years has been found in the central 12 pc of the Circinus active galaxy (Maiolino et al., 1998), and young massive stars with ages years have been unambiguously detected within pc of to of Seyfert 2 nuclei surveyed (Mas-Hesse et al., 1994, 1995; Cid Fernandes et al., 2001, and references therein). Because of the likely coexistence of star formation and nuclear activity in NGC 3079, the proximity of the galaxy, the presence of maser emission, and apparent jet activity, NGC 3079 is an important case to study with regard to understanding connections between star formation and nuclear activity.
1.1 Previous Imaging Studies of the Nucleus
1.1.1 Continuum
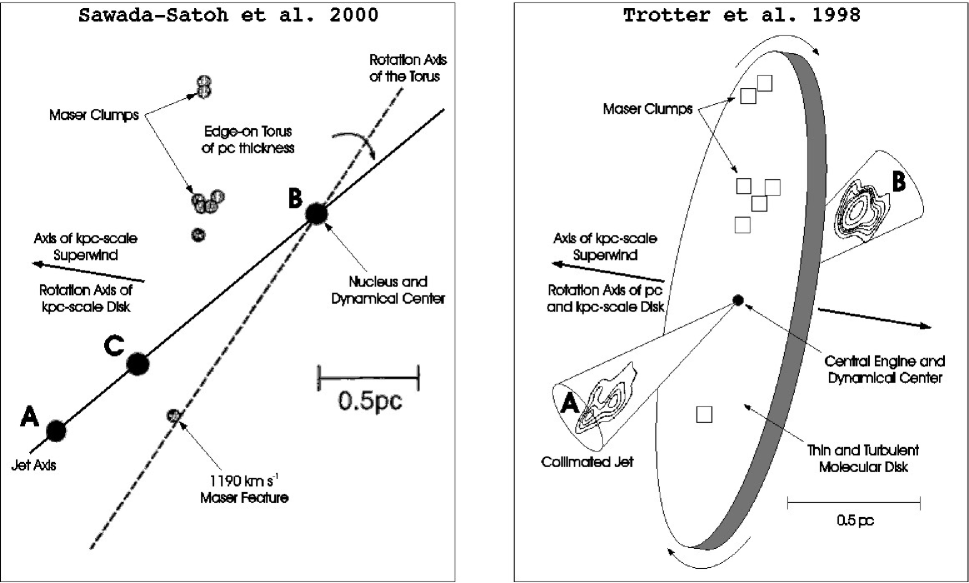
VLBI continuum images of NGC 3079 (refer to Fig.1 for a schematic) reveal several collinear components, A, B, C, and D, extending over pc ( mas) at P.A. (Irwin & Seaquist, 1988; Trotter et al., 1998; Sawada-Satoh et al., 2000, 2002). A line connecting the continuum components is significantly misaligned with respect to the superbubble axis but approximately aligned with the southern edge of the bubble (Cecil et al., 2001). Components A and B are separating at about , which strongly indicates the presence of a jet (Trotter et al., 1998; Sawada-Satoh et al., 2000, 2002), while the dominant component B is stationary with respect to the molecular gas supporting the maser emission to within a transverse speed of (Sawada-Satoh et al., 2000). These observations led Sawada-Satoh et al. (2000) to identify component B with the central engine. However, this interpretation is not unique since, even if component B were a radio jet core, an offset of the core from the central engine could be significant (e.g., NGC 4258; Herrnstein et al., 1997). Component B would also remain stationary with respect to the maser if B were shock excited emission, as would occur where a hot ionized supersonic flow encounters a dense ambient medium (e.g., Phillips & Mutel, 1982; O’Dea, Baum, & Stanghellini, 1991; Aurass, Vršnak, & Mann, 2002, Kellermann et al. 2004). In support of the latter hypothesis, Trotter et al. (1998) found that components A and B have similar spectra, exhibit spectral turnovers between 5 and 22 GHz, and consist of multiple components or extensions. Since its spectrum is not flat, B is most likely not a jet core. Instead, Trotter et al. (1998) suggested that both components are lower redshift and lower luminosity counterparts of compact symmetric objects whose flux densities have been observed to peak at gigahertz frequencies and which are ascribed to the interaction between jets and associated high-density nuclear gas.
The putative jet coexists with additional non-thermal sources of continuum emission, whose nature remains ambiguous. Component E, identified by Kondratko, Greenhill, & Moran (2000), and component F, identified by Middelberg et al. (2003), both lie and pc approximately east of component B, respectively. Middelberg et al. (2003) found that the separation of components E and B at 5 GHz systematically decreases at a rate of (i.e., roughly one beam width over years). These authors suggested that E is stationary and that component B is moving toward E. However, this proposition seems unlikely since B appears to be stationary with respect to the extended molecular gas structure underlying the maser emission. A more realistic scenario is that component E is a pattern in a flow that only appears to move in the direction of B as its physical characteristics change. Such apparently inward motions have been observed in several quasar and AGN jets (Kellermann et al. 2004).
1.1.2 Maser
In previous observations (Fig. 1), the water maser in NGC 3079 was found to be distributed in a disordered linear structure along P.A., aligned with the larger circumnuclear CO disk at P.A. (Trotter et al., 1998; Koda et al., 2002). Unlike the archetypal water megamaser NGC 4258, the maser in NGC 3079 displays significant structure orthogonal to the general elongation and large velocity dispersion ( km s-1) in relatively compact areas on the sky ( pc). Although no simple rotation law fits the data well, the velocity distribution of the maser emission is consistent with a binding mass of and indicates that the pc-scale accretion disk rotates in the same sense as the kpc-scale molecular disk. The maser predominantly traces the approaching side of the disk and thus reveals considerable asymmetry with the blue-shifted emission significantly dominating the detected flux density. In particular, the maser emission extends roughly from to km s-1 with most emission lying between and km s-1. In addition to the main distribution of the maser emission at P.A., Trotter et al. (1998) found two maser features that define a second axis at P.A.. Since one of these two maser features coincides on the sky with component C and the other is in close proximity to component B, they may constitute a second population of water masers in which amplification of the continuum components might play a role.
The difficulty in interpreting the maser data has resulted in two very different models for the nuclear region in NGC 3079 (Fig. 1). Relying on the apparent alignment of the distribution of the maser emission with the kpc-scale molecular structure, Trotter et al. (1998) proposed a largely north-south, relatively thin, turbulent, and highly-inclined accretion disk for the geometry of the nuclear region (Fig. 1). In this model, the dynamical center is located between components A and B, while the maser emission occurs on the surface of the disk in shocks stimulated by the interaction of a nuclear wind with the disk. The asymmetry in blue- and red-shifted flux density is attributed to free-free absorption in the ionized wind, related to the off-axis outflow as traced by components A, B, and C.
The model proposed by Trotter et al. (1998) differs significantly from that proposed by Sawada-Satoh et al. (2000). According to these authors, the observed velocity drift of the maser feature at km s-1 is much larger than the velocity drift of the other maser features and is due to centripetal acceleration. In a rotating system, only the maser features nearest in projection to the rotation axis are expected to show large velocity drifts. Consequently, the rotation axis would have to pass close to the km s-1 feature and through component B, the proposed location of the dynamical center. In this model (Fig. 1), the masers are embedded in a torus of parsec thickness misaligned with respect to the kpc-scale molecular disk by . It is not clear why the embedded maser emission should be distributed along the observed locus. However, the outflow axis is misaligned with respect to the minor axis of the pc-scale rotating structure significantly more in the Trotter et al. (1998) model than in the Sawada-Satoh et al. (2000) model.
1.2 Motivation
The Trotter et al. (1998) and Sawada-Satoh et al. (2000) models for the nuclear region of NGC 3079 differ primarily in the location of the dynamical center as well as in the thickness and orientation of the rotating structure. It is thus not clear what is the correct geometric model for the inner parsec, what stimulates the maser emission, and why it predominantly traces the regions of the molecular disk approaching the observer. Ambiguity also remains about the connection of the continuum components and the disk and the central engine, about the relationship, if any, between the nuclear activity and the starburst, and about the connection between the pc and kpc-scale outflows in this galaxy. Our study of NGC 3079 is motivated by these outstanding questions and by the disagreements between the two existing models.
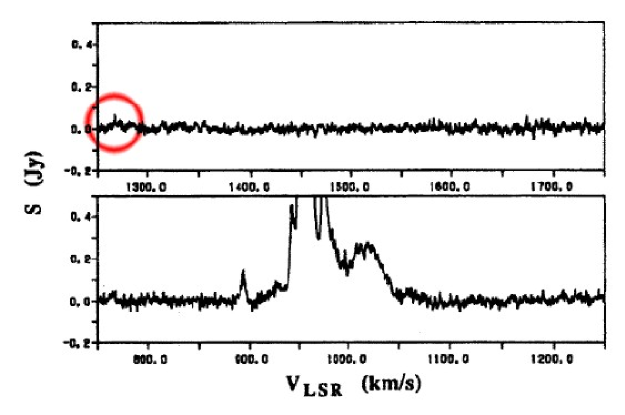
In an effort to better understand the nuclear region in NGC 3079, we attempted to fit a geometric and dynamical model of an inclined, thick, turbulent disk to the maser positions and velocities reported by Trotter et al. (1998). The model not only reproduced the known emission at velocities km s-1 but also predicted the existence of emission at velocities km s-1 located roughly south from the known blue-shifted emission. No previous VLBI observation had explored the velocities above km s-1. However, Nakai et al. (1995) marginally detected a Jy peak at km s-1 using the 45-m telescope of the Nobeyama Radio Observatory (Fig. 2). Motivated by this detection, we imaged with VLBI the water maser emission in NGC 3079 in order to determine whether the red-shifted emission lay south of the blue-shifted emission as predicted by our model. Recently, more red-shifted features have been detected with the Effelsberg 100-m antenna (Hagiwara et al., 2002). In this study, we present the first VLBI map of the red-shifted side of the accretion disk in NGC 3079, and thereby hope to clarify the geometry of the inner-pc.
Data calibration and reduction techniques are discussed in Section 2. Spectral-line and continuum images of the inner-pc region are presented in Section 3. In Section 4 we interpret the observed kinematics of the maser in terms of a thick, flared, disordered, self-gravitating, and clumpy pc-scale disk, which orbits a central mass of enclosed within pc. In this work we assume that NGC 3079 is at a distance of Mpc (Tully, Shaya, & Pierce, 1992), so that mas corresponds to pc. All velocities have been computed in accordance with the radio definition of Doppler shift and in the local standard of rest (LSR) frame.
2 Observations and Calibration
NGC 3079 was observed in spectral-line mode with the Very Long Baseline Array (VLBA), augmented by the phased VLA and the Effelsberg (EB) 100-m antenna, for approximately 12 hours on 2001 March 23. The source was observed with MHz intermediate-frequency (IF) bands, which covered a velocity range of to km s-1. The , , and GHz radio continuum observations were made on 1996 December 2 with the VLBA and the VLA phased array. The source was observed with a MHz bandwidth in each polarization and for approximately three hours at each frequency. Both spectral and continuum data were processed with the VLBA correlator at the NRAO.111The National Radio Astronomy Observatory is operated by Associated Universities, Inc., under cooperative agreement with the National Science Foundation
The data were reduced and calibrated with standard continuum and spectral-line VLBI techniques in AIPS222Astronomical Image Processing System. The amplitude calibration for the two experiments included corrections for atmospheric opacity. Antenna gain curves and measurements of system temperature were used to calibrate amplitude data for each of the VLBA stations. Amplitude calibration for the VLA was based on VLA scans of 3C 286, for which we adopted a GHz flux density of Jy, and on bootstrapping of flux densities for VLBI calibrators. To minimize systematic errors due to atmospheric opacity effects, only the VLA scans of VLBI calibrators obtained near the elevation of 3C 286 were used in bootstrapping. The data in each polarization were corrected for the effect of time variable source parallactic angle, and the station positions were corrected for motions due to plate tectonics by utilizing the US Naval Reference Frame solutions 9810 and 9513.
In the , , and GHz data, the residual delays and fringe rates due to the troposphere and clock uncertainties were removed via observations of calibrators 4C 39.25, 3C 273, OJ 287, and OQ 208. The final images of the nuclear region of NGC 3079 were obtained through application of self-calibration. In the spectral data, the complex bandpass shape and any electronic phase difference between the IF bands were removed by observation of calibrators 4C 39.25, 1150+812, 1308+326, and 3C 345. The position of the maser was corrected by a fringe rate analysis of 10 spectral channels including the brightest spectral feature at km s-1 with the result , . Phase and amplitude fluctuations due to troposphere and clock uncertainties were removed by self-calibration of the brightest maser feature at km s-1 and application of the resulting solution to all spectral channels in all IF bands. After calibrating and imaging the spectral-line data set, the relative positions of the maser features were obtained by fitting two-dimensional elliptical Gaussians to the distribution of the maser emission in each spectral channel. We obtained a continuum image at GHz by averaging all line-free frequency channels. Table 1 lists beam dimensions and noise levels at each frequency. Table 2 lists the properties of all spectral-line observations of the water maser with the VLBA. The experiment presented in this study images the widest velocity range of emission among all VLBA observations made to-date.
| Frequency | Major | Minor | P.A. | RMS |
|---|---|---|---|---|
| (GHz) | (mas) | (mas) | () | (mJy beam-1) |
| 5 | ||||
| 8 | ||||
| 15 | ||||
| 22 | aacontinuum,bbspectral-line for a channel width of km s-1. |
| Trotter et al. 1998 | Sawada-Satoh et al. 2000 | This study | |
|---|---|---|---|
| Date | 1995 Jan 9 | 1996 Oct 20 | 2001 Mar 23 |
| RangeaaTotal velocity coverage in km s-1 | |||
| bbChannel spacing in km s-1 | |||
| ccThe rms noise level in the pseudo continuum image in Janskys | |||
| ddThe rms noise level in the spectral-line image in Janskys |
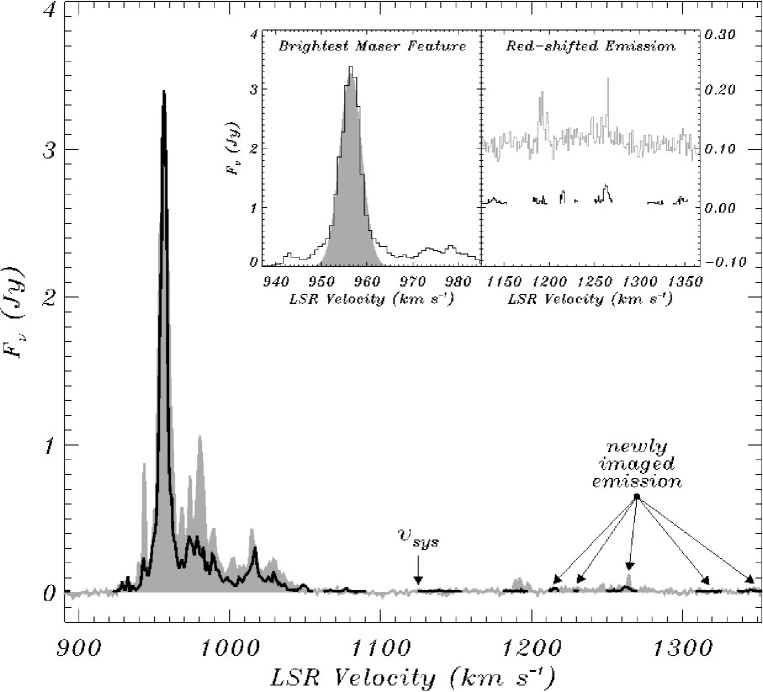
To estimate the fraction of the power imaged by the interferometer, we acquired a single-dish spectrum of NGC 3079 (see Fig.3) by position-switching in a single polarization mode with the NASA Deep Space Network 70-m antenna in Robledo, Spain, on 2003 February 4, using an observing setup similar to that described in Greenhill et al. (2003). After integrating for a total of hours, we achieved an rms noise level in the spectrum of mJy for km s-1 channel spacing. The antenna gain curve was obtained in a single track by measurement of the elevation dependence of 1308+326 antenna temperature, corrected for atmospheric opacity estimated from a tipping scan. The antenna efficiency was estimated to be based on several measurements of antenna temperature for 3C286. From the rms deviation of our gain measurements about the best fit polynomial and the formal uncertainty in the efficiency, we estimate that the gain calibration of the antenna is accurate to within %.
3 Results
3.1 Maser
In agreement with previous observations of NGC 3079, we found that the maser exhibits a conspicuous asymmetry whereby the blue-shifted emission significantly dominates the detected flux density (Fig. 3). The spectrum of the imaged power agrees satisfactorily with the spectrum detected with the Effelsberg 100-m antenna 10 days prior to the VLBI observation (see Fig.2c in Hagiwara et al., 2002). The observation with the NASA Deep Space Network 70-m antenna in Robledo, Spain, conducted 1.9 years later showed significant flux variability throughout the spectrum except for the strongest feature (Fig. 3). Such variations, however, are not unusual since single-dish monitoring of the maser has revealed substantial flux variability on timescales of years (Nakai et al., 1995; Baan & Haschick, 1996; Hagiwara et al., 2002).
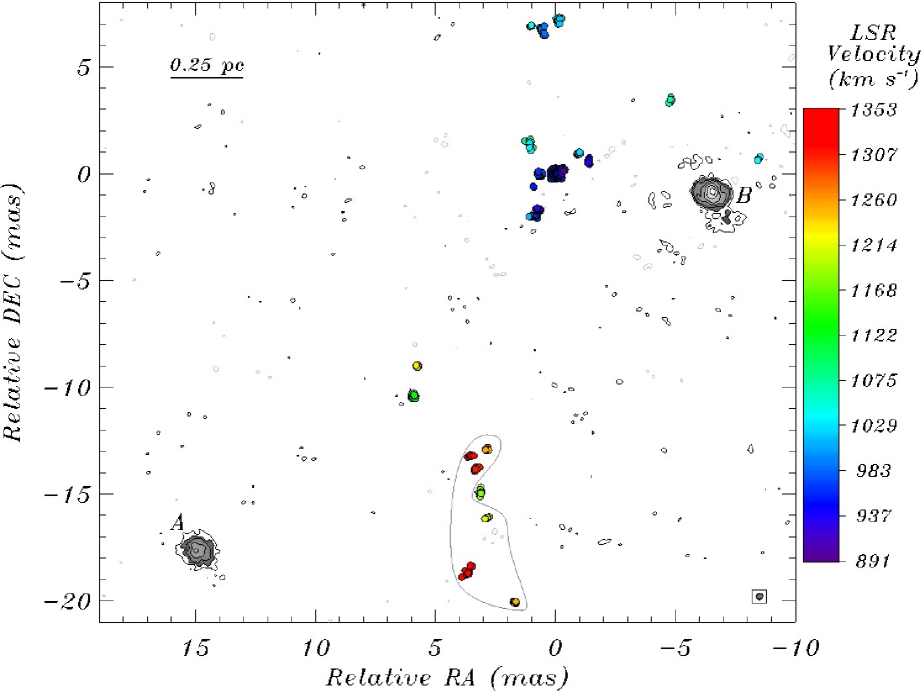
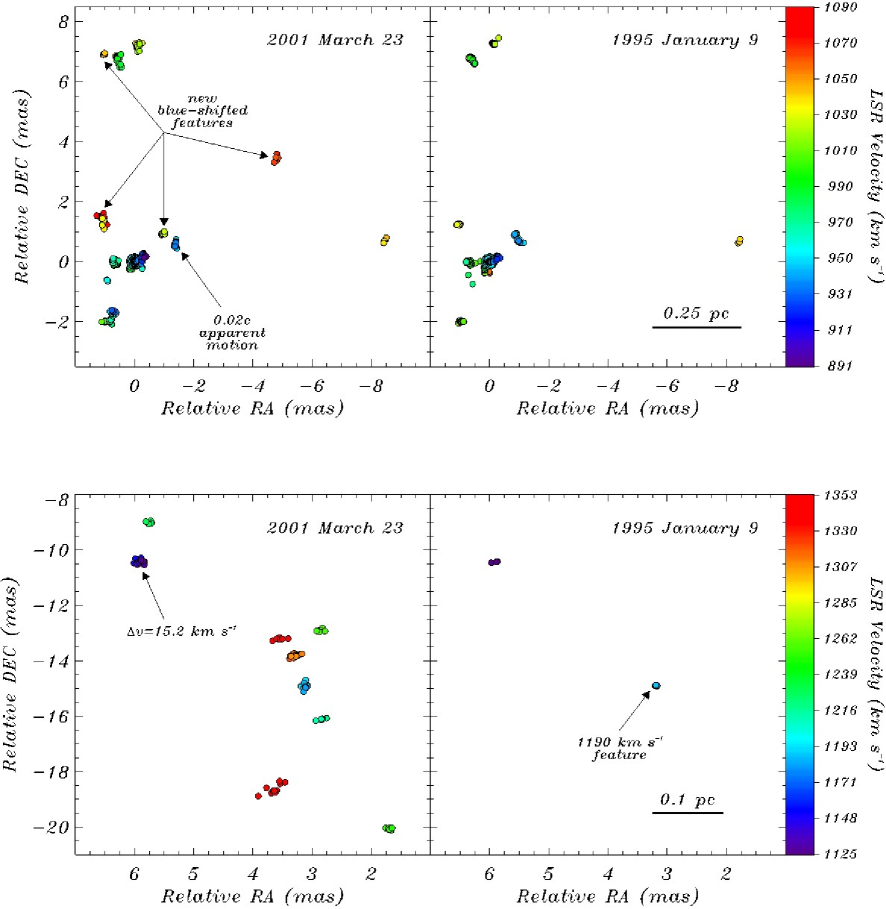
As with the previous investigations (Trotter et al., 1998; Sawada-Satoh et al., 2000), we found that the maser emission is distributed in a disordered linear structure at P.A. (Fig. 4). Furthermore, the distribution of emission on the sky is clearly segregated by velocity with emission blue- and red-shifted with respect to the systemic velocity located in the northern and southern section of the image, respectively. To determine temporal changes in the maser distribution, we compared the maser positions obtained here with those of Trotter et al. (1998). Both the 1995 January 9 (Trotter et al., 1998) and the 2001 March 23 (this study) epochs were calibrated by referencing the phases of all spectral channels to the brightest maser feature at km s-1 and thereby are most likely registered to the same volume of masing gas. Indeed, three-dimensional flux density-weighted correlation of the distribution of the maser emission presented in this study with that presented in Trotter et al. (1998) indicates that the two epochs are aligned to within km s-1 in velocity and are registered by the self-calibration technique to within mas on the sky ( mas corresponds to a transverse speed of over years and is not an intrinsic measurement limit on the maser proper motions). In fact, spectra of nearly half of the maser emission clumps imaged in both Trotter et al. (1998) and this study peak within 3.2 km s-1 of each other, which is comparable to the km s-1 half width of the brightest maser feature (Fig. 3). The comparison of the two epochs (Fig. 5) indicates that (1) the newly imaged red-shifted emission is confined to a region south to south-west from the previously known blue-shifted features, (2) several new blue-shifted features have appeared, (3) the maser feature located at mas appears to have drifted in velocity from 1123 to km s-1, a change of km s-1 in 6.25 years, and (4) the maser feature located at velocity km s-1 and at position mas appears to have moved westward with velocity of ( km s-1). The latter two cases might each be due to variability of separate and distinct gas clumps rather than physical motions. Note that the maser feature that has drifted in velocity between Trotter et al. (1998) and this study is significantly displaced on the sky from the km s-1 maser feature [located at () mas], on whose velocity drift the model of Sawada-Satoh et al. (2000) depends. Based on the Trotter et al. (1998) and Hagiwara et al. (2002) studies, we place an upper limit of km s-1 yr-1 on the velocity drift of the km s-1 feature.
3.2 Continuum
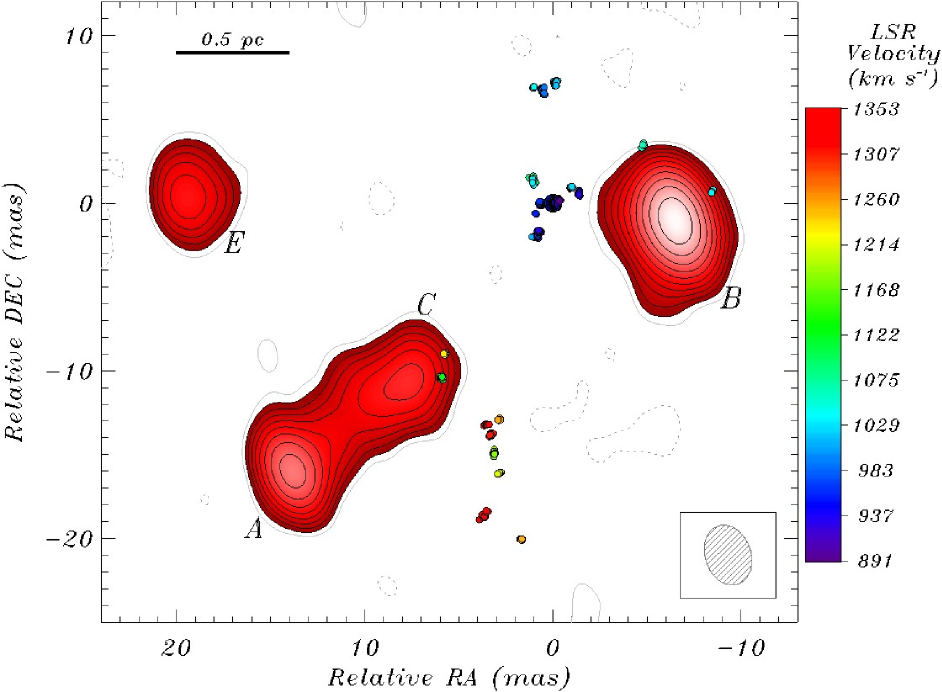
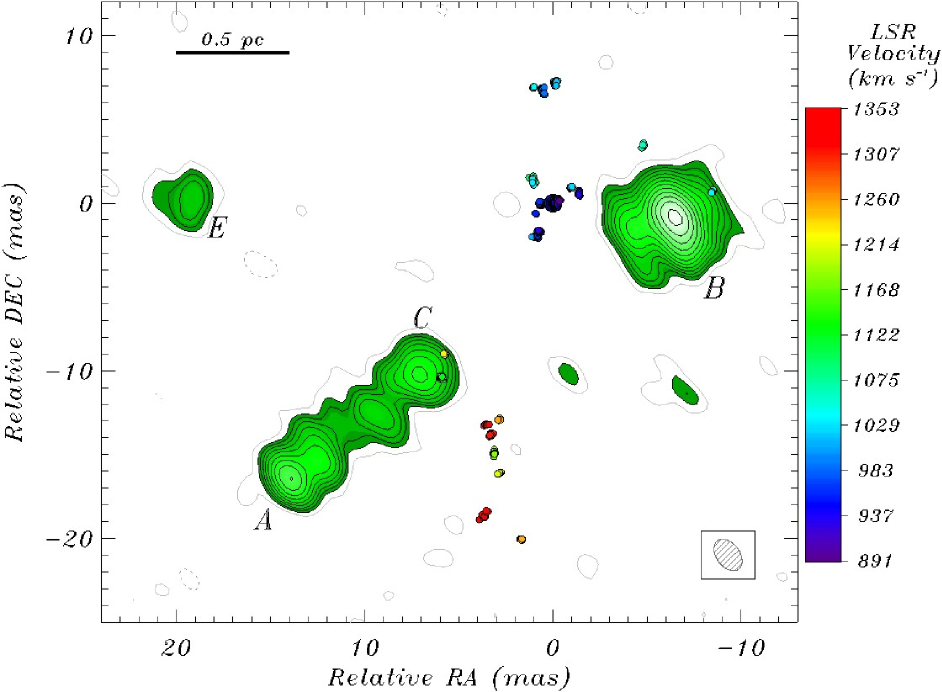
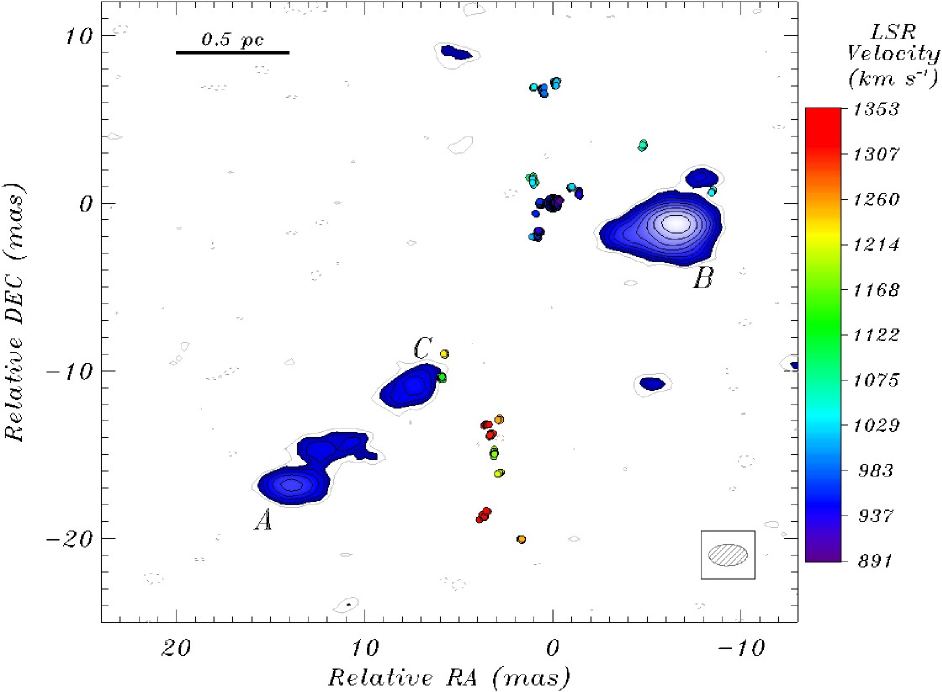
Components A and B were detected at all frequencies while component C was detected at 5, 8, and 15 GHz, but not at 22 GHz (Fig. 6, 7, 8, and 4). In agreement with previous reports, components A, B, and C are collinear along the position angle of . To estimate the flux density, position, and position uncertainty of each continuum component, we fitted multiple two-dimensional Gaussian model components to the emission peaks at each frequency (Table 3). In agreement with previous reports (e.g., Sawada-Satoh et al., 2000) and supplementing our data with published positions, we found that the systematic motion of component A at 22 GHz is consistent with a transverse speed of along P.A. of , which is approximately away from component B (Fig.9). Note that the change (typical magnitude of mas) from epoch to epoch in the position of component B with respect to the reference maser feature does not appear to be systematic and is inconsistent with formal measurement uncertainties (Fig. 9). This observed scatter might be due to the change in morphology or position of either component B or the reference maser feature. However, the time average position of component B is approximately stationary with respect to the maser emission. We emphasize that the jitter of component B, like the motion of E in the direction of B reported by Middelberg et al. (2003), might not be a real but an apparent motion due to changing source characteristics in a flow or across shocks (e.g., Kellermann et al. 2004).
| Frequency | Component | Major | Minor | P.A. | |||
| (GHz) | (mJy) | (mas) | () | (mas) | (mas) | () | |
| 5 | B | — | — | ||||
| A | |||||||
| C | |||||||
| E | |||||||
| 8 | B | — | — | ||||
| A | |||||||
| C | |||||||
| E | |||||||
| 15 | B | — | — | ||||
| A | |||||||
| C | |||||||
| 22 | B | — | — | ||||
| A |

We confirmed the spectral turnover reported by Trotter et al. (1998) of components A and B and constrain the frequency of this turnover to the range between 5 and 15 GHz (Fig. 10). To place more stringent constraints on the turnover frequencies, we considered two simple spectral models for each component. In the first model, we assumed that at lower frequencies the spectra are dominated by synchrotron self-absorption () intrinsic to the source, while at higher frequencies the spectra are determined by optically-thin synchrotron emission () also internal to the source. Under these assumptions, the spectra of components A and B can be characterized by , where , , and are parameters of the model. The flux densities measured at three frequencies for each component uniquely determine the three parameters of the model, which yielded and , and turnover frequencies (i.e., frequency of maximum flux density) of and GHz for components A and B, respectively. For the data reported by Trotter et al. (1998), we obtained and , and turnover frequencies of and GHz for components A and B, respectively. However, if free-free absorption () extrinsic to the source dominates at lower frequencies instead of synchrotron self-absorption, then the spectra of components A and B can be modelled by (e.g., Bicknell, Dopita, & O’Dea, 1997; Tingay & Murphy, 2001). For this model, we obtained and as well as turnover frequencies of and GHz for components A and B, respectively. Similarly, the flux densities reported by Trotter et al. (1998) yielded and as well as peak locations of and GHz. Thus, for both models and for both data sets, spectral turnover frequencies lie in the range GHz.
The spectra of components A and B are reminiscent of spectra of gigahertz peaked spectrum (GPS) sources, as already noted by Trotter et al. (1998). These sources are thought to arise from regions where jets interact with the dense ambient gas (e.g., Bicknell et al., 1997). Their spectra peak in the frequency range of GHz with high-frequency spectral indices of and low-frequency indices of . Because of the similarity between the two components and the GPS sources, we suggest that components A and B arise in regions where a relativistic outflow is interacting with a dense ambient medium. Since components A and B consist of multiple components and do not exhibit a flat spectrum, neither A nor B is likely to be a jet core (cf. Sawada-Satoh et al., 2000).
Trotter et al. (1998) reported a detection at GHz with a signal-to-noise ratio (S/N) of of a compact mJy component (D) located pc southeast of B and collinear with components A, B, and C. However, we found no evidence above the mJy level of this component at 5 GHz. Since the 5 GHz beam area of Trotter et al. (1998) was larger than the 5 GHz beam area in our study, the non-detection of D could be due to either resolution effects or source variability. Component D was also not detected at 5 GHz by Middelberg et al. (2003).

The continuum images at 5 and 8 GHz revealed a new component (E) that is not collinear with previously known components A, B, C, and D (Fig. 6 and Fig. 7). We detected component E with an S/N of 31 and 16 at 5 and 8 GHz, respectively (Kondratko et al., 2000). Middelberg et al. (2003) confirmed the detection of E and also reported identification at 1.7 and 2.3 GHz of a new component F located roughly pc from component B along P.A. of . Since the beam size in the Trotter et al. (1998) study was larger than the beam size in our study, component E should have been detected by Trotter et al. (1998) with an S/N of at least 17 at 5 GHz if its flux density were constant. The failure of Trotter et al. (1998) to detect E indicates that the source is most likely time variable. Indeed, comparison of our results with those of Trotter et al. (1998) reveals variation in the flux density of continuum component A at GHz by a factor of over years. If we compare the results of Sawada-Satoh et al. (2000) and of this study, the variation in the flux density of component A at GHz could have been as large as a factor of over years (we note that, although the GHz beam of Sawada-Satoh et al. (2000) is larger, they fail to detect component A). In both cases, the timescale of variability is greater than the light travel time within the components ( yr).
Our flux density estimates for component E indicate a spectral index of between 5 and 8 GHz and a spectral index of between 8 and 15 GHz (Fig.10). The high-frequency decline in the flux density of component E is too steep to be consistent with optically-thin synchrotron emission [], since it would require , much greater than the normally assumed value of , where is the power law index on the electron energy distribution []. However, for a situation in which there is no continuous injection of electrons into the synchrotron source and the pitch angle distribution remains conserved, the cooling of high-energy electrons leads to a spectral index of above a break frequency GHz (Kardashev, 1962). Hence, nominally, a field of mG would give GHz after a cooling time of years, the travel time of component E at from the central engine (refer to Section 4.1.1). A value of would be required to give a spectral index of above the break frequency, consistent with our observations. Using the same magnetic field and extending the cooling time by years (i.e., the time difference between the two studies), we estimate a break frequency at the observing epoch of Middelberg et al. (2003) to be GHz, consistent with their detection of E at GHz and non-detection of E at GHz. We note that their spectrum appears to be shifted to lower frequencies because it peaks between and GHz rather than between and GHz as in our study. This shift is consistent with an adiabatic expansion of the rapidly cooling synchrotron source, for a source lifetime of years, , and the ratio of the turnover frequencies of (corresponding to a shift of roughly GHz; note that turnover frequency is different from ; Eq. 13.27 of Kellermann & Verschuur, 1988).
4 Discussion
In what follows, we propose that the inner parsec in NGC 3079 contains a nearly edge-on, massive, thick, and flared disk. The disk orbits a mass of enclosed within pc, most likely a supermassive black hole, and it is aligned with the kpc-scale molecular disk. The disk is most likely self-gravitating, clumpy, and forming stars. Accretion onto the black hole drives a jet that is misaligned with the disk rotation axis and is interacting with the dense ambient medium. The presence of off-axis aging synchrotron components may suggest that the jet changes orientation. The jet may coexist with a pc-scale wide-angle outflow, which is inferred from the observation of masers at high latitudes above the disk and which might be related to the known kpc-scale superbubble.
4.1 Analysis of Maser Kinematics
4.1.1 The Disk Major Axis and the Dynamical Center
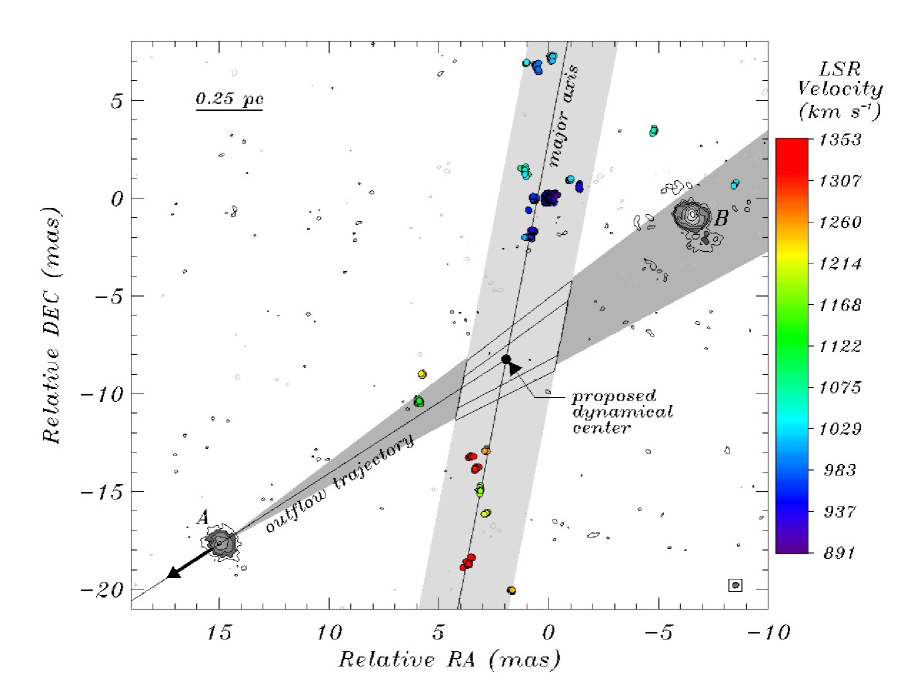
The largely north-south linear distribution of the maser emission, aligned with the kpc-scale molecular disk, as well as the segregation of the blue- and the red-shifted emission on the sky are suggestive of a nearly edge-on pc-scale molecular disk. A fit to the angular distribution of maser emission yields the following disk major axis: mas, where and are right ascension and declination, respectively, measured with respect to the reference maser feature (Fig. 11). The position angle of the proposed major axis is , in close agreement with the position angle of the kpc-scale molecular disk (P.A.; Koda et al., 2002).
We use the estimated disk major axis and the systematic motion of component A to establish the location for the dynamical center. The uncertainty in the location and orientation of the disk major axis restricts the position of the dynamical center to lie within the gray nearly vertical band in Fig.11. The systematic motion of component A (Fig.9), on the other hand, limits the location of the dynamical center to P.A. as measured with respect to A and illustrated as a cone in Fig.11. The intersection of these two loci yields for the mean position of the dynamical center (shown in Fig. 11). Note that the proposed position of the dynamical center lies in close proximity to the intersection of the disk major axis with the line joining components A and B, which was expected since the trajectory of A is nearly parallel to the line joining A and B. The position of the dynamical center proposed in this study is similar to that proposed in Trotter et al. (1998) but significantly different from that proposed by Sawada-Satoh et al. (2000) (Fig. 1).
4.1.2 Disk Structure
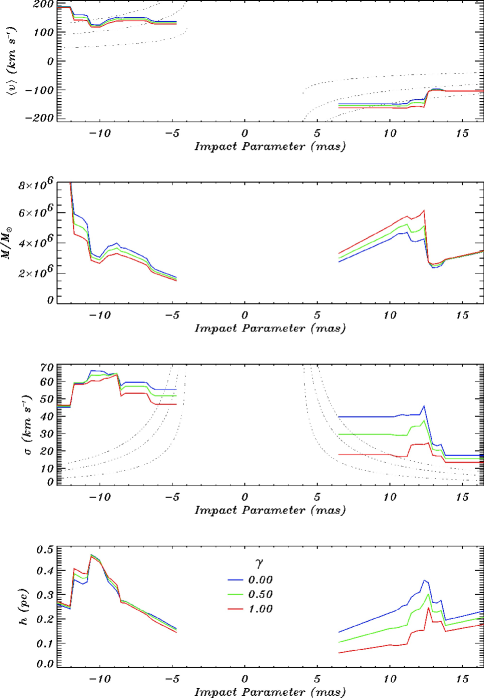
To study the disk structure traced by the maser emission, we computed the average velocity , the enclosed total mass , the velocity dispersion , and the disk scale height as a function of distance from the putative dynamical center along the major axis of the disk, i.e., the impact parameter (Fig. 12). In this computation and the following analysis, we explicitly assume that the maser emission traces the kinematics of the underlying molecular material, as is indeed the case in the archetypal maser galaxy NGC 4258. To compute the four average quantities at each impact parameter, we used an averaging aperture of radius mas ( pc) and weighting function , where is the maser flux density and . This particular weighting scheme was adopted to demonstrate that the general conclusions inferred from this analysis are relatively insensitive to the observed broad range of the maser flux density (Fig. 3). Moreover, at each impact parameter, the average velocity and velocity dispersion were computed in accordance with and , respectively, where the sums are over all maser features located within the averaging aperture. Assuming Keplerian rotation and spherical symmetry, we estimated the enclosed mass as , where is the impact parameter. Under the assumption of hydrostatic equilibrium and axisymmetric potential, the disk scale height is given by . Note that the two easternmost and two westernmost maser features have been omitted from this analysis because they do not appear to be associated with the disk (Fig. 11). Their inclusion would not change our conclusions significantly.
4.1.3 Rotation, the Enclosed Mass, and the Disk Mass
The computed average velocity displays a red-blue asymmetry about the adopted and estimated dynamical center and is thus consistent with rotation (Fig. 12). The Keplerian rotation law yields a mass of enclosed within pc (5 mas). Trotter et al. (1998) reported a similar enclosed mass, , from consideration of the blue-shifted emission only. In our case, however, both the blue- and the red-shifted emission provide independent and consistent estimates of enclosed mass. We note that since the maser features may lie somewhat away from the disk midline or the disk might be somewhat tilted from edge-on, the computed enclosed mass is a lower limit, but is probably correct to within factors of order unity. For a central mass of and an inner radius of pc, the maximum centripetal acceleration (i.e., velocity drift) and the maximum proper motion would be km s-1 yr-1 and as yr-1, respectively. The much larger apparent velocity drifts and motions (Fig. 5) are most likely due to variability of separate gas clumps and macroscopic random motions among clumps rather than global kinematics, which makes a measurement of velocity drifts and proper motions due to the gravitational potential of a central mass difficult if not impossible.
Since the rotation curve of both blue- and red-shifted features is flat, i.e., , the mass of the circumnuclear pc-scale disk is significant with respect to the central mass. In fact, the disk mass within pc, the distance from the dynamical center to the brightest maser feature, is roughly . The mass of the entire disk traced by the maser emission ( pc) might be as large as , but this is uncertain by a factor of a few. Interestingly, if we extrapolate to larger radii, we estimate a mass of enclosed within pc, which is in surprisingly good agreement with the dynamical mass inferred from CO observations (Koda et al., 2002).
4.1.4 Mean Mass Density, Eddington Ratio, and Mass Accretion Rate
The mean mass density corresponding to enclosed within pc is pc-3. The relatively high mean mass density for NGC 3079 is suggestive of a massive central black hole as opposed to a dense star cluster (e.g., Maoz, 1995a), which is consistent with the X-ray observations of the nucleus. The estimated enclosed mass of is in agreement with proposed correlations between bulge velocity dispersion and black hole mass (Gebhardt et al. 2000a, 2000b; Ferrarese & Merritt, 2000; Ferrarese et al., 2001). If we adopt (Gebhardt et al. 2000a, 2000b), then the velocity dispersion of the bulge, km s km s-1 (Shaw, Wilkinson, & Carter, 1993), is consistent with a black hole mass of , although the heavy dust obscuration might bias the measured dispersion.
To estimate the mass accretion rate as well as the accretion timescale, we first approximate the luminosity of the nucleus. Since the keV luminosity is probably of the AGN bolometric luminosity (e.g., Kuraszkiewicz et al. 2003, Elvis et al. 1994), we obtain an AGN bolometric luminosity of from the X-ray data analysis reported by Iyomoto et al. (2001). The Eddington luminosity of a object is and, assuming that all of the enclosed mass is concentrated in a supermassive black hole, the approximate luminosity of the central engine yields an Eddington ratio of , which is consistent with the range obtained for Seyfert 1 galaxies, representative supermassive black hole systems (e.g., Padovani, 1989; Wandel, 1999). Assuming a standard accretion efficiency of (Frank, King, & Raine 2002; see also Marconi et al. 2004), we obtain a mass accretion rate of year-1, where is the AGN bolometric luminosity in units of . The disk mass computed above yields an average accretion timescale of years at a radius of pc (Table 4).
| Quantity | Estimate |
|---|---|
| Central mass ( pc) | |
| Mean mass density | pc-3 |
| Disk mass () | |
| Disk mass () | |
| Disk scale height | pc |
| AGN bolometric luminosity | |
| Eddington ratio | |
| Accretion ratebb is the AGN bolometric luminosity in units of . | year-1 |
| Accretion timescalea,ba,bfootnotemark: | years |
| Toomre Q-parameter | |
| Clump sizeaaComputed at the location of the brightest maser feature, pc. | pc |
| Clump massaaComputed at the location of the brightest maser feature, pc. | |
| Jeans mass | |
| Rotation periodaaComputed at the location of the brightest maser feature, pc. | years |
| Clump cooling timescaleaaComputed at the location of the brightest maser feature, pc. | years |
| Clump free-fall timescale | years |
| Clump collision timescale | years |
| Roche limitaaComputed at the location of the brightest maser feature, pc. | cm-3 |
4.1.5 Disordered, Thick, and Flared Disk
The disk in NGC 3079 is different from the archetypal Keplerian disk in NGC 4258 in that the velocity structure of the former is much more disordered. The rotation traced by the maser emission in NGC 3079 is characterized by relatively large velocity differences across relatively small areas on the sky. For instance, the velocity dispersion () as computed using an averaging radius of mas ( pc) ranges from to km s-1 (Fig. 12). The maximum velocity difference between neighboring maser features is km s-1 across a region as small as pc. The large velocity dispersion is most likely indicative of macroscopic random motions among the molecular clumps responsible for the maser emission rather than turbulence within the clumps (Section 4.2). As already noted above, the variability in the angular distribution and in the spectrum of the maser (Figs. 3, 5) is a direct consequence of these macroscopic random motions. Although a significant fraction of the orbital velocity, the computed velocity dispersion is everywhere much smaller than the escape velocity of a central object ( km s-1 in the region supporting maser emission) and thus has little impact on the stability of the underlying rotating structure. Although we favor the macroscopic random motions of clumps as the origin of the observed high dispersion, we note the small size of the dominant maser feature ( cm) for which km s-1, and we speculate that there may be some regions in which turbulence is significant but does not interfere with maser action (e.g., Wallin, Watson, & Wyld, 1998).
The computed velocity dispersion can be used to infer the disk thickness. Because is a considerable fraction of the orbital velocity, the rotating structure is most likely geometrically thick (e.g., Alves & Nelson, 2000; Wainscoat, Freeman, & Hyland, 1989). Moreover, since does not decrease with the impact parameter, the disk scale height ought to increase with the distance from the center; i.e., the disk is probably flared. In particular, the scale height, computed using appropriate in the case of hydrostatic equilibrium, is on the order of pc at an impact parameter of pc and might be as large as pc at a radius of pc (Fig. 12). The computed scale height is in reasonable agreement with the apparent thickness of the disk inferred from the dispersion of the maser spots about the disk major axis, pc at pc (see Fig. 11).
4.2 Clumpy Star-Forming Disk
The Toomre- parameter characterizes the stability of the accretion disk, and we can estimate it based on our measurements and an assumption about the temperature of the maser medium. The parameter is given by , where is the angular rotation rate, is the surface density, and is the sound speed. If we assume that the mass distribution in the accretion disk has circular symmetry, then and we can write . Using and the fact that the orbital velocity of km s-1 is approximately constant with radius (Fig. 12), we estimate a radius independent value of roughly g cm-2. The sound speed in a neutral medium is given by km s-1 (e.g., Maoz & McKee, 1998), and most models of maser emission from water vapor require the gas temperature to lie in the range K (e.g., Desch et al., 1998). With these parameters we obtain , where the range reflects only the uncertainty in temperature. Except for possible temperature variation, our estimate of is independent of radius since both the orbital velocity and are to first order constant with radius. Since is significantly less than unity, the disk appears to be gravitationally unstable in the region supporting the maser emission. The flat rotation curve, which implies significant accretion disk mass with respect to the black hole mass, is fundamentally responsible for the low value of . The value of we estimate is rather robust if our fundamental assumption that the velocities of the masers are due to the gravity of the enclosed mass holds true.
From our estimate of , we parameterize the disk surface density as g cm-2, i.e., about and g cm-2 at the inner and outer radii of and pc, respectively. (The empirically derived power law index of is not unreasonable; for instance, for a radiatively cooled, gas pressure-dominated -disk with a constant rate of accretion throughout the disk.) Using the scale height in Fig. 12, our estimate for disk surface density, and , we compute mean density that varies from about to cm-3 over the observed disk. The densities deduced here lie comfortably within the normally required range of H2 number densities of cm-3 for maser emission (e.g., Desch et al., 1998). Our determination here of the average density of a maser medium is probably the first accurate determination of this quality for water in general.
The ultimate fate of an accretion disk characterized by depends on the balance between cooling and heating. It has been argued that the disk will maintain by rearrangement of surface density to reduce or by heating through turbulence (Lin & Pringle, 1987; Huré, 2000; Gammie, 2001). However, the energy required to maintain is prohibitive (Goodman, 2003) and, in the case of NGC 3079, would require temperatures as high as K. Furthermore, cooling timescales might be sufficiently short that a criterion is unsupportable (Shlosman & Begelman, 1989; Monaghan & Lattanzio, 1991), in which case the disk would fragment into clumps (e.g., Gammie, 2001; Kumar, 1999).
We consider the clumpy disk model in detail by computing clump size and mass at a representative location within the disk, the distance from the dynamical center to the brightest maser feature, pc. The gas number density required for gravitational collapse in a strong tidal field is given by the Roche limit, cm-3, which is consistent with the H2 number density required by the presence of the maser emission. Furthermore, as derived by Vollmer, Beckert, & Duschl (2004), an upper limit on the radius of a self-gravitating clump subject to tidal shear is , from which we obtain pc and an upper limit on the clump mass of . It is instructive to compare this upper limit to the Jeans mass, , which is given the conditions necessary to support maser emission. Since the Jeans mass and the Roche limit are consistent with the upper limit on cloud mass and with H2 number density inferred from the presence of the maser emission, respectively, fragmentation and star formation are expected to occur within the clumps.
In addition to the Jeans mass analysis, straightforward considerations of energetics also suggest that individual clumps are susceptible to collapse. The time in which a clump will radiate its binding energy via black-body emission is given by where , , , and are the clump’s mass, radius, effective temperature, and average H2 number density, respectively (e.g., Goodman, 2003). In our case, , K, and cm-3, which yields years. However, if line emission is the dominant cooling mechanism, then the timescale becomes , where is the total cooling rate per H2 molecule in ergs s-1. Using the cooling rates in Neufeld et al. (1995) and pc, the expression above is maximized for cm-3 and K, which results in years. If cooling of the gas by cold dust grains dominates, then, using pc, dust temperature of K (Collison & Watson, 1995), and the cooling rate per unit volume of Hollenbach & McKee (1989), we obtain a cooling timescale of at most years. Thus, the time in which a clump will radiate all of its binding energy via either black-body radiation, line emission, or heating of cold dust is much less than the accretion timescale and even the disk rotation period (Table 4); consequently, clumps collapse on their free-fall timescale, resulting in star formation. In our case, the free-fall timescale is years, depends only on the hydrogen number density implied by the conditions necessary for maser amplification, and is four orders of magnitude smaller than the computed accretion timescale.
Star formation can also be triggered by collisions among clumps. W49N, the most luminous water maser in our Galaxy, provides probably the best example of how clump-clump interaction can induce O-type star formation (Serabyn, Güsten, & Schulz, 1993). To estimate the collision timescale, we must obtain the mean clump separation. Using the scale height in Fig. 12, we estimate the volume of the entire disk as traced by the maser emission to be roughly pc3. Mass of the entire maser disk of and a upper limit on clump mass yield clumps in the disk and mean clump separation of pc. Hence, the collision timescale, (Kumar, 1999), is years and in fact depends only on disk size, disk mass, and H2 number density inferred from the presence of the maser emission. Since the collision timescale is much less than the accretion timescale, collisions among clumps might also be a significant process in triggering star formation and overall evolution of the disk.
In summary, since , the pc-scale circumnuclear disk in NGC 3079 is most likely gravitationally unstable and therefore clumpy. Evidence for a self-gravitating disk of mass comparable to the central mass has also been found in NGC 1068 (; Lodato & Bertin, 2003), although NGC 3079 provides a more extreme example of the phenomenon ( vs. ). Furthermore, the Jeans mass, the Roche limit, as well as cooling and collision timescales are suggestive of star formation within the clumps through either clump collapse or clump collisions. Once a clump collapses, star formation proceeds via accretion of gas from the pc-scale accretion disk onto the Hill sphere of the stellar object, as considered in detail by Milosavljević & Loeb (2004). The star formation efficiency of giant molecular clouds () and dark molecular cores () ranges from % to % while the star formation timescale and the lifetime of hot massive stars are on the order of years (e.g., Blitz & Thaddeus, 1980; Larson, 1982; Wilking & Lada, 1983; Myers, 1985; Silk, 1985, 1987). Thus, the long accretion timescale and the large potential clump mass computed above are consistent with the relatively slow and inefficient process of star formation (Table 4). If the star formation were to exhaust the available gas (which, in addition to the star formation rate, also depends on the presence of any gas feeding mechanisms), then the massive accretion disk in NGC 3079 would transform into a stellar disk, a transition that has been proposed to explain the presence of young stars in the immediate vicinity of the black hole in the Galactic center (Levin & Beloborodov, 2003; Milosavljević & Loeb, 2004; Nayakshin & Cuadra, 2004).
4.3 Pumping of Maser Emission by the Central Engine
Since the nucleus of NGC 3079 contains a compact hard X-ray source, irradiation of molecular gas is a plausible means of exciting maser emission (e.g., Neufeld, Maloney, & Conger, 1994). In maser sources such as NGC 4258 and Circinus, irradiation over a wide range of radii is achievable because the disks are warped (Herrnstein, Greenhill, & Moran 1996; Greenhill et al. 2003). In NGC 3079, the disk in which the masers lie does not appear to be warped, in which case maser excitation over the observed range of radii ( pc) depends on penetration of X-rays in the disk plane. However, because maser action requires high densities, the disk must be inhomogeneous, which is consistent with our earlier stability arguments. For a minimum H2 density of cm-3, a column within the disk becomes Compton thick for lengths greater than pc. However, for a line-of-sight filling factor of , the column could pass X-rays to a radius of pc.
For an irradiated slab of gas, Collison & Watson (1995) estimate a maser emission rate of per pc2 of surface area beamed in the plane of the slab. For a model spherical gas clump of radius pc that is irradiated on one side, the integrated output is on the order of , which is much less than the isotropic luminosity inferred from the strength of individual maser features (e.g., ; Fig.3). We suggest instead that the emission from the observed masers is narrowly beamed along our line of sight by the overlap of clumps with similar Doppler velocities, whereby the integrated output of each is directed toward us (e.g., Deguchi & Watson, 1989; Kartje et al., 1999). To support the peak observed isotropic luminosity, we require two clumps, each pc in size, separated by on the order of pc, which is reasonable in light of the pc radius of the disk. We note that amplification of background continuum emission by individual clumps can also generate strongly forward beamed maser emission, but we do not detect continuum emission in the vicinity of the disk above mJy () at GHz. On the other hand, the two easternmost and westernmost maser features do lie in close vicinity to continuum components B and C, and we speculate that maser emission observed away from the disk, where the density of clumps is probably greatly reduced, may be the result of continuum amplification.
Under the assumption that clumps are optically thick, irradiation of individual clumps by a central source creates a dissociation region on the inward facing side, which results in anisotropic emission of microwave photons preferentially along the length of the dissociation region. This pattern may be used to explain why we observe maser emission in the vicinity of the disk midline but not close to the line of sight to the central engine. Clumps on the front and back sides of the disk beam maser photons along axes that are substantially inclined to our line of sight. Furthermore, we speculate that the observed variability of maser spectrum (Nakai et al., 1995; Baan & Haschick, 1996; Hagiwara et al., 2002) and the observed variation in angular structure (Fig. 5) may be the result of pairs of clumps moving in and out of alignment along the line of sight. The presence of the maser feature at km s-1 in the spectrum of NGC 3079 since the discovery of the maser (Henkel et al., 1984; Haschick & Baan, 1985; Baan & Haschick, 1996) and the km s-1 dispersion due to bulk random motion (Fig.12) place a lower limit on the clump size of pc, consistent with the upper limit (Table 4). Year-to-year variation in the flux density of some maser features might be due to incomplete overlaps on the sky of the X-ray dissociation regions.
4.4 Outflow
4.4.1 Components E and F
Component E, identified by Kondratko et al. (2000), and component F, identified by Middelberg et al. (2003), might be remnants of jet emission along former axes of a wobbling jet, currently traced by components A, B, and C. The apparent decrease in the break frequency of components E and F with distance from the central engine (Middelberg et al., 2003) and the shift of the spectrum of component E toward lower frequencies with time (Section 3.2) are indirectly supportive of the hypothesis that both components are rapidly cooling and adiabatically expanding remnants of jet emission. Although the structure of the continuum is difficult to understand in detail, we speculate that components A and B are regions where the jet, in its current orientation, interacts with a dense ambient medium, an inference supported by their GPS-like spectra (Section 3.2).
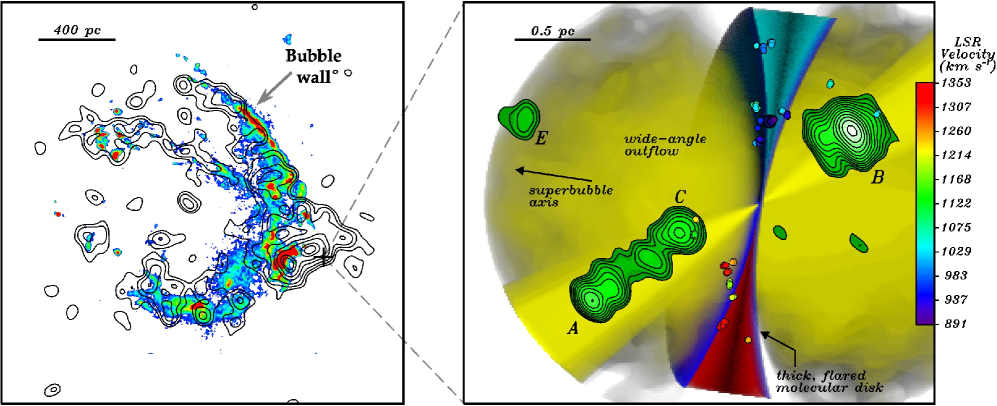
Alternatively, considering the location of E (Fig. 13) and of F (Middelberg et al., 2003) within the opening angle of the kpc-scale superbubble, these two components might provide evidence for a pc-scale wide-angle outflow, most likely an inward extension of the kpc-scale superbubble. In this interpretation, the two VLBI components could be moving knots or shocks as the ionized wide-angle wind interacts with the dense ambient medium along the edges of the flow as seen in projection. If this hypothesis is true, then new continuum components are expected to appear on both sides of the central engine but within the opening angle of the superbubble. However, it is currently not possible to distinguish between the two models proposed above, and more sensitive images and proper motion studies of the continuum components extending over a longer time frame are necessary. Given the possible source lifetimes and transverse speeds (Section 3.2), time baselines on the order of a decade are necessary.
On the other hand, it is unlikely that E and F are radio supernovae associated with the nuclear starburst. The spectral index of E, between 8 and 15 GHz (Fig. 10), is much steeper than what has been observed in radio supernovae (; Weiler et al. 1986; Weiler, Panagia, & Sramek 1990; Allen & Kronberg 1998; McDonald et al. 2001, 2002; Bartel et al. 2002) . The extremely steep spectrum of F, between 1.7 and 2.3 GHz, is also not compatible with a radio supernova. Furthermore, the radio supernovae in the prominent starburst galaxy M82 scaled to the distance of NGC 3079 would have flux densities ( mJy) below our detection limits at 5 and 15 GHz (McDonald et al., 2002).
4.4.2 Wide-Angle Outflow on Parsec Scales
The existence of a wide-angle outflow in NGC 3079 was hypothesized in previous studies of the nucleus. Based on VLA data, Duric & Seaquist (1988) first suggested that a wide-angle wind is responsible for a bipolar “figure eight” structure along the minor axis of the galaxy in radio continuum. A wide-angle outflow on pc-scales has been suggested to explain a blue-shifted OH absorption component and two weak OH emission features detected from the nucleus (Baan & Irwin, 1995; Hagiwara et al., 2004). By considering the energetics and morphology of the kpc-scale superbubble observed in H with the Hubble Space Telescope (HST), Cecil et al. (2001) argued that the bubble is inflated by a wide-angle outflow rather than a precessing jet. Wide-angle outflows seem to be quite common among Seyfert galaxies (Colbert et al., 1996a, b, 1998), and one has been imaged on pc-scales in the Circinus galaxy, the nearest Seyfert 2 nucleus (Greenhill et al. 2003). Guided by this result, by the presence of molecular gas as dense as the disk gas at high latitudes above the disk (i.e., the two easternmost and two westernmost maser features in Fig. 11), and by the existence of a kpc-scale superwind, we suggest a wide-angle outflow on pc-scales in NGC 3079.
It has been suggested that winds are driven by photoionized evaporation of matter from an inner surface of a torus (Krolik & Kriss, 2001), by radiation and gas pressure acting on an accretion disk (Murray et al., 1995), or by the magneto-centrifugal uplift of gas and dust from an accretion disk (Emmering, Blandford, & Shlosman, 1992; Königl & Kartje, 1994, Kartje et al. 1999). In addition, ram pressure of a wide-angle outflow can entrain clumps at the surface of an accretion disk. If the wind is sufficiently dense to effectively shield the clumps from the central engine and the clumps can be confined, then they can potentially rise to high latitudes above the rotating structure (see Fig. 7 in Kartje et al., 1999) while still maintaining, to some degree, the rotational velocity imprinted by the parent disk. In light of this, the fact that the line-of-sight velocities of the two easternmost and the two westernmost features (Fig. 11) reflect the velocity of the most proximate side of the disk can be explained if these clumps were uplifted from the disk surface and carried to high latitudes by a dense wide-angle outflow. We thus consider the four maser features located significantly out of the plane of the disk as indirect evidence for a pc-scale wide-angle outflow, likely an inward extension of the kpc-scale superbubble. The fact that some clouds attain large latitudes above the disk surface while others remain within or in a close proximity to the thick disk might be due to a mixture of heavy and light clumps within the disk. We note that, due to beaming effects of maser emission, the actual number of the clumps uplifted might be much greater than the four clumps that are observed to be associated with the wind.
Although the origin of the putative pc-scale wide-angle outflow is unclear, we suggest that it is unlikely to be driven by star formation in the pc-scale accretion disk. The mechanical luminosity required to blow out a superbubble from the galactic disk in NGC 3079 is ergs s-1 (Veilleux et al., 1994). Following Strickland et al. (2004a), such a luminosity would require supernovae corresponding to a cluster of mass , assuming a thermalization efficiency of , an energy release of ergs per supernova, and a starburst lifetime equal to the dynamical age of the superbubble, years (Veilleux et al., 1994). The predicted cluster mass is an order of magnitude greater than the mass of one of the most massive star clusters known, R136 in 30 Doradus, with a half-mass radius of pc (Campbell et al. 1992; Brandl et al. 1996; Massey & Hunter, 1998). Such massive clusters are thus extremely rare, constituting only a fraction of of all star clusters (Strickland et al., 2004a). More reasonable values of the starburst lifetime ( Myr) would require an even more extreme cluster mass and number of supernovae, effectively excluding a pc-scale cluster as a progenitor of the kpc-scale superbubble. Supernovae localized in multiple starburst regions and distributed over larger scales (e.g., kpc) might still contribute significantly to the wide-angle outflow, although the degree of this contribution is uncertain (Strickland et al., 2004b, a).
One consequence of the broad outflow that we hypothesize — or the canted jet marked by continuum components A, B, and C — may be the uniform weakness of maser emission south of the dynamical center. Since AGN outflows are ionized, differential attenuation of the maser emission is readily achieved for free-free absorption with a small difference in electron density and corresponding emission measure. If the disk is tilted slightly from edge-on such that the lines of sight to the maser emission traverse outside of the disk (Fig.13), the observed two order of magnitude flux density difference between blue- and red-shifted features may be explained by a factor of at most difference in local electron number density (provided that in the direction of the blue-shifted maser emission). In the case of a canted jet, an enhancement in density may be readily achieved given that the jet is inclined toward the apparently weaker masers (see also Trotter et al., 1998), but a density inhomogeneity in the wide-angle outflow might also be the cause of the differential attenuation. However, in either case, it is interesting to note that the balance of blue- and red-shifted emission can be readily governed by factors extrinsic to the maser emitting regions in the case of both NGC 3079 and NGC 4258 (Herrnstein et al., 1996). This may be generalizable to other maser sources and contrasts with the models of Maoz (1995b) and Maoz & McKee (1998).
5 Summary
Water maser emission in the active nucleus of NGC 3079 has recently been recognized to cover a km s-1 range centered on the systemic velocity of the galaxy. We have mapped for the first time maser emission over this entire velocity interval. We have also imaged non-thermal continuum emission between 5 and 22 GHz that arises in close proximity to the molecular gas underlying the masers. Based on the analysis of the spectral-line and continuum maps, we conclude the following:
-
1.
The largely north-south distribution of maser emission, aligned with a known kpc-scale molecular disk, and the segregation of blue- and red-shifted maser emission on the sky strongly support the model of Trotter et al. (1998) in which the masers trace a nearly edge-on molecular disk about pc in radius.
-
2.
The dynamical mass enclosed within a pc radius is , and for a to km s-1 stellar bulge velocity dispersion is consistent with correlations between central mass and dispersion reported for broad samples of galaxies (Gebhardt et al. 2000a, 2000b; Ferrarese & Merritt, 2000; Ferrarese et al., 2001). The ratio of bolometric to Eddington luminosity is , consistent with accretion efficiencies of for Seyfert 1 systems.
-
3.
The disk rotation curve is relatively flat, which is consistent with a mass of between radii of and pc.
-
4.
The angular distribution of maser emission is not as well ordered in NGC 3079 as in other “maser galaxies” (e.g., NGC4258). The velocities of adjacent clumps of maser emission can differ by tens of km s-1 on scales of pc. As a result, we suggest that the disk is relatively thick ( to ) and may be flared.
-
5.
Based on stability, cooling, and timescale arguments, we argue that the disk is self-gravitating, clumpy, and appears to meet the necessary conditions for star-formation. The maser emission most likely occurs as a result of clumps irradiated by X-rays from the central engine and overlapping on the sky, yielding long gain paths and narrow beam angles.
-
6.
We report detection of a very steep spectrum synchrotron component (E) that is not collinear with the previously claimed compact jet. The spectrum is consistent with an aging electron energy distribution. The observation of a “relic” favors the hypothesis that the jet in NGC 3079 has changed direction. In addition to the jet, we observe molecular gas that is dense enough to support maser emission at high latitudes above the disk. From this, we infer that the jet coexists with a wide-angle outflow originating at parsec or smaller scales.
The proposed model can be tested through further VLBI study of the NGC 3079 AGN. More sensitive images and proper motion studies of the continuum components, with a longer time baseline, may help to determine the nature of components E and F. If they are shocks in a wide-angle outflow rather than remnants of jet emission, then new continuum components are expected to appear within the arc subtended by the superbubble. The presence of star-formation in the inner parsec can be confirmed with an ultrasensitive search for M82-like radio supernova remnants. A proper motion and monitoring study of the maser emission would be challenging (i.e., motions as yr-1) but could be used to corroborate the proposed geometry for the inner parsec, although it might be difficult to disentangle motions due to kinematics from apparent motions due to local effects, such as clump alignments. Hosting a central engine, a jet, a thick and self-gravitating accretion disk, and possibly a wide-angle outflow and star-formation, the nucleus of NGC 3079 constitutes a nearby laboratory for diverse astrophysical phenomena and is a strong candidate for the study of the starburst-AGN connection and of the complex interactions between gas, stars, and supermassive black holes.
We would like to thank Gerald Cecil for providing HST images in digital form and Craig Heinke for help in processing the Chandra image. We thank the anonymous referee for useful comments.
References
- Allen & Kronberg (1998) Allen, M. L., & Kronberg, P. P. 1998, ApJ, 502, 218
- Alves & Nelson (2000) Alves, D. R., & Nelson, C. A. 2000, ApJ, 542, 789
- Antonucci (1993) Antonucci, R. 1993, ARA&A, 31, 473
- Aurass et al. (2002) Aurass, H., Vršnak, B., & Mann, G. 2002, A&A, 384, 273
- Baan & Haschick (1996) Baan, W. A., & Haschick, A. 1996, ApJ, 473, 269
- Baan & Irwin (1995) Baan, W. A., & Irwin, J. A. 1995, ApJ, 446, 602
- Bartel, N., et al. (2002) Bartel, N., et al. 2002, ApJ, 581, 404
- Baudry et al. (1994) Baudry, A., Brouillet, N., & Henkel, C. 1994, A&A, 287, 20
- Bicknell et al. (1997) Bicknell, G. V., Dopita, M. A., & O’Dea, C. P. O. 1997, ApJ, 485, 112
- Blitz & Thaddeus (1980) Blitz, L., & Thaddeus, P. 1980, ApJ, 241, 676
- Braatz et al. (1997) Braatz, J. A., Wilson, A. S., & Henkel, C. 1997, ApJS, 110, 321
- Braine et al. (1997) Braine, J., Guelin, M., Dumke, M., Brouillet, N., Herpin, F., & Wielebinski, R. 1997, A&A, 326, 963
- Brandl, B., et al. (1996) Brandl, B., et al. 1996, ApJ, 466, 254
- Campbell, B., et al. (1992) Campbell, B., et al. 1992, AJ, 104, 1721
- Cecil et al. (2002) Cecil, G., Bland-Hawthorn, J., & Veilleux, S. 2002, ApJ, 576, 745
- Cecil et al. (2001) Cecil, G., Bland-Hawthorn, J., Veilleux, S., & Filippenko, A. V. 2001, ApJ, 555, 338
- Cid Fernandes et al. (2001) Cid Fernandes, R., Heckman, T., Schmitt, H., Delgado, R. M. G., & Storchi-Bergmann, T. 2001, ApJ, 558, 81
- Colbert et al. (1996a) Colbert, E. J. M., Baum, S. A., Gallimore, J. F., O’Dea, C. P., & Christensen, J. A. 1996a, ApJ, 467, 551
- Colbert et al. (1996b) Colbert, E. J. M., Baum, S. A., Gallimore, J. F., O’Dea, C. P., Lehnert, M. D., Tsvetanov, Z. I., Mulchaey, J. S., & Caganoff, S. 1996b, ApJS, 105, 75
- Colbert et al. (1998) Colbert, E. J. M., Baum, S. A., O’Dea, C. P., & Veilleux, S. 1998, ApJ, 496, 786
- Collison & Watson (1995) Collison, A. J., & Watson, W. D. 1995, ApJ, 452, L103
- Deguchi & Watson (1989) Deguchi, S., & Watson, W. D. 1989, ApJ, 340, L17
- Desch et al. (1998) Desch, S. J., Wallin, B. K., & Watson, W. D. 1998, ApJ, 496, 775
- Devereux (1987) Devereux, N. 1987, ApJ, 323, 91
- Duric & Seaquist (1988) Duric, N., & Seaquist, E. R. 1988, ApJ, 326, 574
- Elvis, M., et al. (1994) Elvis, M., et al. 1994, ApJS, 95, 1
- Emmering et al. (1992) Emmering, R. T., Blandford, R. D., & Shlosman, I. 1992, ApJ, 385, 460
- Ferrarese & Merritt (2000) Ferrarese, L., & Merritt, D. 2000, ApJ, 539, L9
- Ferrarese et al. (2001) Ferrarese, L., Pogge, R. W., Peterson, B. M., Merritt, D., Wandel, A., & Joseph, C. L. 2001, ApJ, 555, L79
- Ford et al. (1986) Ford, H. C., Dahari, O., Jacoby, G. H., Crane, P. C., & Ciardullo, R. 1986, ApJ, 311, L7
- Frank et al. (2002) Frank, J., King, A., & Raine, D. J. 2002, Accretion Power in Astrophysics: Third Edition (Accretion Power in Astrophysics: Third Edition, by Juhan Frank, Andrew King, and Derek J. Raine. Cambridge University Press, 2002, 398 pp.)
- Gammie (2001) Gammie, C. F. 2001, ApJ, 553, 174
- Gebhardt, K., et al. (2000a) Gebhardt, K., et al. 2000a, ApJ, 539, L13
- Gebhardt, K., et al. (2000b) —. 2000b, ApJ, 543, L5
- Genzel et al. (1996) Genzel, R., Thatte, N., Krabbe, A., Kroker, H., & Tacconi-Garman, L. E. 1996, ApJ, 472, 153
- Genzel, R., et al. (2003) Genzel, R., et al. 2003, ApJ, 594, 812
- Goodman (2003) Goodman, J. 2003, MNRAS, 339, 937
- Greenhill et al. (2003) Greenhill, L. J., Kondratko, P. T., Lovell, J. E. J., Kuiper, T. B. H., Moran, J. M., Jauncey, D. L., & Baines, G. P. 2003, ApJ, 582, L11
- Greenhill, L. J., et al. (2003) Greenhill, L. J., et al. 2003, ApJ, 590, 162
- Gwinn (1994) Gwinn, C. R. 1994, ApJ, 429, 253
- Hagiwara et al. (2002) Hagiwara, Y., Henkel, C., Sherwood, W. A., & Baan, W. A. 2002, A&A, 387, L29
- Hagiwara et al. (2004) Hagiwara, Y., Kloeckner, H. R., & Baan, W. 2004, astro-ph/0404347
- Haschick & Baan (1985) Haschick, A. D., & Baan, W. A. 1985, Nature, 314, 144
- Hawarden et al. (1995) Hawarden, T. G., Israel, F. P., Geballe, T. R., & Wade, R. 1995, MNRAS, 276, 1197
- Hawarden et al. (1986) Hawarden, T. G., Mountain, C. M., Leggett, S. K., & Puxley, P. J. 1986, MNRAS, 221, 41P
- Heckman (1980) Heckman, T. M. 1980, A&A, 87, 152
- Henkel et al. (1984) Henkel, C., Güsten, R., Downes, D., Thum, C., Wilson, T. L., & Biermann, P. 1984, A&A, 141, L1
- Herrnstein et al. (1996) Herrnstein, J. R., Greenhill, L. J., & Moran, J. M. 1996, ApJ, 468, L17
- Herrnstein et al. (1997) Herrnstein, J. R., Moran, J. M., Greenhill, L. J., Diamond, P. J., Miyoshi, M., Nakai, N., & Inoue, M. 1997, ApJ, 475, L17
- Ho et al. (1997) Ho, L. C., Filippenko, A. V., & Sargent, W. L. W. 1997, ApJS, 112, 315
- Ho et al. (1987) Ho, P. T. P., Martin, R. N., Henkel, C., & Turner, J. L. 1987, ApJ, 320, 663
- Hollenbach & McKee (1989) Hollenbach, D., & McKee, C. F. 1989, ApJ, 342, 306
- Huré (2000) Huré, J.-M. 2000, A&A, 358, 378
- Irwin & Saikia (2003) Irwin, J. A., & Saikia, D. J. 2003, MNRAS, 346, 977
- Irwin & Seaquist (1988) Irwin, J. A., & Seaquist, E. R. 1988, ApJ, 335, 658
- Israel et al. (1998) Israel, F. P., van der Werf, P. P., Hawarden, T. G., & Aspin, C. 1998, A&A, 336, 433
- Iyomoto et al. (2001) Iyomoto, N., Fukazawa, Y., Nakai, N., & Ishihara, Y. 2001, ApJ, 561, L69
- Jogee (2001) Jogee, S. 2001, in Galaxies and Their Constituents at the Highest Angular Resolutions, ed. R. T. Schilizzi, S. N. Vogel, F. Paresce, & M. S. Elvis, 228
- Kardashev (1962) Kardashev, N. S. 1962, Soviet Astronomy, 6, 317
- Kartje et al. (1999) Kartje, J. F., Königl, A., & Elitzur, M. 1999, ApJ, 513, 180
- Kellermann & Verschuur (1988) Kellermann, K. I., & Verschuur, G. L., eds. 1988, Galactic and extragalactic radio astronomy (2nd edition)
- Kellermann, K. I., et al. (2004) Kellermann, K. I., et al. 2004, ApJ, 609, 539
- Klaas & Walker (2002) Klaas, U., & Walker, H. J. 2002, A&A, 391, 911
- Koda et al. (2002) Koda, J., Sofue, Y., Kohno, K., Nakanishi, H., Onodera, S., Okumura, S. K., & Irwin, J. A. 2002, ApJ, 573, 105
- Kohno et al. (2001) Kohno, K., Matsushita, S., Vila-Vilaró, B., Okumura, S. K., Shibatsuka, T., Okiura, M., Ishizuki, S., & Kawabe, R. 2001, in ASP Conf. Ser. 249: The Central Kiloparsec of Starbursts and AGN: The La Palma Connection, 672
- Kondratko et al. (2000) Kondratko, P. K., Greenhill, L. J., & Moran, J. M. 2000, Bulletin of the American Astronomical Society, 32, 1586
- Königl & Kartje (1994) Königl, A., & Kartje, J. F. 1994, ApJ, 434, 446
- Krolik & Kriss (2001) Krolik, J. H., & Kriss, G. A. 2001, ApJ, 561, 684
- Kumar (1999) Kumar, P. 1999, ApJ, 519, 599
- Kuraszkiewicz, J. K., et al. (2003) Kuraszkiewicz, J. K., et al. 2003, ApJ, 590, 128
- Larson (1982) Larson, R. B. 1982, MNRAS, 200, 159
- Lawrence & Elvis (1982) Lawrence, A., & Elvis, M. 1982, ApJ, 256, 410
- Lawrence et al. (1985) Lawrence, A., Ward, M., Elvis, M., Fabbiano, G., Willner, S. P., Carleton, N. P., & Longmore, A. 1985, ApJ, 291, 117
- Levin & Beloborodov (2003) Levin, Y., & Beloborodov, A. M. 2003, ApJ, 590, L33
- Lin & Pringle (1987) Lin, D. N. C., & Pringle, J. E. 1987, MNRAS, 225, 607
- Lodato & Bertin (2003) Lodato, G., & Bertin, G. 2003, A&A, 398, 517
- Maiolino et al. (1998) Maiolino, R., Krabbe, A., Thatte, N., & Genzel, R. 1998, ApJ, 493, 650
- Maoz (1995a) Maoz, E. 1995a, ApJ, 447, L91
- Maoz (1995b) —. 1995b, ApJ, 455, L131
- Maoz & McKee (1998) Maoz, E., & McKee, C. F. 1998, ApJ, 494, 218
- Marconi et al. (2004) Marconi, A., Risaliti, G., Gilli, R., Hunt, L. K., Maiolino, R., & Salvati, M. 2004, MNRAS, 351, 169
- Mas-Hesse et al. (1994) Mas-Hesse, J. M., Rodriguez-Pascual, P. M., de Cordoba, L. S. F., & Mirabel, I. F. 1994, ApJS, 92, 599
- Mas-Hesse et al. (1995) Mas-Hesse, J. M., Rodriguez-Pascual, P. M., Sanz Fernandez de Cordoba, L., Mirabel, I. F., Wamsteker, W., Makino, F., & Otani, C. 1995, A&A, 298, 22
- Massey & Hunter (1998) Massey, P., & Hunter, D. A. 1998, ApJ, 493, 180
- McDonald et al. (2001) McDonald, A. R., Muxlow, T. W. B., Pedlar, A., Garrett, M. A., Wills, K. A., Garrington, S. T., Diamond, P. J., & Wilkinson, P. N. 2001, MNRAS, 322, 100
- McDonald et al. (2002) McDonald, A. R., Muxlow, T. W. B., Wills, K. A., Pedlar, A., & Beswick, R. J. 2002, MNRAS, 334, 912
- Middelberg et al. (2003) Middelberg, E., Krichbaum, T. P., Roy, A. L., Witzel, A., & Zensus, J. A. 2003, astro-ph/0309382
- Milosavljević & Loeb (2004) Milosavljević, M., & Loeb, A. 2004, ApJ, 604, L45
- Monaghan & Lattanzio (1991) Monaghan, J. J., & Lattanzio, J. C. 1991, ApJ, 375, 177
- Murray et al. (1995) Murray, N., Chiang, J., Grossman, S. A., & Voit, G. M. 1995, ApJ, 451, 498
- Myers (1985) Myers, P. C. 1985, in Protostars and Planets II, 81–103
- Nakai et al. (1995) Nakai, N., Inoue, M., Miyazawa, K., Miyoski, M., & Hall, P. 1995, PASJ, 47, 771
- Nayakshin & Cuadra (2004) Nayakshin, S., & Cuadra, J. 2004, astro-ph/0409541
- Neufeld et al. (1995) Neufeld, D. A., Lepp, S., & Melnick, G. J. 1995, ApJS, 100, 132
- Neufeld et al. (1994) Neufeld, D. A., Maloney, P. R., & Conger, S. 1994, ApJ, 436, L127
- O’Dea et al. (1991) O’Dea, C. P., Baum, S. A., & Stanghellini, C. 1991, ApJ, 380, 66
- Padovani (1989) Padovani, P. 1989, A&A, 209, 27
- Phillips & Mutel (1982) Phillips, R. B., & Mutel, R. L. 1982, A&A, 106, 21
- Planesas et al. (1997) Planesas, P., Colina, L., & Perez-Olea, D. 1997, A&A, 325, 81
- Sakamoto et al. (1999) Sakamoto, K., Okumura, S. K., Ishizuki, S., & Scoville, N. Z. 1999, ApJ, 525, 691
- Sawada-Satoh et al. (2000) Sawada-Satoh, S., Inoue, M., Shibata, K. M., Kameno, S., Migenes, V., Nakai, N., & Diamond, P. J. 2000, PASJ, 52, 421
- Sawada-Satoh et al. (2002) Sawada-Satoh, S., Inoue, M., Shibata, K. M., Kameno, S., Nakai, N., Migenes, V., & Diamond, P. J. 2002, in IAU Symposium, 404
- Serabyn et al. (1993) Serabyn, E., Güsten, R., & Schulz, A. 1993, ApJ, 413, 571
- Shaw et al. (1993) Shaw, M., Wilkinson, A., & Carter, D. 1993, A&A, 268, 511
- Shlosman & Begelman (1989) Shlosman, I., & Begelman, M. C. 1989, ApJ, 341, 685
- Silk (1985) Silk, J. 1985, ApJ, 292, L71
- Silk (1987) Silk, J. 1987, in IAU Symp. 115: Star Forming Regions, 663–689
- Soifer et al. (1989) Soifer, B. T., Boehmer, L., Neugebauer, G., & Sanders, D. B. 1989, AJ, 98, 766
- Soifer et al. (1987) Soifer, B. T., Sanders, D. B., Madore, B. F., Neugebauer, G., Danielson, G. E., Elias, J. H., Lonsdale, C. J., & Rice, W. L. 1987, ApJ, 320, 238
- Strickland et al. (2004a) Strickland, D. K., Heckman, T. M., Colbert, E. J. M., Hoopes, C. G., & Weaver, K. A. 2004a, ApJ, 606, 829
- Strickland et al. (2004b) —. 2004b, ApJS, 151, 193
- Terlevich (1996) Terlevich, R. 1996, Vistas in Astronomy, 40, 17
- Tingay & Murphy (2001) Tingay, S. J., & Murphy, D. W. 2001, ApJ, 546, 210
- Trotter et al. (1998) Trotter, A. S., Greenhill, L. J., Moran, J. M., Reid, M. J., Irwin, J. A., & Lo, K. 1998, ApJ, 495, 740
- Tully et al. (1992) Tully, R. B., Shaya, E. J., & Pierce, M. J. 1992, ApJS, 80, 479
- Veilleux et al. (1994) Veilleux, S., Cecil, G., Bland-Hawthorn, J., Tully, R. B., Filippenko, A. V., & Sargent, W. L. W. 1994, ApJ, 433, 48
- Vollmer et al. (2004) Vollmer, B., Beckert, T., & Duschl, W. J. 2004, A&A, 413, 949
- Wainscoat et al. (1989) Wainscoat, R. J., Freeman, K. C., & Hyland, A. R. 1989, ApJ, 337, 163
- Wallin et al. (1998) Wallin, B. K., Watson, W. D., & Wyld, H. W. 1998, ApJ, 495, 774
- Wandel (1999) Wandel, A. 1999, in ASP Conf. Ser. 175: Structure and Kinematics of Quasar Broad Line Regions, 285
- Weiler et al. (1990) Weiler, K. W., Panagia, N., & Sramek, R. A. 1990, ApJ, 364, 611
- Weiler et al. (1986) Weiler, K. W., Sramek, R. A., Panagia, N., van der Hulst, J. M., & Salvati, M. 1986, ApJ, 301, 790
- Wilking & Lada (1983) Wilking, B. A., & Lada, C. J. 1983, ApJ, 274, 698
- Young et al. (1986) Young, J. S., Schloerb, F. P., Kenney, J. D., & Lord, S. D. 1986, ApJ, 304, 443