Submillimeter Observations of Low Metallicity Galaxy NGC 4214
Abstract
Results of submillimeter (m and m) observations of a nearby dwarf irregular galaxy NGC 4214 with SCUBA on JCMT are presented. We aimed at examining the far-infrared to submillimeter spectral energy distribution (SED) and properties of dust thermal emission in a low metallicity environment by choosing NGC 4214 of which gas metallicity (log O/H + 12) is 8.34. We found that the SED is quite similar to those of IRAS bright galaxies sample (IBGS) which are local bright star-forming galaxies with metallicity comparable to the solar abundance. A dust temperature and an emissivity index for NGC 4214 obtained by a fitting to the single temperature greybody model are = K and = , respectively, which are typical values for IBGS. Compiling the previous studies on similar nearby dwarf irregular galaxies, we found that NGC 1569 shows similar results to those of NGC 4214, while NGC 4449 and IC 10 SE show different SEDs and low emissivity indices. There seems to be a variety of SEDs among metal poor dwarf irregular galaxies. We examined dependence on intensity of interstellar radiation field as well as two-temperature model, but the origin of the difference is not clear. Some mechanism(s) other than metallicity and interstellar radiation field must be responsible for controlling dust emission property.
1 Introduction
The nature of a dust thermal emission in a low metallicity environment is presently not well understood. Bolatto et al. (2000) made a SCUBA (Submillimeter Common Use Bolometer Array) observation of a nearby low-metallicity (log O/H + 12 , Skillman et al. 1989) dwarf irregular galaxy IC 10 toward its most active star forming region (IC 10 SE) and found that it has unusual dust properties. They combined their SCUBA data on IC 10 SE with IRAS (Infrared Astronomical Satellite), KAO (Kuiper Airborne Observatory), and IRAM (Institute de Radio Astronomie Millimeterique) data to derive the spectral energy distribution (SED) of the dust emission from IC 10 SE. They could not reproduce the observed SED by the single temperature greybody model () with a normal dust temperature (e.g., 40 K) and an emissivity index (e.g., 1.5). They concluded that the dust emissivity index in IC 10 SE is very low (0.5) and the dust temperature is high ( K). Concerning the low gas metallicity of IC 10 SE, Bolatto et al. (2000) suggest that small grains may be efficiently destroyed by intense UV light from OB stars in a low metallicity environment, which results in the low emissivity index.
The unusual property of dust emission is also suggested for high redshift star-forming galaxies called Lyman break galaxies (LBGs) at . Their rest-frame UV spectra resemble very much those of nearby star-forming dwarf irregular galaxies like NGC 4214 (see Figure 1 of Steidel et al. 1996; Shapley et al. 2003), and their gas metallicities are estimated to be log O/H + 12 7.88.7 (Pettini et al. 2001), which are also comparable to those of nearby star-forming dwarf irregular galaxies. Rest-frame UV to optical SEDs indicate that the lights from LBGs are extinguished by dust to some degree (Meurer et al. 1997; Sawicki and Yee 1998; Shapley et al. 2001; Papovich et al. 2001). The energy absorbed by dust should be thermally re-emitted in the far-infrared (FIR), suggesting that LBGs are detectable in the submillimeter. Both simple scaling of typical UVFIR SED of nearby starburst galaxies, as well as more sophisticated energy budget considerations, predict that LBGs at would be detectable with SCUBA (Ouchi et al. 1999; Sawicki 2001). However except for a few LBGs, virtually no LBGs have been detected in the submillimeter wavelength (Chapman et al. 2000; Webb et al. 2003). Ouchi et al. (1999) and Sawicki (2001) suggest the following possibilities to account for the non-detections:(1) A very high dust emissivity index in LBGs with the “normal” dust temperature of around 40 K or (2) a very high dust temperature ( K). In any cases, the SCUBA non-detections suggest that dust properties in the LBGs may be unusual. Such high dust temperature is also predicted theoretically for an early phase ( yr) of an initial starburst (Hirashita et al. 2002).
Motivated by these results obtained at low-z low-Z and high-z low-Z, we examine whether the low metallicity environment results in unusual emission properties of dust. It is useful to study SEDs of dust emission in nearby dwarf irregular galaxies, which provide us a good laboratory for examining FIR and submillimeter SEDs and dust emission property in the low metallicity environment under an intense star formation. Here we present results of submillimeter observations of the local dwarf irregular galaxies NGC 4214. NGC 4214 is located at a distance of 4.1 Mpc (Leitherer et al. 1996) and its gas metallicity is obtained to be log O/H + 12 = 8.34 (Skillman et al. 1989). Detailed studies such as in CO, HI, and H were made (Taylor et al. 1995; Walter et al. 2001), and IRAS and KAO data are also available for the object, which makes it a good target for our purpose. In section 2 we describe the observations and data analysis, and present the resulting maps in submillimeter. We also present the SED of NGC 4214, and derive a dust temperature and an emissivity index. A comparison with nearby massive star-forming galaxies is made in section 3 and with other local dwarf irregular galaxies in section 4. Discussion is given in section 5 and summary in section 6.
2 Observations and results
NGC 4214 was observed at 450 m and 850 m simultaneously with the SCUBA at JCMT in December 8, 2001 in service mode. The observations were made with the jiggle mode resulting in a map of size . The observed field was centered on the position at and . The total observing time was 1 hour both at 450 m and at 850 m. A flux calibration was done by observing the secondary calibrator CRL618; the assumed flux densities were 11.2 1.4 Jy at 450m and 4.56 0.17 Jy at 850 m. The data were reduced by JCMT staff in the standard manner using the orac package. A correction for atmospheric opacity was done by extrapolating the value derived at 225 GHz with Caltech Submillimeter Observatory tipping radiometer to 850 m and 450 m.
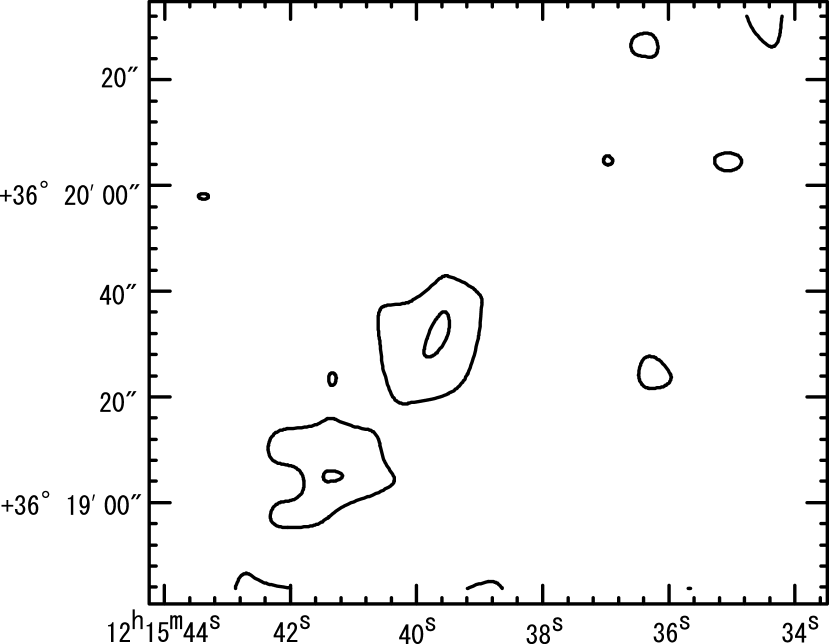
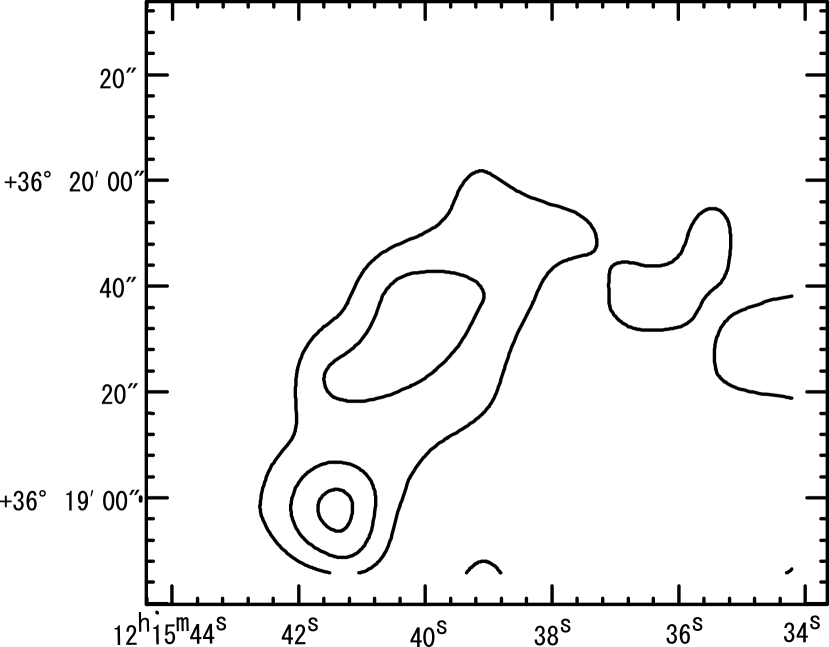
We determined a sky background as a mean of flux values in many apertures with the same size as the beamsize randomly put on a sky region avoiding the object, and subtracted the sky. Contour maps of NGC 4214 at 450 m and 850 m after background subtraction are shown in Figure 1. The noises of the two maps were estimated according to the way of Dunne et al. (2000) and Dunne & Eales (2001) by including three kinds of noise/error sources; sky subtraction error, shot noise, and calibration error. The resulting 1 sigma noises are 50 mJy beam-1 and 7 mJy beam-1 at 450 m and 850 m, respectively.
In Figure Submillimeter Observations of Low Metallicity Galaxy NGC 4214, two peaks are seen in the map at m; one is located around the center of the map and the other one 30′′ southeast of the central component. Although the significance of the peaks is not so high, these peaks almost coincide with those of H and CO (10) distribution (Walter et al. 2001), which makes the detection reliable. In the 450 m map, the significance of the two peaks is lower, but the locations are very close to those at 850m. HI and CO (10) emission are also seen at 30′′ northwest of the central component (Walter et al. 2001); the intensity of HI and CO(10) is comparable to those at 30′′ southeast. However no submillimeter emission and H emission can be seen. This may indicate that this region is under a very early phase of star formation and the dust does not yet form or is not heated up to radiate. Alternatively, type-II supernova explosions occurred in this region and destroyed large dust grains (Jones et al. 1996), which leads to high temperature not to be detectable at the longer wavelength. This subject is interesting with regard of star formation process and history in NGC 4214, but it is beyond our scope in this paper.
To derive the total flux densities at the two bands, we made a growthcurve in each band adopting the centroid of the flux distribution as the center. Resulting total flux densities are 0.56 Jy and 0.04 Jy. We examined contamination by thermal free-free emission by extrapolating the spectrum in the radio wavelength (at 4.85 GHz; Becker et al. 1991) as , and found that the contribution is 4 % and 20 % at 450 m and at 850 m, respectively. The CO(32) emission-line falls into the bandpass at 850 m, but there is no observation for NGC 4214 at the line. Therefore we assume the CO(32)/CO(10) ratio to be unity (e.g., Lisenfeld et al. 2002 for NGC 1569) to derive the maximum contamination. With the intensity of CO() emission line (Walter et al. 2001), the estimated maximum contamination of the line emission for the flux at 850 m is less than 1%.
The SED of NGC 4214 is shown in Figure 2 (the contaminations are not corrected). Total flux densities of NGC 4214 at 60 m and 100 m were obtained with IRAS by Soifer et al. (1989). The flux at 150 m was obtained with KAO (Thronson et al. (1988)). All the data are summarized in Table Submillimeter Observations of Low Metallicity Galaxy NGC 4214.
We fit the resulting SED with a single component temperature model, i.e., . Here is the Planck function, the optical depth with , dust temperature and emissivity index. The best-fit resulting parameter values are K and , and are given in Table 2. The best fit model spectrum is shown in Figure 2 (solid line). It should be noted that the resulting parameter values are within a 1 sigma error, even if we correct for the contaminations.
3 Comparison with IRAS bright galaxies
In order to compare the and obtained for NGC 4214 with those of bright star-forming galaxies, we derived dust temperatures and emissivity indices of a subset of IRAS Bright Galaxy Sample (IBGS)(Soifer et al. 1989) by fitting their SEDs with the single temperature model. The flux densities at 60 m, and 100 m were obtained with IRAS, and these at 450 m and 850 m were obtained with SCUBA by Dunne & Eales (2001). Although metallicity of these galaxies are not available, since most of them are optically bright, they should have high metallicity (e.g., Skillman et al. 1989). In fact, for about 20 % of the IBGS, metallicities are obtained by James et al. (2002) and most of them lie in 8.6 log O/H + 12 9.0.
Derived dust temperatures and emissivity indices of the IBGS and NGC 4214 are shown in Figure 3. A typical error for the IBGS sample is 1 K for a dust temperature and 0.1 for . It should be noted here that some (30 %) of the IBGS are not fitted within 1 sigma by using the single dust temperature model. Derived dust temperatures of IBGS distribute between 25 K and 45 K, and emissivity indices distribute between 1.2 and 1.6. The dust temperature and emissivity index of NGC 4214 lie in the region occupied by IBGS. Therefore no significant difference in FIR-submillimeter SEDs between NGC 4214 and IBGS depending on metallicity is found.
4 Comparison with NGC 1569, NGC 4449, and IC 10
In addition to the data of NGC 4214, we compiled FIRsubmillimeter data from the previous studies for three dwarf irregular galaxies having similar low metallicity: NGC 1569 (e.g., Lisenfeld et al 2002), NGC 4449 (e.g., Böttner et al. 2003) and IC 10 SE (e.g., Bolatto et al. 2001). Total flux densities of these at 60 m and 100 m were obtained with IRAS and those at 150 m were obtained with KAO. Submillimeter data were obtained with SCUBA on JCMT. The data are summarized in Table Submillimeter Observations of Low Metallicity Galaxy NGC 4214 with their data sources. The resulting dust temperatures and emissivity indices obtained through the SED fitting by using the single temperature model are listed in Table 2.
In Figure 3, the dust temperatures and emissivity indices of the three dwarf galaxies are plotted. As with NGC 4214, NGC 1569 is located in the parameter region occupied by IBGS and shows normal nature of the dust emission. Meanwhile, NGC 4449 and IC 10 SE fall in positions far away from the region occupied by IBGS, indicating some unusual property of the dust emission. Their flux densities at 450 m and at 850 m may be contaminated by free-free radiations and CO line emissions. However even if we correct for these contaminations, the emissivity index changes within 1 sigma errors, hence the contaminations are not the cause for the large deviations.
In Figure 4, the dust temperatures are shown against the 60 m luminosity density . The of the dwarf irregular galaxies are about two orders of magnitude smaller than those of IBGS, but the dust temperature of them are not lower than those of IBGS. If a liner correlation between luminosity-density and temperature exists (Dunne et al. 2000), it holds so only for bright galaxies and breaks down at smaller luminosities.
To summarize, although the dust temperatures of some dwarf irregular galaxies with low metallicity are relatively high as compared with those of IBGS (majority of which should be metal rich), the gas metallicity is not the primary parameter controlling dust temperature and emissivity. There seems to be a variety in SED among dwarf irregular galaxies with metallicity of log O/H + 12 .
5 Discussion
Although metallicities of the dwarf irregular galaxies studied here are almost the same, why dust emission properties of IC 10 SE and NGC 4449 are quite different from NGC 4214 and NGC 1569?. Bolatto et al. (2000) suggested that low metallicity and strong radiation fields are required to have a low dust emissivity index, which may lead to high dust temperature. If so, IC 10 SE and NGC 4449 should have a stronger radiation field than NGC 4214 and NGC 1569 which have a normal dust emissivity index and dust temperature. In order to examine this, we estimate the intensity of interstellar radiation field () for each of them. Since IC 10 SE was not observed at UV wavelength, adopting a -band luminosity we estimate an average as , where refers to an area of a dust emitting region in cm2 determined from the 850 m contour map. (We took the same aperture size as Bolatto et al. (2000) adopted for IC 10 SE.) The -band luminosity is derived in the aperture with the same size as ; photometric data are taken from the Lyon-Meudon Extragalactic Database (LEDA). These values are corrected for the Galactic foreground extinction (we do not correct for an internal extinction) and are shown in Table Submillimeter Observations of Low Metallicity Galaxy NGC 4214. These estimations are expected to have an uncertainty of factor of about 2. The s of IC 10 SE and NGC 4449 are comparable to that of NGC 4214, but are slightly smaller than that of NGC 1569. A fraction of UV photons radiated from OB stars must be absorbed by dust and re-emits from the dust at FIR. Thus we also estimate FIR s using 60 m fluxes as . The results are also shown in Table Submillimeter Observations of Low Metallicity Galaxy NGC 4214. The of IC 10 SE is the highest, while that of NGC 4449 is the lowest. A total of IC 10 SE is comparable to that of NGC 1569, rather than that of NGC 4449, for which the total is the lowest. Hence, the high does not necessarily lead to the high dust temperature and low dust emissivity index; the results indicate the is not the primary cause for the difference of SEDs. Therefore some other mechanism(s) other than metallicity and must be responsible for controlling dust temperature in these objects.
Since the parameters used above are derived from the SED fitting forced to the simple one-temperature model, we show SEDs of these dwarf irregular galaxies normalized at 100 m in Figure 5 together with a normalized mean SED of IBGS to see the shapes of the SEDs in more detail. The shape of the SEDs of NGC 4214 and NGC 1569 matches the mean SED of IBGS within its 1 sigma deviation. The SEDs of NGC 4449 and IC 10 SE, however, have large excesses against the mean SED of IBGS in the longer wavelength regime. The peak of the SED of NGC 4449 locates at the longer wavelength than 100 m. The SED of NGC 4449 can not be well fitted with the one-temperature component model and the uncertainties of derived parameters are quite large. Thus we try to make SED fitting by employing a two-temperature model with a fixed emissivity index. When we adopt the emissivity index of 2.0, the distribution of high-temperature () and low-temperature () for IBGS shows two distinct groups as shown in Figure 6; one is located around K and K (group 1), while the other around K and K (group 2). The galaxies in the group 1 have cold-to-warm dust mass ratios of 10–100, while the galaxies in group 2 show the large () dust mass ratios. The SEDs for the group 1 are well fitted with the one-temperature model, while those of group 2 are not well fitted with it. NGC 4214 and IC 10 SE locate close to group 1, and NGC 4449 locates close to group 2. NGC 1569 locates between the two groups. This result suggests there is another parameter affecting the shape of SED other than metallicity and . FIR luminosity does not correlate with this trend. The large mass ratio of cold-to-warm dust may suggest the difference of a phase of star formation. However, when we adopt the emissivity index of 1.5, the trend seen in Figure 6 disappears. In addition, for some of the IBGS, the obtained high-temperature is very much close to the low-temperature, indicating that employing the two-temperature model is not appropriate for these. Since the data points presented here is not large for each galaxy and our data do not have very good signal-to-noise ratios, getting into detail discussion using a multi-component model is out of our scope. More data points and much better signal-to-noise ratios seem to be necessary to examine multi-component models in detail.
6 Summary
We observed a nearby dwarf irregular galaxy NGC 4214, whose gas metallicity (log O/H + 12) is 8.34, at m and m with SCUBA on JCMT, aimed at examining dust emission property in a low metallicity environment. The spectral energy distribution in FIR to submillimeter is quite similar to those of IRAS Bright Galaxy Sample (IBGS), most of which are inferred to be metal rich galaxies. The derived dust temperature and the emissivity index through the one-temperature model show typical values for IBGS. Compiling the previous studies on similar nearby dwarf irregular galaxies, we found that NGC 1569 shows a similar SED and thus the dust temperature and the emissivity index to those of NGC 4214, while NGC 4449 and IC 10 SE show unusually low emissivity indices, and IC 10 SE shows a significantly high dust temperature. There seems to be a variety of SEDs among metal poor dwarf irregular galaxies. We examined dependence on intensity of interstellar radiation field as well as two-temperature model, but the origin of the difference is not clear. Further observations at more wavelengths with a good signal-to-noise ratios seem to be necessary to discuss the origin of the variety.
We were expecting to find a correlation between dust temperature and metallicity, but we do not. This suggests that some other property other than metallicity and must be important. We do not know what that property is at the moment. One possibility is that the age of the starburst. Theoretical work (e.g., Hirashita et al. 2002) suggests that dust temperature is high in the early stage of a galaxy’s life and then drops slowly over time. In this scenario, the high dust temperature of cB58 (Sawicki 2001) and other LBGs (Ouchi et al. 1999; Chapman et al. 2000) would suggest that the starbursts in the LBGs are young. It would be consistent with the ages ( Myr) of stellar populations in LBGs obtained through spectral energy distribution fitting (e.g., Sawicki & Yee 1998; Papovich et al. 2001). To better test this hypothesis that dust temperature depends on the age of the starburst rather than its metallicity will require us to age-date a sample of local galaxies that contains objects with a range of metallicities and dust temperatures.
This work is partly supported by a Grant-in-Aid for Scientific Research (15540233) from the Japan Society for the Promotion of Science.
References
- Becker et al. (1991) Becker, R. H., White, R. L., & Edwards, A. L. 1991, ApJS, 75, 1
- Bolatto et al. (2000) Bolatto, A. D., Jackson, J. M., Wilson, C. D., & Moriarty-Schieven, G. 2000, ApJ, 532, 909
- Böttner et al. (2001) Böttner, C., Klein, U., & Heithausen, A. 2003, A&A, 408, 493
- Chapmann et al. (2000) Chapman, S. C., et al. 2000, MNRAS, 319, 318
- Dunne et al. (2000) Dunne, L., Eales, S., Edmunds, M., Ivison, R., Alexander, P., & Clements, D. L. 2000, MNRAS, 315, 115
- Dunne & Eales (2001) Dunne, L., & Eales, S. 2001, MNRAS, 327, 697
- Frueh et al. (1996) Frueh, M. L., Corwin, H. G., de Vaucouleurs, G., & Buta, R. 1996, AJ, 111, 722
- Hirashita et al. (2002) Hirashita, H., Hunt, L. K., & Ferrara, A., 2002, MNRAS, 330, 19
- Hunter et al. (1986) Hunter, D. A., Gillett, F. C., Gallgher, J. S., Rice, W. L., & Low, F. L. 1986, ApJ, 303, 171
- Hunter et al. (1989) Hunter, D. A., Thronson, H. A., Casey, S., & Harper, D. A. 1989, ApJ, 341, 697
- Israel et al. (1988) Israel, F. P. 1988, A&A, 194, 24
- James et al. (2002) James, A., Dunne, L., Eales, S., & Edmunds, M. G. 2002, MNRAS, 335, 753
- Jones et al. (1996) Jones, A. P., Tielens, A. G. G. M., & Hollenbach, D. J. 1996, ApJ, 469, 740
- Karachentsev et al. (2003) Karachentsev, I. D., et al. 2003, A&A, 398, 467
- Kormendy. (1977) Kormendy, J. 1977, ApJ, 214, 359
- Leitherer et al. (1996) Leitherer, C., Vacca, W. D., Conti, P. S., Filippenko, A, V., Robert, C., & Sargent, W. L. W. 1996, ApJ, 465, 717
- Lisenfeld et al. (2002) Lisenfeld, U., Israel, F. P., Stil, J. M., & Sievers, A. 2002, A&A, 382, 860
- Meurer et al. (1997) Meurer, G. R., Heckman, T. M., Lehnert, M. D., Leitherer, C., & Lowenthal, J. 1997, AJ, 114, 54
- Ouchi et al. (1999) Ouchi, M., Yamada, T., Kawai, H., & Ohta, K. 1999, ApJ, 517, L19
- Papovich et al. (2001) Papovich, C., Dickinson, M., & Ferguson, H. C. 2001, ApJ, 559, 620
- Pettini et al. (2001) Pettini, M., Shapley, A. E., Steidel, C. C., Cuby, J. -G., Dickinson, M., Moorwood, A, F, M., Adelberger, K. L., & Giavalisco, M. 2001, ApJ, 554, 981
- Richer et al. (2001) Richer, M. G., et al. 2001, A&A, 370, 34
- Sawicki & Yee (1998) Sawicki, M., & Yee, H. K. C. 1998, AJ, 115, 1329
- Sawicki (2001) Sawicki, M. 2001, AJ, 121, 2405
- Schlegel et al. (1998) Schlegel, D. J., Finkbeiner, D. P., & Davis, M. 1998, ApJ, 500, 525
- Shapley et al. (2001) Shapley, A. E., Steidel, C. C., Adelberger, K. L., Dickinson, M., Giavalisco, M., & Pettini, M. 2001, ApJ, 562, 95
- Shapley et al. (2003) Shapley, A. E., Steidel, C. C., Pettini, M., & Adelberger, K. L. 2003, ApJ, 588, 65
- Skillman et al. (1989) Skillman, E. D., Kennicutt, R. C., & Hodge, P. W. 1989, ApJ, 347, 875
- Soifer et al. (1989) Soifer, B. T., Neugebauer, B. G., & Sanders, D. B. 1989, AJ, 98, 766
- Steidel et al. (1996) Steidel, C. C., Giavalisco, M., Dickinson, M., & Adelberger, K. L. 1996, AJ, 112, 352
- Taylor et al. (1995) Taylor, C. L., Brinks, E., Grashuis, R. M., & Skillman, E. D. 1995, ApJS, 99, 427(erratum 102, 189[1996])
- Thronson et al. (1987) Thronson, H. A., Hunter, D. A., Telesco, C. M., Decher, R., & Harper, D. A. 1987, ApJ, 317, 180
- Thronson et al. (1988) Thronson, H. A., Greenhouse, M., Hunter, D. A., Telesco, C. M., & Harper, D. A. 1988, ApJ, 334, 605
- Thronson et al. (1990) Thronson, H. A., Hunter, D. A., Casey, S., & Harper, D. A. 1990, ApJ, 334, 94
- de Vaucouleurs & Ables (1965) de Vaucouleurs, G., & Ables, H. 1965, PASP, 77, 272
- de Vaucouleurs (1959) de Vaucouleurs, G., 1959, Lowell Obs. Bull., 4, n. 97 & n. 98
- (37) Walter, F., Taylor, C. L., Hüttemeister, S., Scoville, N., & McIntyre, V. 2001, AJ, 121, 727
- Webb et al. (2003) Webb, T. M., et al. 2003, ApJ, 582, 6
- Wilson et al. (1996) Wilson, C. D., Welch, D. L., Reid, I. N., Saha, A., & Hoessel, J. 1996, AJ, 111, 1106


| Name | (Jy) | (Jy) | (Jy) | (Jy) | (Jy) | logO/H12**Taken from Skillman et al. 1989. | Ref. |
|---|---|---|---|---|---|---|---|
| NGC 4214 | 8.34 | (1) | |||||
| NGC 1569 | 8.16 | (2) | |||||
| NGC 4449 | 8.32 | (3) | |||||
| IC 10 SE | 8.20 | (4) |
References. — (1) Soifer et al. 1989 for 60 and 100 m, Thronson et al. 1988 for 150 m, this work for 450 and 850 m; (2) IRAS point source catalog for 60 m and 100 m, Hunter et al. 1989 for 150 m, Lisenfeld et al. 2002 for 450 m, James et al. 2002 for 850 m; (3) Hunter et al. 1986 for 60 and 100 m, Thronson et al. 1987 for 150 m, Böttner et al. 2003 for 450 and 850 m; (4) Bolatto et al. 2001 for 60 m and 850 m, Thronson et al. 1990 for 100 m and 150 m.
| Name | (K) | |
|---|---|---|
| NGC 4214 | 35.0 0.8 | 1.4 0.1 |
| NGC 1569 | 39 4 | 1.4 0.1 |
| NGC 4449**NGC 4449 is not fitted within 1 sigma with the single temperature model. | 35 | 0.8 |
| IC 10 SE | 58 15 | 0.3 0.6 |
| Name | distance | E(B-V) | Ref. | |||
|---|---|---|---|---|---|---|
| (mag) | (Mpc) | (str)10-7 | (erg sec-1cm-2) | (erg sec-1cm-2) | ||
| NGC 4214 | 4.1 | 1.7 | 0.022 | 1.910-2 | 6.6 10-2 | (1) |
| NGC 1569 | 2.2 | 1.92 | 0.56 | 5.610-2 | 1.510-1 | (2) |
| NGC 4449 | 4.1 | 5.2 | 0.01 | 1.310-2 | 4.410-2 | (3) |
| IC 10 SE | 0.82 | 0.46 | 0.77 | 2.510-2 | 3.510-1 | (4) |
References. — (1) Leitherer et al. 1996 for the distance, Schlegel et al. 1998 for E(B-V), de Vaucouleurs 1959 for -band flux; (2) Israel 1988 for the distance and E(B-V), Kormendy 1977 for -band flux; (3) Karachentsev et al. 2003 for the distance, Schlegel et al. 1998 for E(B-V), Frueh et al. 1996 for -band flux; (4) Wilson et al. 1996 for the distance, Richer et al. 2001 for E(B-V), de Vaucouleurs & Ables 1965 catalog for -band flux.