The 2dF Galaxy Redshift Survey: the local E+A galaxy population
Abstract
We select a sample of low-redshift () E+A galaxies from the 2dF Galaxy Redshift Survey (2dFGRS). The spectra of these objects are defined by strong hydrogen Balmer absorption lines (H, H, H) combined with a lack of [OII] emission, together implying a recently-truncated burst of star formation. The E+A spectrum is thus a signpost to galaxies in the process of evolution.
We quantify the local environments, clustering properties and luminosity function of the E+A galaxies. We find that the environments are consistent with the ensemble of 2dFGRS galaxies: low-redshift E+A systems are located predominantly in the field, existing as isolated objects or in poor groups. However, the luminosity distribution of galaxies selected using three Balmer absorption lines H appears more typical of ellipticals. Indeed, morphologically these galaxies are preferentially spheroidal (E/S0) systems. In a small but significant number we find evidence for recent major mergers, such as tidal tails. We infer that major mergers are one important formation mechanism for E+A galaxies, as suggested by previous studies. At low redshift the merger probability is high in the field and low in clusters, thus these recently-formed spheroidal systems do not follow the usual morphology-density relation for ellipticals.
Regarding the selection of E+A galaxies: we find that basing the Balmer-line criterion solely on H absorption leads to a significant sub-population of disk systems with detectable H emission. In these objects the [OII] emission is presumably either obscured by dust or present with a low signal-to-noise ratio, whilst the (H, H) absorption features are subject to emission-filling.
keywords:
galaxies: interactions – galaxies: formation – surveys1 Introduction
E+A galaxies possess a characteristic spectral signature defined by strong hydrogen Balmer absorption lines (H, H, H) combined with a lack of optical emission lines such as [OII] (Dressler & Gunn 1983). The Balmer absorption lines are imprinted in the galaxy spectrum by A stars, indicating the presence of a young ( Gyr old) stellar population. However, the absence of [OII] emission suggests that star formation is no longer ongoing. The inference is that these galaxies have previously undergone a burst of star formation, which has recently been truncated rather suddenly (Dressler & Gunn 1983; Couch & Sharples 1987). For this reason, these systems are also known as ‘post-starburst galaxies’.
The physical mechanisms governing the triggering and cessation of this starburst are not yet fully understood, but undoubtedly reflect the interaction of the galaxy with its environment. In general, this can occur through interaction with other galaxies (mergers or tidal gravitational effects) or, for those galaxies residing in clusters, through effects specific to that environment; involving either the hot intracluster gas (ram-pressure effects) or the cluster gravitational potential. Theoretical modelling of all these scenarios is not yet complete, although it is known that a major galaxy merger can produce the characteristic E+A spectral signature (Bekki, Shioya & Couch 2001). In practice, more than one of the above mechanisms is probably responsible for the overall population of E+A galaxies, with different mechanisms operating in different environments. As such, these galaxies are an interesting probe of environmental influences on galaxy evolution.
The population of E+A galaxies exhibits dramatic evolution with redshift. These galaxies are commonplace in intermediate-redshift clusters, where they were first identified and studied (Dressler & Gunn 1983): ‘E’ and ‘A’ representing respectively the assumed morphology and the dominant stellar lines of the spectrum, although high-resolution Hubble Space Telescope (HST) imaging of such clusters later revealed that these galaxies were predominantly early-type disk systems (Couch et al. 1998; Dressler et al. 1999). Whilst E+A galaxies are prevalent in intermediate-redshift clusters (e.g. Tran et al. 2003), they only constitute about 1 per cent of the members of nearby clusters (Fabricant, McClintock & Bautz 1991). As a fraction of the overall zero-redshift galaxy population, E+A objects comprise significantly less than 1 per cent (Zabludoff et al. 1996). This rarity has rendered environmentally-unbiased studies of low-redshift E+A galaxies in statistically significant numbers difficult until the recent advent of large-scale galaxy surveys.
The first such study was that of Zabludoff et al. (1996) who identified 21 low-redshift () E+A systems from 11113 galaxies in the Las Campanas Redshift Survey. Interestingly, 75 per cent of these objects were located in the field, well outside the rich clusters in which E+A galaxies were originally studied, implying that a cluster-specific mechanism is not essential for E+A galaxy formation. Furthermore, the ground-based morphologies of these galaxies showed evidence for tidal features in 5 out of the 21 cases, implicating galaxy-galaxy mergers or interactions as a formation mechanism. HST imaging (Yang et al. 2004) later strengthed these hints by revealing the detailed morphological picture of a gas-rich merger. The Zabludoff et al. sample was also investigated via spatially-resolved spectroscopy (Norton et al. 2001), probing the kinematics of the component stellar populations, and providing further evidence that E+A galaxies in the field represent a transitional phase between disk-dominated, rotationally-supported systems and spheroid-dominated, pressure-supported galaxies.
In this paper we extend the study of Zabludoff et al. (1996) by selecting a low-redshift E+A sample from the 221000 galaxy spectra which form part of the final data release of the 2dF Galaxy Redshift Survey (2dFGRS; Colless et al. 2001, 2003). We use two different selection techniques, the first based on three Balmer absorption lines (H, H, H) and the second utilizing solely the H line. These two methods yield samples of 56 and 243 galaxies respectively. The significantly increased size of these catalogues (with respect to Zabludoff et al.) allows us to measure statistical properties of the E+A galaxy population, such as the luminosity function and the clustering properties, and provides a wider database for exploring morphologies. We note that similar low-redshift populations of E+A galaxies have been selected from the Sloan Digital Sky Survey (SDSS): Goto et al. (2002) presented a catalogue of H-selected SDSS galaxies and Quintero et al. (2004) fitted a linear sum of A-star and K-star spectra to SDSS galaxies, analyzing the photometric properties of the sub-sample with an excess ratio of A-star to K-star components. We compare our results to this work where possible.
The plan of this paper is as follows: in Section 2 we describe the selection of our 2dFGRS E+A galaxy samples, compare the selected populations to theoretical tracks in the [colour, EW(H)]–plane, and use H emission to test for any ongoing but obscured star formation. In Section 3 we use Supercosmos Sky Survey images to investigate the E+A galaxy morphologies. In Sections 4, 5 and 6 we measure various statistical properties of the E+A galaxy population: the local environments, clustering properties and luminosity function. Throughout this paper, we convert redshifts to physical distances using cosmological parameters , , .
2 Sample selection
2.1 The 2dF Galaxy Redshift Survey
We selected E+A galaxies from the final data release of the 2-degree Field Galaxy Redshift Survey (2dFGRS), a major spectroscopic survey of about 221000 galaxies undertaken using the 2dF facility at the Anglo-Australian Observatory. The 2dFGRS covers an area of approximately 1500 deg2 in three regions: an North Galactic Pole (NGP) strip, a South Galactic Pole (SGP) strip and a series of random fields scattered around the SGP strip. The 2dFGRS input catalogue was selected in the photographic band from the Automatic Plate Measuring facility (APM) galaxy survey (and its subsequent extensions), with a nominal extinction-corrected magnitude limit . The survey spectra were obtained through 2-arcsecond fibres and cover the wavelength range at a resolution of . This wide wavelength range is made possible by the use of an atmospheric dispersion compensator (ADC) within the 2dF instrument. Each spectrum is visually assigned a redshift quality flag which ranges from (unreliable) to (highest quality). The spectra are not flux calibrated and thus consist of a sequence of ‘counts’ as a function of wavelength. The 2dFGRS is described in detail in Colless et al. (2001, 2003) and the database may be accessed online at http://msowww.anu.edu.au/2dFGRS/.
2.2 The 2dFGRS spectral line catalogue
Our sample selection is based on the 2dFGRS spectral line catalogue prepared by Ian Lewis. In this Section we briefly summarize the generation of the spectral line catalogue; for full details see Lewis et al. (2002). After removal of the continuum by subtracting the median over windows of width , Lewis et al. fitted up to twenty absorption or emission lines, corresponding to standard galaxy spectral features. The line profiles were assumed to be Gaussian, parameterized by an amplitude and width. The wavelength spacings of the line centres were fixed at their known laboratory values, with a variable overall offset to accommodate redshifting. The quality of each line fit was classified by a flag determined by the rms residuals, ranging from 0 (bad fit) to 5 (good fit), and a signal-to-noise parameter was computed for each line (relative to the continuum). Where possible, equivalent widths were then deduced using the fitted line flux and the value of the continuum flux in the local window. This does not require absolute flux calibration of the spectra, although we must assume that there is no significant additive error in the continuum due to effects such as scattered light. We corrected all equivalent widths for cosmological effects by dividing by a factor , where is the galaxy redshift.
2.3 E+A galaxy selection criteria
Galaxies exhibit a continuum of properties and thus the choice of selection criteria for a specific sub-class is somewhat arbitrary. Zabludoff et al. (1996) performed the first environmentally-unbiased selection of E+A galaxies, obtained from the Las Campanas Redshift Survey (LCRS). Their sample was defined by requiring the equivalent width of [OII] emission to be less than , and the average of the equivalent widths of the Balmer lines H, H and H to exceed in absorption. These criteria are strict, selecting an extreme class of objects corresponding to 0.2 per cent (21/11113) of LCRS galaxies. Zabludoff et al. only considered spectra possessing a signal-to-noise ratio exceeding in the continua about the H, H and H lines.
We based our E+A galaxy sample selection criteria on those of Zabludoff et al., but with several adjustments. Firstly, the 2dFGRS line fits catalogue (Section 2.2) parameterizes the quality of the fit to each spectral line using a different method to that of Zabludoff et al.; thus we cannot employ an identical selection criterion as regards signal-to-noise ratio. In our analysis we considered an equivalent width measurement to be reliable if the signal-to-noise parameter of the line exceeded and the flag parameter of the line was equal to 4 or 5 (these flags are classified as a ‘good’ fit). Note that a ‘signal-to-noise parameter’ equal to is in fact a high-quality detection: this parameter is defined as the mean signal-to-noise ratio of the resolution elements of the line, averaged over three line-widths. The choice of a minimum value of is fairly arbitrary, but serves to select an extreme class of galaxies as required.
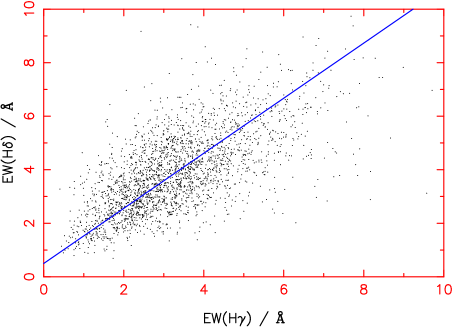
Furthermore, rather than using the average of Balmer equivalent widths, we introduced a weighting scheme. The relative equivalent widths of the Balmer absorption lines (H) in a given galaxy spectrum are determined partly by fundamental atomic physics and are hence expected to display some level of correlation. We fitted empirical linear relations to the distributions of (H,H) and (H,H) equivalent widths for objects with reliable measurements of these lines in absorption (see Fig. 1 for more details of our fitting procedure). We thereby derived empirical best-fitting correlations:
| (1) |
| (2) |
where all equivalent widths are measured in in absorption. We used these linear fitting formulae to convert H and H equivalent widths to ‘effective’ H values. For each spectrum we averaged these values for the H absorption lines. Fig. 1 displays the scatter plot for the case of (H,H).
We selected catalogues of E+A galaxies using two different methods; this allowed us to ascertain the effects of the selection criteria on the properties of the sample. The first selection method was based on the average of the weighted Balmer ‘effective H’ equivalent widths described above, the value of which was required to exceed in absorption. The second selection was based solely on the H equivalent width, which was required to exceed . We emphasize again that as there is no sign of bimodality in the sample, the choice of the value is fairly arbitrary. All E+A objects were required to have no detection of [OII] emission. Non-detection was defined either by an [OII] flag parameter equal to zero, or by a flag parameter and an [OII] equivalent width less than in emission.
In more detail: the catalogue of 2dFGRS spectral line fits compiled by Lewis et al. (2002) contains 264765 spectra, including repeat observations of the same source. We only used high-quality 2dFGRS galaxy spectra defined by:
-
•
2dFGRS redshift quality flag
-
•
ADC flag (spectra observed earlier than August 1999 are afflicted by problems with the ADC, resulting in severe depletion of counts at the blue end of the spectrum, and are assigned ADC flag )
-
•
Redshift (in order to exclude stars)
These cuts left a total of 161437 high-quality galaxy spectra. We next required that there was little or no detectable [OII] line emission, defined by either
-
•
Flag parameter of [OII]
or
-
•
Flag parameter of [OII]
-
•
Equivalent width of [OII] emission
This requirement was satisfied by 66422 galaxies. For the first of our two E+A galaxy catalogues, we made the selection for Balmer absorption based on the H lines:
-
•
Signal-to-noise parameter of each of H
-
•
Flag parameter of each of H
-
•
The average ‘effective H’ equivalent width (where H equivalent widths are weighted by the fitted conversion factors) in absorption
This produced a final sample of 56 galaxies (0.03 per cent of high-quality galaxy spectra). We refer to this sample as the ‘average-Balmer E+A catalogue’ (Table 2).
Fig. 2 plots the first ten 2dFGRS spectra from this catalogue, with wavelengths corrected to the galaxy rest frame (there is no bias induced by plotting the first ten; this is a representative sub-sample). Important spectral features are indicated. Weak emission lines are occasionally evident ([OIII] in spectrum and [NII] in and ) that are potentially due to weak star formation (see Section 2.5) or to AGN activity.
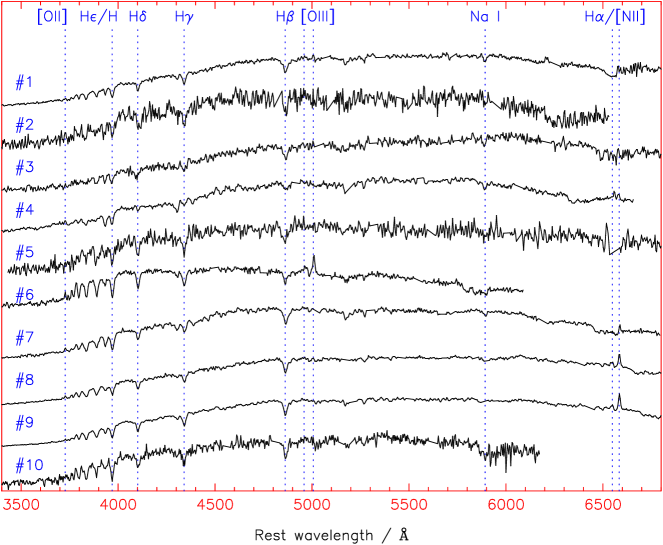
We note that the H line is fitted with both an emission and an absorption Gaussian component in the spectral line catalogue. We only considered the absorption component; in almost all relevant cases the emission component was negligible.
For the second of our two E+A galaxy catalogues, we made the Balmer absorption line selection based purely on the equivalent width of H:
-
•
Signal-to-noise parameter of H
-
•
Flag parameter of H
-
•
H equivalent width in absorption
This resulted in a sample of 243 galaxies (0.15 per cent of high-quality spectra). We refer to this sample as the ‘H E+A catalogue’. We note that this sample contains 36 of the 56 average-Balmer catalogue members.
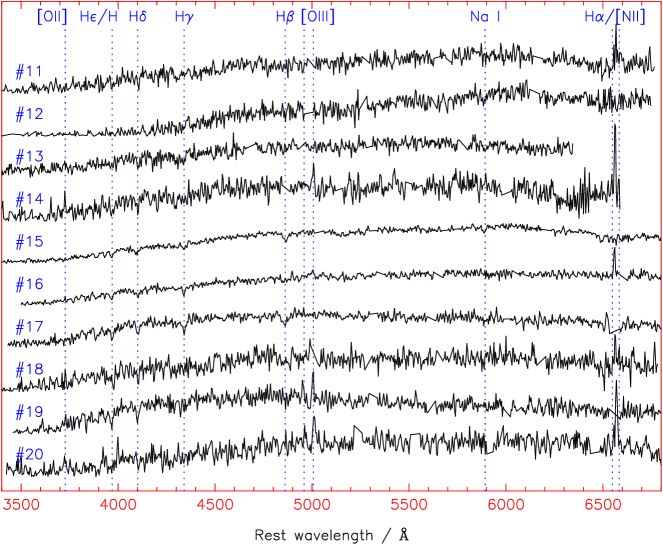
Fig. 3 plots the first ten 2dFGRS spectra from this catalogue. We note that selecting objects by requiring a significant detection of solely H, rather than three Balmer absorption lines, results in more examples of spectra with low median signal-to-noise ratios, in which the measured H equivalent width may be an over-estimate due to noise. Interestingly, a significant fraction of spectra (, , , ) contain H emission indicative of ongoing star formation, even though no measurement of [OII] was possible. We discuss this issue further in Section 2.5.
Unsurprisingly, in the presence of noise, a significantly larger subset of objects results if we stipulate a good measurement of only one Balmer absorption line rather than of three. We consider that the average-Balmer E+A catalogue provides the highest-fidelity selection of ‘true E+A galaxies’. This statement is justified further below. We note that both selection techniques used here are stricter than that of Zabludoff et al. (1996) in terms of the fraction of objects chosen from the parent catalogue. This is due to the different requirements on signal-to-noise ratios in the two analyses.
2.4 Colours
Fig. 4 plots the H equivalent widths of objects in the two E+A galaxy catalogues against their photographic colour. The equivalent widths were re-measured for these samples using the H line-strength index defined by Worthey & Ottaviani (1997) in place of the Gaussian-fitting result, to facilitate a consistent comparison with theoretical models. The and magnitudes of the 2dFGRS galaxies are listed in the publicly-accessible 2dFGRS online database; we used the Supercosmos Sky Survey magnitudes. In generating Fig. 4 we K-corrected these magnitudes to their rest-frame values using the formulae listed in Wild et al. (2004), which produce K-corrections appropriate to each 2dFGRS galaxy’s redshift and colour, and which are accurate to mag in almost all cases (ignoring galaxy evolution):
| (3) |
| (4) |
where and .
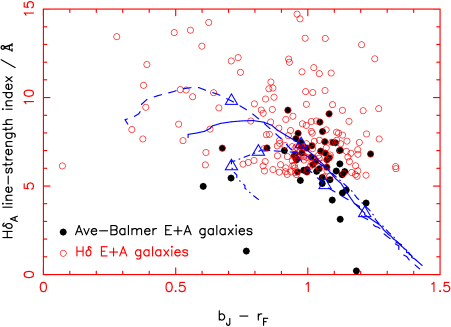
It is interesting to observe in Fig. 4 that despite their starburst origin, not all our E+A galaxies are blue, but rather cover quite a broad range in colour: for both E+A catalogues, the mean value of is within mag of that of the entire 2dFGRS. The reddest E+A galaxies are only mag bluer than a passive E/S0 galaxy []. Indeed their distribution in the [colour, EW(H)]–plane is similar to that of the E+A populations observed in distant clusters (e.g. Couch & Sharples 1987; Dressler et al. 1998), apart from our sample not extending all the way to the E/S0 fiducial colour.
Extensive modelling of this distribution observed for E+A galaxies in distant clusters has shown that it is best reproduced by starburst models, where the galaxies are seen at different times after a substantial but abruptly truncated episode of star formation (Barger et al. 1996; Poggianti et al. 1999). Models of this type have been run for our present sample, and these are represented by the various tracks plotted in Fig. 4. Here we have used the stellar population synthesis models of Bruzual & Charlot (2003). Their code outputs at a series of time-steps the colour and H line-strength index, computed directly from high-resolution model spectra; we transformed the outputted colour into a photographic colour using the equation (Couch 1981):
| (5) |
The results are overplotted in Fig. 4 for various cases of interest. In all models we assumed an exponentially-decaying ‘background’ rate of star formation with e-folding time Gyr (our results do not depend significantly on the value of ). At time Gyr we superimposed a -function starburst creating 10 per cent of the total stellar mass of the model galaxy. The solid line in Fig. 4 tracks the subsequent evolution of this galaxy from Gyr to Gyr. The other two lines plot variations in the model: the dashed line corresponds to the (extreme) assumption that the -function starburst forms 50 per cent of the stellar mass of the galaxy; the dot-dashed line replaces the -function starburst with a ‘flat’ starburst of duration 1 Gyr (creating 10 per cent of the total stellar mass). Invoking a reasonable model of dust extinction within Bruzual & Charlot’s code (Charlot & Fall 2000) reddens the colour of these tracks by mag, using the default dust model parameters.
It is of note that a small number of observed galaxies in Fig. 4 (viz., the reddest E+A galaxies with the strongest H absorption) cannot be accounted for by the model tracks through reasonable variations in the starburst pattern or in the dust model. For example, the reddest average-Balmer E+A galaxy possesses colour and line-strength index (although those line-strength measurements exceeding for some H-selected galaxies have associated errors ranging up to ). This difficulty that the starburst models have in reproducing the colours and H equivalent widths of some ‘red H-strong’ galaxies was first recognised by Couch & Sharples (1987) in their study of distant clusters, and to this day the explanation has remained an unsolved puzzle. The only viable possibilities in this context would seem to be very heavy dust extinction and/or an unusual stellar initial mass function (Shioya, Bekki & Couch 2004).
2.5 Obscured star formation?
In some cases, ongoing star formation in E+A galaxies may be hidden by dust obscuration. Smail et al. (1999) discovered examples of distant cluster galaxies that were classified as E+A objects on the basis of their optical spectra, yet possessed radio fluxes indicative of current massive star formation. However, only 2 out of 15 E+A galaxies in the Zabludoff et al. (1996) sample could be detected in radio continuum measurements (Miller & Owen 2001; the radio continuum luminosity is a tracer of ongoing star formation that is unbiased by dust). Furthermore, just 1 out of 5 of these objects yielded a detection of neutral hydrogen gas via 21 cm emission (Chang et al. 2001; the non-detected systems have upper limits of neutral hydrogen content of ). The presence of neutral hydrogen would indicate the existence of a gas reservoir that may fuel ongoing or future star formation (and the large-scale spatial distribution and kinematics of this gas can encode information about any merger event). This evidence suggests that low-redshift E+A galaxies are predominantly not undergoing dust-enshrouded star formation.
In order to test this assertion further, for each E+A galaxy spectrum in our 2dFGRS samples we inspected the equivalent width of H emission, which is less sensitive to extinction by dust than [OII] emission. For the purpose of this Section, we assume that any H emission is caused by star formation activity, although we note that the presence of an AGN is an alternative explanation and more detailed consideration of spectral line ratios is required to distinguish between these two cases (e.g. Kauffmann et al. 2003). As a second caveat, we note that we are subject to aperture effects owing to the angular diameter of the 2dF spectrograph fibres: we may not be measuring the correct global H equivalent width of the entire galaxy.
Although the 2dFGRS spectra are not flux-calibrated, we can still deduce a star-formation rate from an H equivalent width if we use each galaxy’s magnitude to estimate the continuum flux at about . In detail, we transformed the magnitude to an AB-magnitude using the conversions stated in Cross et al. (2004, equations A12 and A16), where the effective wavelength of the AB magnitude is (Blanton et al. 2003). The expression for the continuum luminosity per unit wavelength is then W (using e.g. Blanton et al. 2003, equation 15) where is the absolute AB magnitude. The H luminosity follows as EW(H), and finally we use a standard conversion to star formation rate, yr (e.g. Sullivan et al. 2001, equation 1).
We considered a galaxy spectrum to have a reliable H measurement if the line possessed a signal-to-noise parameter and a flag parameter . We note that H measurements are only possible for galaxies with redshifts , owing to the poor sensitivity of the 2dF system beyond about (see Figs. 2 and 3).
In the average-Balmer E+A catalogue, of the 37 galaxy spectra with , only three yielded a reliable measurement of H emission, with the highest deduced star-formation rate being yr-1. In strong contrast, of the H-selected sample, 96 of the 166 spectra with contained measurable H emission, although in only 5 cases did the star formation rate exceed yr-1 (with the highest rate being yr-1). We conclude that the average-Balmer method is considerably more effective in selecting a sample with negligible H emission, that has truly ceased star formation (this result is also evident by comparing Figs. 2 and 3). E+A galaxies selected on the basis of H absorption alone show evidence for measurable ongoing star formation in per cent of cases; the [OII] emission presumably being either obscured by dust or present with a low signal-to-noise ratio. The magnitude of the star-formation rates in these objects is not large, being consistent with the pedestrian levels observed in spiral disks. The H and H absorption features are presumably subject to emission-filling and the object is consequently not selected in the average-Balmer catalogue. The H E+A catalogue may thus contain an additional galaxy population: dusty disk galaxies.
We also checked for inclusion of E+A galaxy catalogue members in the list of 2dFGRS radio sources compiled by E.Sadler (priv. comm.) after careful cross-matching of the 2dFGRS catalogue and the GHz NRAO VLA Sky Survey (NVSS) (Sadler et al. 2002). The NVSS is complete to a radio flux-density limit of mJy, corresponding to a radio luminosity W Hz-1 at the typical redshift of a 2dFGRS galaxy, (assuming a power-law radio spectrum ). This level of radio continuum flux density is generated by a star-formation rate of about yr-1 (using the conversion stated in Sullivan et al. 2001, equation 3), therefore the H emission is a probe of lower star formation rates in the present study. In the average-Balmer (or H) E+A catalogue, just 1 out of 56 (2 out of 243) objects was listed as an NVSS radio detection.
3 Morphologies
We inspected Supercosmos Sky Survey (SSS) images of objects in our E+A galaxy catalogues. The SSS has digitized sky survey plates taken with the UK Schmidt telescope, using a pixel size of 0.67 arcseconds. Three different photographic colours are available (approximating B, R and I) and the data were accessed using the website http://www-wfau.roe.ac.uk/sss/pixel.html. An introduction to the SSS is presented by Hambly et al. (2001).
Table 1 displays the results of our visual morphological classification of our E+A galaxy samples, based on inspection of the blue SSS images. All the galaxies in the average-Balmer catalogue were classified, and a comparable number (selected at random) from the H sample were also classified. Galaxies were assigned one of the following broad ‘Hubble’ types: E, E/S0, S0, Spiral (early), Spiral (late), or Irr(egular); unless they were too distant to be sufficiently-well resolved. Any evidence for tidal interactions and mergers (e.g. tidal tails, coalescing pairs, disturbed appearance) was also noted.
As can be seen from Table 1, there is a clear difference in the typical morphologies between these catalogues. Average-Balmer E+A galaxies are predominantly early-type spherodial E/S0 systems. There is evidence of a disk component in some objects, but this contribution is never dominant. In contrast, H-selected E+A galaxies are predominantly late-type spiral galaxies. This result is consistent with our analysis of the star formation rates in Section 2.5: the H E+A catalogue contains an additional population of star-forming disk systems that is not present in the average-Balmer catalogue. In this sense, the latter catalogue provides a higher-fidelity selection of ‘true E+A galaxies’.
| Sample | Number | Number | E | E/S0 | S0 | Spiral | Spiral | Irregular | Strong evidence | Possible evidence |
|---|---|---|---|---|---|---|---|---|---|---|
| inspected | classified | (early) | (late) | for interaction | for interaction | |||||
| Average-Balmer | 56 | 40 | 5 () | 7 () | ||||||
| H | 71 | 57 | 3 () | 4 () |
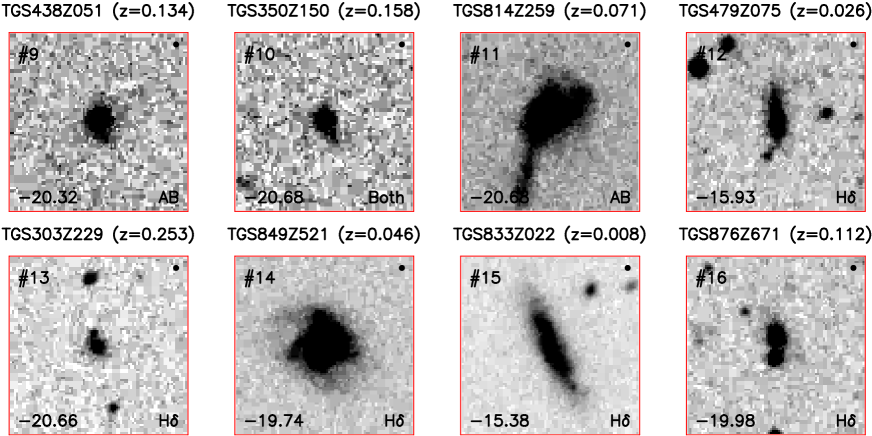
Images of the eight lowest-redshift average-Balmer E+A galaxies are displayed in Fig. 5, using the blue SSS data to match the selection colour of the 2dFGRS. Note that there is no morphological selection imposed for this Figure, only the original spectral selection together with proximity. The plots are labelled with the absolute magnitude of each galaxy: these nearby objects are in all cases fainter than (, Norberg et al. 2002).
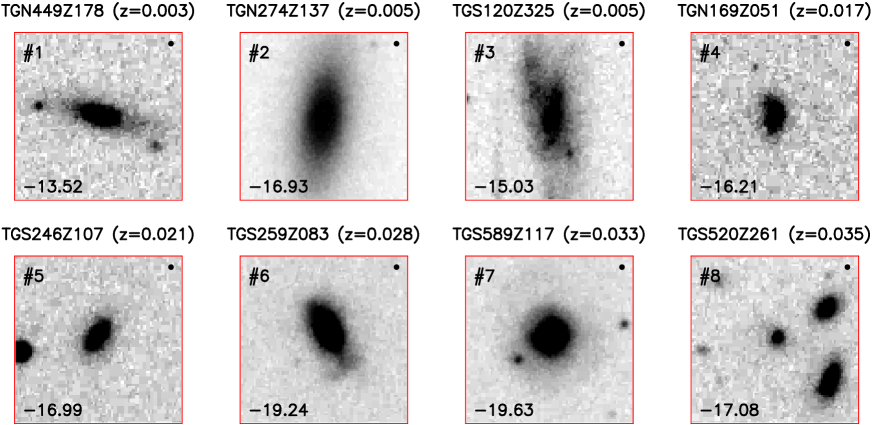
Our visual inspection of the SSS images also revealed that a small but significant number of the E+A galaxies possess disturbed morphologies or tidal features indicative of a late stage of a major merger, in agreement with the findings of Zabludoff et al. (1996). For example, in Fig. 5 we classified images and as providing ‘strong’ evidence for a recent merger, and images , and as ‘possible’ candidates (see the last two columns of Table 1). Fig. 6 displays some other examples of possible mergers or interactions drawn from both catalogues; image features a bright tidal tail extending for a physical distance of kpc. Theoretical modelling has indeed shown that major mergers can produce the characteristic E+A spectrum (Bekki et al. 2001), and space-based high-resolution imaging of E+A galaxies (Yang et al. 2004) has provided further support for this scenario. We note that merger events have a relatively short ‘duty cycle’ ( yr) compared to the timescale of the E+A phase ( yr): we expect morphological evidence for mergers to be rare.
As already indicated, the H-selected E+A galaxies display a wider range of morphologies than the average-Balmer catalogue. We discover plausible merger remnants, but we also identify low-luminosity disk systems which display no evidence of recent or current interactions with other galaxies. Major mergers cannot produce such disk systems: one possible alternative formation mechanism for such an E+A galaxy is a tidal interaction with a companion that passed by Gyr ago. Dwarf galaxies are particularly susceptible to such tidal interactions, which can transform a late-type spiral galaxy into a barred S0 galaxy that still preserves the edge-on appearance of a disk system. The dynamics of the bar drives gas to the centre of the system, triggering a starburst (e.g. Kennicutt 1998); the rapid consumption of this gas naturally produces a characteristic E+A spectrum.
It is important to note that the angular diameter of each fibre of the 2dF spectrograph (2 arcseconds) is significantly smaller than the angular size of most of these galaxies. The E+A galaxy selection is therefore subject to aperture effects: we can only assert that the small portion of the galaxy sampled by the fibre possesses an E+A spectrum. This obviously does not preclude ongoing star formation in other regions of the galaxy. However, a starburst triggered by a major galaxy merger or interaction will typically reside in the centre of the system, where gas is driven by the dynamics: thus such a starburst should co-exist with the highest optical surface brightness, where the spectrograph fibre is usually positioned.
4 Environments
We quantified the local environments of the E+A galaxy samples using a variety of techniques:
4.1 Cross-correlation with the cluster distribution
We first investigated whether our samples of low-redshift E+A galaxies are located predominantly in the field, as found in the seminal study of Zabludoff et al. (1996), or in the proximity of rich clusters. A catalogue of galaxy clusters within the 2dFGRS observed sky areas was compiled by de Propris et al. (2002), sourced from the Abell, APM and Edinburgh-Durham Cluster (EDCC) catalogues. The 2dFGRS was utilized by de Propris et al. to measure precise redshifts, velocity dispersions and centroids for these clusters.
We simply measured the vector separation of each E+A galaxy and the catalogued clusters. Two components of separation were measured: the transverse (i.e. projected) physical distance , where is the radial co-moving distance to the E+A galaxy at redshift and is the angular separation of the galaxy and cluster centroid; and the radial (redshift-space) physical distance , where is the Hubble constant at the E+A galaxy redshift and is the redshift separation of the galaxy and cluster centroid. The radial separation was considered independently because its apparent value can be significantly enhanced by line-of-sight peculiar velocities. An E+A galaxy was considered a ‘cluster’ object if both and , where is the velocity dispersion of the cluster in question, typically km s-1. The selection volume is thus broadened in the radial direction to allow for peculiar velocities. The critical physical scale was taken as 5 Mpc (chosen to exceed comfortably the virial radius of a typical rich cluster).
We restricted our cluster analysis to the SGP region of the galaxy survey; the NGP region is only covered by the Abell catalogue thus the catalogued cluster distribution is much sparser. Using the average-Balmer (or H) E+A catalogue: of 37 (122) galaxies in the SGP region, 4 (20) were classified as cluster objects using the method described above. We conclude that the 2dFGRS E+A galaxies typically lie in the field, outside clusters, in agreement with the findings of Zabludoff et al. (1996).
4.2 Cross-correlation with remaining 2dFGRS galaxies
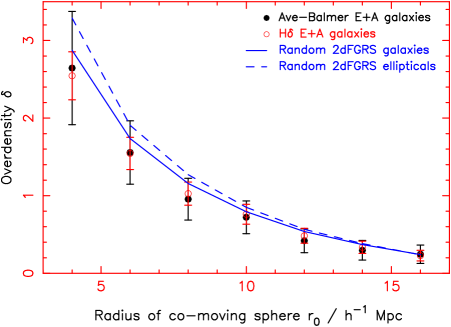
As a second means of quantifying the environments of the E+A galaxy samples, we counted the number of objects in the 2dFGRS within a co-moving radius Mpc of each E+A galaxy, making no attempt to correct for peculiar velocities. By integrating the measured 2dFGRS -band luminosity function (Norberg et al. 2002) to the survey apparent magnitude limit, we can determine the average number of objects expected within this sphere at any given redshift (in the absence of clustering) and hence obtain a local overdensity (e.g. on a scale Mpc) for each E+A galaxy. We then compared the average local overdensity of E+A galaxies with that of a sample of randomly-drawn 2dFGRS objects, for which we applied an identical technique.
Using the average-Balmer (or H) E+A catalogue, the average overdensity within a sphere of co-moving radius Mpc centred on an E+A galaxy was (). The quoted error was derived as the error in the mean of the overdensity distribution, , where is the standard deviation of the distribution and is the number of E+A galaxies in the sample. Measuring the average overdensity of 10000 randomly-drawn 2dFGRS catalogue members by an identical method yielded (with a negligible error).
Motivated by the spheroidal morphologies of many of the average-Balmer E+A galaxies (Section 3), we also defined a ‘control sample’ of 2dFGRS ‘elliptical’ galaxies. These were selected based on the classification system developed for 2dFGRS spectra using principal-component analysis (Madgwick et al. 2002). This procedure assigns a parameter to each spectrum based upon the strength of nebular emission; the value of this continuous variable turns out to correlate relatively well with the galaxy -band morphology (Madgwick 2003). Following Magdwick et al. (2002) we define a ‘relatively quiescent’ (i.e. early-type) sub-sample by the cut . We found that the average overdensity of 10000 2dFGRS ‘ellipticals’, selected in this manner, to be .
We repeated this analysis for other co-moving radii (Fig. 7), finding that on all scales the mean overdensity at the locations of the E+A galaxies is statistically consistent with the ensemble of 2dFGRS galaxies. This result is in agreement with the findings of Quintero et al. (2004) based on SDSS spectra containing an excess signature of A stars relative to K stars. Furthermore, the overdensity pattern around elliptical galaxies is not favoured as a description of E+A galaxy environments, even though many average-Balmer E+A systems possess spheroidal morphologies. As illustrated by Fig. 7, we recover the well-known result that elliptical galaxies inhabit denser local environments than the ensemble of galaxies.
4.3 Cross-correlation with 2dFGRS galaxy groups catalogue
Eke et al. (2004a) have constructed a catalogue of galaxy groups from the 2dFGRS, by means of a friends-of-friends percolation algorithm. The data are publicly available online at http://www.mso.anu.edu.au/2dFGRS/Public/2PIGG/ and consist of two tables. For each 2dFGRS galaxy, the first table lists the group ID or a flag indicating that the galaxy was ungrouped. For each group, the second table records the number of group members and details such as the projected linear size and velocity dispersion of the group.
For each galaxy in our E+A catalogues, we first considered the number of members of the group in which that galaxy resides. The distributions of group membership numbers for E+A galaxies and for randomly-drawn 2dFGRS galaxies were statistically consistent. As such, approximately 50 per cent of our E+A galaxies are isolated, not linked to any companion by the percolation algorithm.
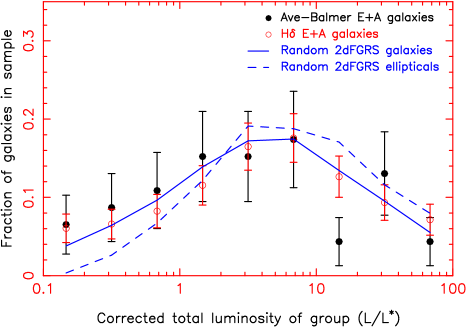
However, group membership is a poor indicator of group size: massive groups can have low membership simply because they are at high redshift. A better quantity to consider is the corrected total luminosity of the group (see Eke et al. 2004b). This is the summed, weighted luminosities of the galaxies in the group, divided by an incompleteness factor compensating for those galaxies falling beneath the apparent magnitude threshold at the group redshift. Fig. 8 plots the distribution of these group luminosities for the E+A catalogues. We overplot the results of an identical analysis for samples of randomly-drawn 2dFGRS galaxies and ellipticals: the latter inhabit preferentially more luminous groups. We find no evidence that E+A galaxies inhabit groups of a different nature to the overall galaxy population. Furthermore, the groups containing E+A galaxies appear dissimilar to those hosting elliptical galaxies; the elliptical model is rejected by the average-Balmer (or H) data with a confidence of (), based on the value of the chi-squared statistic.
4.4 Cross-correlation with Supercosmos Sky Survey catalogues
As a final method of investigating the environment of 2dFGRS E+A galaxies, we obtained the Supercosmos Sky Survey (SSS) photometric catalogues for the regions surrounding each E+A galaxy. The approximate magnitude limits of the photographic plates which are scanned to produce the SSS are and . We downloaded SSS object catalogues using the web interface http://www-wfau.roe.ac.uk/sss/obj_batch_email.html specifying a circular extraction with radius 5 arcmin.
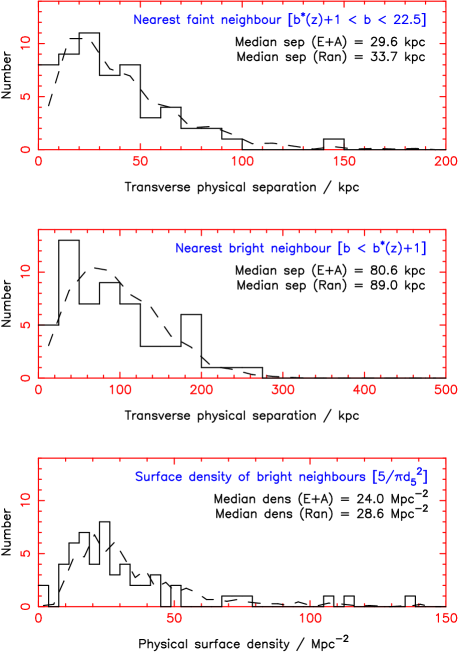
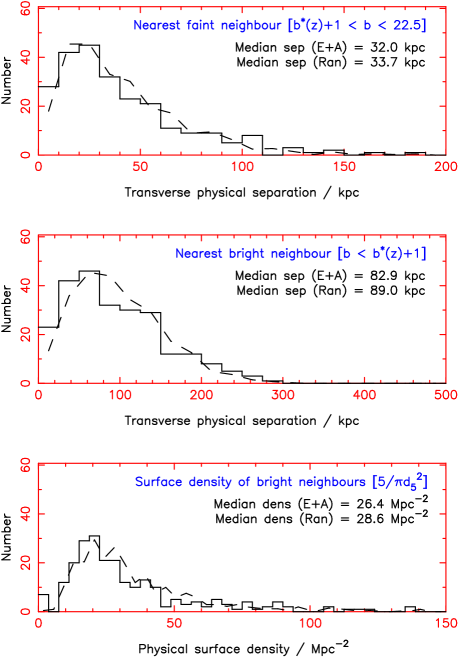
Using the 2dFGRS -band luminosity function (Norberg et al. 2002), we can deduce the apparent magnitude corresponding to an absolute magnitude at the redshift of a sample E+A galaxy. We then define a ‘bright neighbour’ as a nearby SSS galaxy with . We define a ‘faint neighbour’ as a nearby SSS galaxy with . The presence of a nearby ‘bright’ or ‘faint’ neighbour may indicate, respectively, an imminent major or minor merger.
Using the known E+A galaxy redshift we can convert angular separations into transverse physical separations. For each E+A galaxy we derived:
-
•
The transverse physical separation (in kpc) of the nearest faint neighbour.
-
•
The transverse physical separation (in kpc) of the nearest bright neighbour.
-
•
The physical surface density (in Mpc-2) defined by the five nearest bright neighbours (, where is the transverse physical separation of the fifth nearest bright neighbour).
Note that each of these quantities is insensitive to the effects of peculiar velocities. We compared these statistics to those determined for a sample of 1000 randomly-drawn 2dFGRS galaxies (restricted to redshifts to eliminate stellar contamination). The results for the two E+A galaxy catalogues are displayed in Figs. 9 and 10, with the results for the random sample overplotted in each case.
We used the Kolmogorov-Smirnov (K-S) statistical test to ascertain whether the local environments of the E+A galaxy samples were drawn from a different parent distribution to the local environments of the random 2dFGRS sample. Let be the probability that the K-S statistic could exceed the observed value by random chance, if the two distributions were drawn from the same parent distribution. The values of for the distributions of nearest faint neighbour, nearest bright neighbour and local surface density, for the average-Balmer (H) E+A catalogue, were (), () and (). We conclude that there is no significant evidence that the distribution of E+A galaxy local environments is different from that of the 2dFGRS sample as a whole.
5 Clustering properties
We quantified the clustering properties of 2dFGRS E+A galaxies using a spatial correlation function analysis. Such an analysis yields information about the bias of these galaxies with respect to the underlying matter density field, which we can compare to the bias of other classes of galaxy. In the approximation that E+A galaxies possess a linear bias , their spatial auto-correlation function as a function of spatial separation takes the form
| (6) |
where is the spatial auto-correlation function of the underlying matter density field.
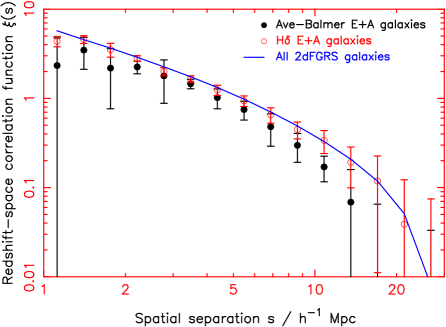
As our samples contain insufficient E+A galaxies to perform an auto-correlation function analysis (there is only one pair of objects in the average-Balmer catalogue with a redshift-space separation less than Mpc), we instead determined the cross-correlation function of the E+A galaxy samples with the rest of the 2dFGRS catalogue. In the approximation of linear bias,
| (7) |
where is the bias factor for an average 2dFGRS galaxy. If we additionally measure the spatial auto-correlation function of 2dFGRS galaxies, , we can estimate the relative bias of E+A galaxies as
| (8) |
We measured all correlation functions in redshift space, making no attempt to correct for peculiar velocities. The cross-correlation function is measured by comparing the cross-pair counts of the E+A sample with, respectively, the full 2dFGRS catalogue (containing galaxies) and a random distribution of points possessing the same selection function as the full catalogue. The random distributions were generated using the publicly-available 2dFGRS mask software written by Peder Norberg and Shaun Cole (see http://msowww.anu.edu.au/2dFGRS/). Denoting these respective cross-pair counts as and , with denoting a redshift-space separation, we used the standard estimator for the cross-correlation function :
| (9) |
When determining the auto-correlation function of 2dFGRS galaxies for comparison, we used the standard estimator equivalent to equation 9:
| (10) |
The extra factor of in equation 10 arises because is a auto-pair count rather than a cross-pair count (thus contains half the number of unique pairs).
We included the 2dFGRS NGP and SGP regions, but not the random fields, in our clustering analysis. The total numbers of galaxies analyzed were 50, 201 and 195188 for the average-Balmer catalogue, the H catalogue and the entire 2dFGRS, respectively. The results are displayed in Fig. 11. Poisson error bars are often assigned to correlation function measurements, but these are known to underestimate the true variance of the estimators of equations 9 and 10 by a significant factor (e.g. Landy & Szalay 1993). Instead, we estimated a realistic statistical variance using the ‘jack-knife’ approach. We divided both the NGP and SGP strips into four quadrants and repeated the correlation function estimation 8 times, keeping 7 quadrants; the error for each separation bin is then estimated by multiplying by the resulting standard deviation across the eight sub-samples.
The correlation function estimate for the H sample agrees well with that for the entire 2dFGRS (implying ) but there is evidence that the average-Balmer catalogue is somewhat less clustered. Considering the small size of this sample (50 objects) and the strong statistical correlation between neighbouring bins of the estimator, we consider this result to be tentative. On scales where , systematic errors probably dominate the uncertainities in the correlation functions. In particular, there is a well-known systematic effect (the ‘integral constraint’) caused by the uncertainty in estimating the mean density of the galaxy sample. This effect distorts the measured values of systematically downwards on large scales (in a similar way for all jack-knife re-samples).
6 Luminosity function
The distribution of luminosities of E+A galaxies may encode information about the physical mechanisms responsible for their formation. If, for example, E+A galaxies possess below-average luminosities, then they would be more susceptible to tidal interactions, which would then be implicated as a formation mechanism.
We determined the -band luminosity function, , of the two samples of E+A galaxies using the step-wise maximum likelihood (SWML) method (Efstathiou, Ellis & Peterson 1988). We also measured the -band luminosity function of the full 2dFGRS catalogue and the ellipticals sample (see Section 4), using an identical method. In order to limit the effects of incompletenesses, we restricted our analysis to the apparent magnitude range . The total numbers of galaxies analyzed were respectively 53, 174, 166243 and 60640 for the average-Balmer catalogue, the H catalogue, the entire 2dFGRS and the ellipticals sample. When evaluating the luminosity function we used the Supercosmos Sky Survey magnitudes, together with the K-correction described in Section 2.4 combined with an ‘E-correction’ for the luminosity evolution of an average 2dFGRS galaxy (Norberg et al. 2002). The fractional error in the measurement of in each luminosity band is taken as a Poisson error , where is the number of objects falling in that band.
The SWML estimator is unnormalized; we normalized each luminosity function to an equivalent source surface density which we fixed as follows. In the absolute magnitude interval the 2dFGRS luminosity function is accurately described by a Schechter function with parameters , and Mpc-3 (Norberg et al. 2002). We obtained a normalization deg-2 by integrating this Schechter function over the redshift interval and the apparent magnitude interval . By applying a consistent normalization in this manner, we are able to investigate any difference of shape between the luminosity functions for the 2dFGRS and for the E+A galaxy samples. The results are displayed in Fig. 12.
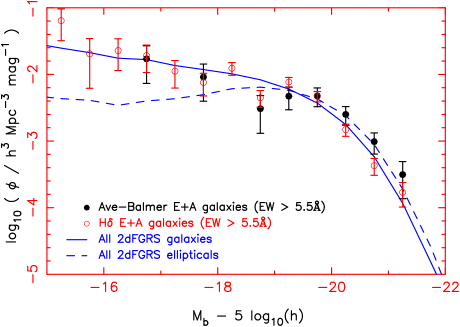
At brighter luminosities (), Fig. 12 hints that the average-Balmer sample may possess a luminosity distribution more consistent with that of elliptical galaxies than average 2dFGRS galaxies (although formally, the luminosity functions of both E+A catalogues are statistically consistent with the whole 2dFGRS database; the chi-squared probabilities in the two cases are and , considering bins containing objects). Investigating further, we lowered the absorption equivalent width threshold for E+A catalogue selection from to , in order to create larger samples. The luminosity functions of these extended catalogues are displayed in Fig. 13. The luminosity distribution of the average-Balmer E+A galaxies is now inconsistent with that of the overall 2dFGRS catalogue (with significance ) and consistent with the luminosity function of ellipticals (the chi-squared probability is ). The result for the H-selected sample remains consistent with that for the ensemble of 2dFGRS galaxies. This finding seems very reasonable given the morphological distributions determined in Section 3: the average-Balmer catalogue is dominated by spheroidal galaxies, whereas the H sample contains a significant admixture of disk galaxies.
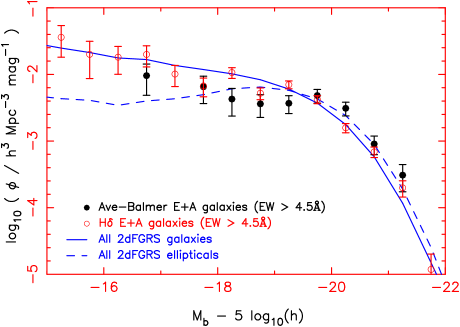
We conclude that the distribution of luminosities of H-selected galaxies is consistent with the entire 2dFGRS population, but there is evidence to suggest that the luminosity function of the average-Balmer sample better matches that of (spectroscopically-defined) ‘elliptical’ galaxies.
7 Discussion
We have selected samples of low-redshift E+A galaxies from 161000 high-quality spectra in the 2dFGRS, constituting a large-scale environmentally-unbiased study of E+A systems in the local Universe. We used two different selection techniques: the first utilizing three Balmer absorption lines (H, H, H) together with the [OII] feature, and the second technique employing solely the H and [OII] lines. These methods resulted in the selection of 56 and 243 galaxies, respectively.
We inspected the morphologies of the E+A galaxies using images drawn from the Supercosmos Sky Survey (SSS), finding that:
-
•
The largest sub-population of ‘average-Balmer’ E+A galaxies is E/S0 systems. There are no disk-dominated galaxies. In contrast, the largest sub-sample of H-selected objects is late-type spirals.
-
•
In a small but significant number of cases, the SSS images reveal evidence of recent major galaxy mergers, such as disturbed morphologies, coalescing disks and tidal tails or envelopes. We detect a notable (50 kpc) tidal tail associated with one object.
-
•
Further study (i.e. spatially-resolved spectroscopy) is necessary to establish the influence of aperture effects due to the angular diameter of the 2dF spectrograph fibres being significantly smaller than the angular size of most of the galaxies.
The individual catalogues resulting from the two E+A selection techniques contain a different distribution of galaxy populations. Less than of average-Balmer E+A galaxies yield any detection of H emission, with the highest deduced star-formation rate being yr-1. In contrast, of spectra selected by strong H absorption (and no [OII] emission) contain a measurable H line (although only rarely does the inferred star-formation rate exceed yr-1).
These samples permitted a statistical investigation of the environments and luminosities of low-redshift E+A galaxies. We compared the two E+A catalogues to both the entire 2dFGRS database and a sub-population of 2dFGRS ‘ellipticals’, the latter selected using the spectral classification parameter . With regard to the environments of E+A galaxies, we found that:
-
•
E+A galaxies at low redshift lie predominantly in the field rather than in clusters, in agreement with the analysis of Zabludoff et al. (1996).
-
•
Cross-matching E+A galaxies with the 2dFGRS galaxy groups catalogue of Eke et al. (2004), we determined that the distribution of membership and luminosity of the groups in which E+A systems reside was consistent with that of the overall galaxy population. In particular, approximately 50 per cent of E+A objects are classified as isolated galaxies. The distribution of groups containing E+A systems is dissimilar to those hosting elliptical galaxies.
-
•
Nearest-neighbour and correlation-function analyses confirmed the conclusion that the local environments of E+A galaxies are consistent with those of the ensemble of 2dFGRS galaxies.
-
•
These conclusions hold true for both E+A galaxy catalogues.
Concerning the luminosity function of E+A galaxies:
-
•
Average-Balmer E+A galaxies possess a luminosity distribution matching that of elliptical galaxies, and disagreeing with the overall 2dFGRS luminosity function (although this result only became statistically significant when the equivalent width selection threshold was reduced from to ).
-
•
The luminosity distribution of H E+A galaxies matches that of the full 2dFGRS population.
What can we conclude from these results? Considering first the average-Balmer E+A catalogue: the preference for spheroidal morphologies, the incidence of identifiable merger remnants, and the match of the luminosity distribution to that of elliptical galaxies is all consistent with major galaxy mergers being an important formation process for these galaxies. Indeed, this model has proven successful in theoretical simulations (Bekki et al. 2001). Thus it is interesting that the distribution of local environments of these E+A systems matches that of the ensemble of galaxies; for example, there is no correlation with the properties of galaxy groups. This in part reflects the fact that at low redshift the merger probability is enhanced in the field with respect to clusters. Elliptical galaxies forming today do not follow the classic morphology-density relation, because the relative velocities of galaxies in denser environments is too high to permit mergers: cluster sub-structure has become dynamically relaxed.
The impressive manner in which the distribution of local environments of E+A systems traces that of the ensemble of 2dFGRS galaxies implies that the E+A galaxy formation mechanism is driven by very local encounters, without reference to the wider group environment. Theoretical simulations indicate that an E+A spectrum marks a late stage of a merger, when the cores of the merging systems have coalesced and the merging companion is no longer identifiable (Bekki et al. 2001): we would not expect a surplus of close companions. Furthermore, we note a consistency of our findings with the dependence of star formation upon environment (e.g. Balogh et al. 2004). In such studies, the only environmentally-selected population at low redshift to show enhancements of star formation are close galaxy pairs, which are no longer distinguishable at the onset of the E+A phase.
Turning now to galaxies selected by H absorption alone: the greater incidence of disk-like morphologies and detectable H emission demonstrates that star formation is still ongoing in many of these objects, albeit at a relatively low level ( yr-1). Such systems therefore cannot be considered ‘true E+A galaxies’. In these cases, [OII] emission may either be suppressed by dust obscuration or present with a low signal-to-noise ratio, and the H and H absorption features are presumably subject to emission-filling.
Our E+A galaxy catalogues represent a useful database for follow-up studies. In particular, spatially-resolved spectroscopy is a critical probe of the formation mechanism (e.g. Norton et al. 2001), mapping the kinematics of the stellar populations and the star-formation history of the galaxies as a function of position. In addition, high-resolution optical imaging can define the morphologies with greater fidelity, and imaging in 21 cm neutral hydrogen emission yields the large-scale distribution and kinematics of remaining gas, encoding information about any merger event.
Acknowledgments
We thank Elaine Sadler for useful conversations about this work. CB, WJC and KB acknowledge the financial support of the Australian Research Council throughout the course of this work. MBP was supported by an Australian Postgraduate Award.
References
- [1] Balogh M. et al. 2004, MNRAS, 348, 1355
- [2] Barger A.J., Aragon-Salamanca A., Ellis R.S., Couch W.J., Smail I., Sharples R.M., 1996, MNRAS, 279, 1
- [3] Bekki K., Shioya Y., Couch W.J., 2001, ApJL, 547, 17
- [4] Blanton M.R. et al., 2003, ApJ, 592, 819
- [5] Bruzual G., Charlot S., 2003, MNRAS, 344, 1000
- [6] Chang T.-C., van Gorkom J.H., Zabludoff A.I., Zaritsky D., Mihos J.C., 2001, ApJ, 121, 1965
- [7] Charlot S., Fall M.S., 2000, ApJ, 539, 718
- [8] Colless M. et al., 2001, MNRAS, 328, 1039
- [9] Colless M. et al., 2003, astro-ph/0306581
- [10] Couch W.J., 1981, PhD thesis, Australian National University
- [11] Couch W.J., Sharples R.M., 1987, MNRAS, 229, 423
- [12] Couch W.J., Barger A.J., Smail I., Ellis R.S., Sharples R.M., 1998, ApJ, 497, 188
- [13] Cross N.J.G., Driver S.P., Liske J., Lemon D.J., Peacock J.A., Cole S., Norberg P., Sutherland W.J., 2004, MNRAS, 349, 576
- [14] De Propris R. et al., 2002, MNRAS, 2002, 329, 87
- [15] Dressler A., Gunn J.E., 1983, ApJ, 270, 7
- [16] Dressler A., Smail I., Poggianti B.M., Butcher H., Couch W.J., Ellis R.S., Oemler A. Jr., 1999, ApJS, 122, 51
- [17] Eke V.R. et al., 2004a, MNRAS, 348, 866
- [18] Eke V.R. et al., 2004b, MNRAS submitted (astro-ph/0402566)
- [19] Efstathiou G., Ellis R.S., Peterson B.A., 1988, MNRAS, 232, 431
- [20] Fabricant D.G., McClintock J.E., Bautz M.W., 1991, ApJ, 381, 33
- [21] Goto T. et al., 2003, PASJ, 55, 771
- [22] Hambly N.C. et al., 2001, MNRAS, 326, 1279
- [23] Kauffmann G. et al., 2003, MNRAS, 346, 1055
- [24] Kennicutt R.C., 1998, ARA&A, 36, 189
- [25] Landy S.D., Szalay A.S., 1993, ApJ, 412, 64
- [26] Lewis I. et al., 2002, MNRAS, 334, 673
- [27] Madgwick D.S., 2003, MNRAS, 338, 197
- [28] Madgwick D.S. et al., 2002, MNRAS, 333, 133
- [29] Miller N.A., Owen F.N., 2001, ApJL, 554, 25
- [30] Norberg P. et al., 2002, MNRAS, 336, 907
- [31] Norton S.A., Gebhardt K., Zabludoff A.I., Zaritsky D., 2001, ApJ, 557, 150
- [32] Poggianti B.M., Smail I., Dressler A., Couch W.J., Barger A.J., Butcher H., Ellis R.S., Oemler A., 1999, ApJ, 518, 576
- [33] Quintero A.D. et al., 2004, ApJ, 602, 190
- [34] Sadler E.M. et al., 2002, MNRAS, 329, 227
- [35] Shioya Y., Bekki K., Couch W.J., 2004, ApJ, 601, 805
- [36] Smail I., Morrison G., Gray M.E., Owen F.N., Ivison R.J., Kneib J.-P7, Ellis R.S., 1999, ApJ, 525, 609
- [37] Sullivan M., Mobasher B., Chan B., Cram L., Ellis R., Treyer M., Hopkins A., 2001, ApJ, 558, 7
- [38] Tran K.H., Franx M., Illingworth G., Kelson D.D., van Dokkum P., 2003, ApJ, 599, 865
- [39] Wild V. et al., 2004, MNRAS submitted (astro-ph/0404275)
- [40] Worthey G., Ottaviani D.L., 1997, ApJS, 111, 377
- [41] Yang Y., Zabludoff A.I., Zaritsky D., Lauer T.R., Mihos J.C., 2004, ApJ, 607, 258
- [42] Zabludoff A.I., Zaritsky D., Lin H., Tucker D., Hashimoto Y., Shectman S.A., Oemler A., Kirshner R.P., 1996, ApJ, 466, 104
| Serial No. | Name | (J2000) | (J2000) | H | H | H | ||||
|---|---|---|---|---|---|---|---|---|---|---|
| 218 | TGS495Z048 | 0 11 22.88 | -33 25 3.3 | 0.100 | 18.53 | 17.24 | -19.29 | -5.33 | -5.64 | -5.93 |
| 1232 | TGS431Z066 | 23 55 41.83 | -32 21 32.7 | 0.156 | 19.19 | 17.92 | -19.81 | -5.35 | -4.28 | -6.42 |
| 6549 | TGS439Z075 | 0 29 10.97 | -32 42 34.2 | 0.108 | 17.89 | 16.61 | -20.12 | -7.65 | -5.43 | -7.53 |
| 6833 | TGS438Z051 | 0 25 14.18 | -32 15 1.8 | 0.134 | 18.35 | 16.90 | -20.32 | -1.37 | -1.66 | -12.75 |
| 7402 | TGS497Z208 | 0 18 29.19 | -33 34 55.3 | 0.049 | 18.94 | 18.30 | -16.98 | -7.70 | -6.17 | -6.43 |
| 8648 | TGS555Z002 | 0 24 11.03 | -34 54 52.1 | 0.240 | 18.87 | 17.49 | -21.39 | -5.47 | -5.72 | -4.92 |
| 11882 | TGS502Z221 | 0 51 31.48 | -32 48 50.5 | 0.111 | 17.75 | 16.51 | -20.33 | -5.01 | -4.41 | -6.64 |
| 30347 | TGS519Z127 | 2 35 47.21 | -33 35 15.6 | 0.078 | 18.52 | 17.36 | -18.63 | -6.05 | -5.21 | -6.38 |
| 30561 | TGS519Z227 | 2 33 10.60 | -33 52 24.4 | 0.070 | 17.64 | 16.30 | -19.30 | -6.21 | -7.10 | -6.34 |
| 32941 | TGS574Z157 | 2 18 17.27 | -35 27 27.7 | 0.223 | 18.99 | 17.80 | -20.93 | -5.24 | -5.11 | -6.22 |
| 35418 | TGS520Z261 | 2 40 24.27 | -33 25 50.6 | 0.035 | 18.17 | 17.15 | -17.08 | -6.34 | -6.68 | -5.41 |
| 46013 | TGS480Z208 | 22 18 22.99 | -33 2 36.7 | 0.101 | 18.28 | 17.01 | -19.56 | -3.82 | -4.95 | -7.08 |
| 48663 | TGS589Z117 | 22 22 52.22 | -36 57 1.3 | 0.033 | 15.46 | 14.48 | -19.63 | -7.44 | -8.47 | -7.69 |
| 55742 | TGS541Z024 | 23 25 58.09 | -33 56 59.9 | 0.063 | 18.60 | 17.51 | -18.00 | -5.93 | -4.62 | -5.98 |
| 56491 | TGS539Z123 | 23 15 25.13 | -35 12 59.1 | 0.196 | 18.39 | 17.09 | -21.25 | -6.69 | -6.80 | -6.39 |
| 63733 | TGS278Z037 | 0 11 9.90 | -28 47 40.0 | 0.070 | 19.26 | 18.51 | -17.50 | -6.34 | -5.78 | -5.62 |
| 66097 | TGS359Z193 | 0 4 13.85 | -30 19 49.9 | 0.221 | 18.91 | 17.51 | -21.13 | -6.62 | -6.04 | -7.01 |
| 66348 | TGS358Z179 | 23 59 29.87 | -30 16 21.9 | 0.120 | 18.06 | 16.73 | -20.25 | -5.41 | -5.80 | -6.03 |
| 72301 | TGS438Z207 | 0 25 1.82 | -31 1 21.1 | 0.128 | 18.92 | 17.58 | -19.58 | -3.71 | -5.77 | -5.93 |
| 77063 | TGS444Z180 | 0 55 49.58 | -31 47 44.9 | 0.179 | 19.01 | 17.52 | -20.51 | -5.17 | -5.72 | -5.70 |
| 78421 | TGS294Z049 | 1 14 55.37 | -28 55 52.1 | 0.186 | 19.16 | 17.78 | -20.39 | -8.18 | -7.98 | -7.30 |
| 80795 | TGS373Z107 | 1 5 41.72 | -29 36 55.2 | 0.195 | 18.55 | 17.14 | -21.15 | -7.72 | -6.73 | -5.35 |
| 91037 | TGS231Z063 | 2 29 44.49 | -27 54 59.4 | 0.198 | 19.01 | 17.78 | -20.61 | -7.17 | -7.00 | -7.99 |
| 93583 | TGS387Z032 | 2 15 40.52 | -30 50 54.5 | 0.092 | 17.69 | 16.53 | -19.88 | -6.99 | -5.13 | -6.02 |
| 98002 | TGS464Z179 | 2 36 17.68 | -31 31 36.8 | 0.165 | 18.93 | 17.74 | -20.18 | -6.26 | -6.08 | -6.75 |
| 103972 | TGS402Z315 | 3 31 7.88 | -30 35 54.0 | 0.066 | 18.98 | 17.67 | -17.78 | -4.40 | -4.19 | -7.10 |
| 104025 | TGS322Z289 | 3 30 32.41 | -29 18 48.8 | 0.120 | 18.32 | 17.03 | -19.98 | -6.84 | -7.49 | -7.56 |
| 108920 | TGS246Z107 | 21 46 15.20 | -29 43 43.9 | 0.021 | 17.06 | 16.08 | -16.99 | -7.09 | -5.74 | -5.32 |
| 115650 | TGS259Z083 | 22 42 28.76 | -28 35 4.5 | 0.028 | 15.51 | 14.52 | -19.24 | -6.50 | -7.03 | -6.01 |
| 116268 | TGS343Z007 | 22 50 58.49 | -30 17 32.4 | 0.202 | 18.71 | 17.36 | -21.04 | -5.86 | -5.90 | -4.99 |
| 118891 | TGS266Z090 | 23 10 46.57 | -28 31 49.7 | 0.088 | 17.73 | 16.57 | -19.71 | -6.04 | -5.50 | -5.34 |
| 124944 | TGS350Z150 | 23 26 36.76 | -30 19 27.4 | 0.158 | 18.37 | 17.07 | -20.68 | -6.18 | -6.15 | -5.95 |
| 127591 | TGS195Z088 | 23 48 21.17 | -27 57 32.5 | 0.177 | 19.23 | 17.79 | -20.22 | -7.74 | -6.12 | -3.37 |
| 129207 | TGS271Z130 | 23 41 8.90 | -28 55 25.4 | 0.082 | 18.30 | 17.08 | -18.99 | -4.96 | -4.88 | -6.88 |
| 164029 | TGS109Z228 | 3 4 49.78 | -24 57 57.1 | 0.191 | 19.31 | 18.15 | -20.17 | -8.96 | -6.48 | -5.53 |
| 182340 | TGS120Z302 | 22 37 37.03 | -25 50 57.6 | 0.235 | 18.45 | 17.39 | -21.50 | -6.26 | -6.37 | -5.66 |
| 182382 | TGS120Z325 | 22 36 6.92 | -26 18 52.9 | 0.005 | 15.78 | 14.69 | -15.03 | -9.38 | -7.73 | -6.94 |
| 194184 | TGN154Z163 | 10 4 24.87 | -4 25 27.0 | 0.129 | 18.27 | 17.05 | -20.19 | -5.61 | -6.18 | -5.64 |
| 208265 | TGN224Z107 | 10 33 31.22 | -3 20 36.0 | 0.098 | 18.55 | 17.47 | -19.13 | -6.18 | -5.88 | -5.74 |
| 215246 | TGN169Z023 | 11 25 26.17 | -4 32 36.8 | 0.082 | 17.92 | 16.76 | -19.34 | -6.53 | -5.07 | -6.31 |
| 215346 | TGN169Z051 | 11 24 55.68 | -3 47 35.7 | 0.017 | 17.43 | 16.73 | -16.21 | -4.56 | -5.04 | -6.50 |
| 241469 | TGN192Z151 | 13 0 16.53 | -2 54 33.3 | 0.102 | 18.73 | 17.69 | -19.03 | -6.28 | -5.57 | -5.44 |
| 280809 | TGN369Z015 | 11 11 8.13 | +0 40 48.5 | 0.185 | 18.53 | 17.33 | -20.88 | -7.44 | -6.65 | -8.51 |
| 287603 | TGN441Z175 | 11 23 6.13 | +2 2 54.8 | 0.138 | 18.15 | 17.01 | -20.45 | -4.40 | -6.49 | -5.12 |
| 290290 | TGN303Z261 | 11 13 27.92 | -0 54 10.2 | 0.041 | 17.92 | 16.88 | -17.65 | -5.57 | -4.52 | -5.88 |
| 290537 | TGN312Z001 | 11 52 25.52 | -1 16 3.3 | 0.061 | 17.97 | 16.85 | -18.55 | -5.89 | -5.42 | -6.18 |
| 294450 | TGN444Z229 | 11 33 49.63 | +2 5 14.3 | 0.178 | 18.50 | 17.31 | -20.80 | -6.46 | -5.30 | -5.77 |
| 296025 | TGN449Z178 | 11 57 35.34 | +2 10 3.7 | 0.003 | 16.46 | 15.86 | -13.52 | -5.32 | -6.44 | -5.52 |
| 321635 | TGN341Z170 | 14 9 43.20 | -0 0 37.4 | 0.135 | 18.42 | 17.31 | -20.09 | -5.12 | -5.73 | -5.35 |
| 321865 | TGN274Z137 | 14 8 43.29 | -1 9 41.3 | 0.005 | 14.10 | 13.06 | -16.93 | -5.58 | -6.29 | -6.62 |
| 326479 | TGN345Z098 | 14 30 55.85 | +0 4 51.0 | 0.118 | 18.49 | 17.20 | -19.78 | -4.62 | -6.06 | -6.45 |
| 337194 | TGS867Z380 | 0 27 2.39 | -16 46 31.2 | 0.069 | 16.80 | 15.82 | -19.98 | -6.18 | -6.84 | -6.92 |
| 340630 | TGS842Z058 | 1 9 24.18 | -7 37 5.1 | 0.092 | 19.17 | 17.90 | -18.42 | -3.12 | -9.57 | -4.50 |
| 350576 | TGS814Z259 | 2 18 38.37 | -45 4 44.7 | 0.071 | 16.22 | 15.07 | -20.68 | -4.04 | -4.98 | -6.53 |
| 360494 | TGS848Z072 | 4 0 56.87 | -35 57 14.1 | 0.167 | 18.78 | 17.62 | -20.34 | -6.42 | -5.85 | -6.02 |
| 386788 | TGS811Z409 | 23 32 35.56 | -41 40 49.7 | 0.227 | 19.06 | 17.56 | -21.14 | -5.24 | -6.37 | -4.98 |