Radio observations of a few giant sources
Abstract
We present multifrequency observations with the Giant Metrewave Radio Telescope (GMRT) and the Very Large Array (VLA) of a sample of seventeen largely giant radio sources (GRSs). These observations have either helped clarify the radio structures or provided new information at a different frequency. The broad line radio galaxy, J0313+413, has an asymmetric, curved radio jet and a variable radio core, consistent with a moderate angle of inclination to the line of sight. We attempt to identify steep spectrum radio cores (SSCs), which may be a sign of recurrent activity, and find four candidates. If confirmed, this would indicate a trend for SSCs to occur preferentially in GRSs. From the structure and integrated spectra of the sources, we suggest that the lobes of emission in J0139+399 and J0200+408 may be due to an earlier cycle of nuclear activity. We find that inverse-Compton losses with the cosmic microwave background radiation dominate over synchrotron radiative losses in the lobes of all the sources, consistent with earlier studies. We also show that the prominence of the bridge emission decreases with increasing redshift, possibly due to inverse-Compton losses. This could affect the appearance and identification of GRSs at large redshifts.
keywords:
galaxies: active – galaxies: jets – galaxies: nuclei – quasars: general – radio continuum: galaxies1 Introduction
Giant radio sources (GRSs), defined to be those with a projected linear size 1 Mpc (Ho=71 km s-1 Mpc-1, =0.27, =0.73, Spergel et al. 2003) are useful for studying the late stages of the evolution of radio sources, constraining orientation-dependent unified schemes and probing the intergalactic medium at different redshifts (e.g. Subrahmanyan & Saripalli 1993; Subrahmanyan, Saripalli & Hunstead 1996; Mack et al. 1998; Ishwara-Chandra & Saikia 1999, hereinafter referred to as IC99; Kaiser & Alexander 1999; Blundell, Rawlings & Willott 1999 and references therein; Schoenmakers 1999, hereinafter referred to as S99; Schoenmakers et al. 2000a, 2001). Recent attempts to identify GRSs from large radio surveys such as WENSS (Westerbork Northern Sky Survey), NVSS (NRAO VLA Sky Survey) and FIRST (Faint Images of the Radio Sky at Twenty-cm) have significantly increased their numbers (S99; Machalski, Jamrozy & Zola 2001; Chyży et al. 2003), but there is still a dearth of giants 2 Mpc and at cosmologically interesting redshifts of 1. The highest redshift giant source known so far is 4C 39.24, which is associated with a galaxy at a redshift of 1.88 and has been studied in some detail by Law-Green et al. (1995), while the most distant giant quasar is J1432+158 (Singal, Konar & Saikia 2004) at a redshift of 1.005.
In this paper we first report GMRT and VLA observations of a sample of largely giant sources. A few of the sources were earlier classified as GRSs, but now have sizes smaller than 1 Mpc, based on a revised value of the Hubble constant. We have nevertheless included these sources in this paper, since there is a continuity of sizes and the limit of a Mpc is a working definition to identify those in the late stages of evolution. These observations have either helped clarify the radio structures or provided new information on these sources at a different frequency. We examine the radiative losses in these sources, and show that inverse-Compton losses dominate over synchrotron radiative losses in the lobes, consistent with earlier studies (e.g. IC99; Schoenmakers et al. 2000a). In order to develop strategies for indentifying GRSs at high redshifts we investigate the prominence of bridge emission, fbridge, as a function of redshift, and find that fbridge decreases with increasing redshift. These diffuse regions of emission are more likely to be affected by inverse-Compton losses, which would affect the appearance and identification of giants at large redshifts. We explore the evidence for the steep-spectrum cores or SSCs (0.5, S), which might indicate renewed activity, being more common in GRSs compared with the smaller-sized objects, and identify candidate SSCs in our sample. Assuming that nuclear activity may be recurrent, we attempt to identify lobes from earlier episodes of nuclear activity on the basis of the structure and their overall radio spectra.
| Teles- | Array | Obs. | Sources | Obs. |
|---|---|---|---|---|
| cope | Conf. | Freq. | Date | |
| GHz | ||||
| GMRT | 0.6 | J0657+481 | 2003Jan10 | |
| GMRT | 0.6 | J0313+413, J1313+695 | 2003Sep06 | |
| GMRT | 0.6 | J1604+375, J2042+751 | 2004Jan01 | |
| GMRT | 0.6 | J1702+422 | 2004Jan17 | |
| GMRT | 1.3 | J0139+399 | 2003Aug19 | |
| VLA | BnC | 1.4 | J0657+481, J1101+365 | 2000Mar10 |
| J1200+348, J1235+213 | ||||
| J1313+695 | ||||
| VLA | BnC | 1.4 | J0135+379, J0313+413 | 2000Mar13 |
| J1604+375, J1637+417 | ||||
| J1702+422, J2312+187 | ||||
| VLA | D | 5 | J0135+379, J0139+399 | 2000Jul24 |
| J0200+408, J0754+432 | ||||
| J0819+756, J1101+365 | ||||
| J1919+517, J2042+751 | ||||
| J2312+187 | ||||
| VLA | D | 5 | J1200+348, J1313+696 | 2000Aug18 |
| J1604+375, J1637+417 | ||||
| J1702+422 | ||||
| VLA | D | 5 | J0657+481 | 2000Sep11 |
2 Observations and analyses
The GMRT consists of thirty 45-m antennas in an approximate ‘Y’ shape similar to the VLA but with each antenna in a fixed position. Twelve antennas are randomly placed within a central 1 km by 1 km square (the “Central Square”) and the remainder form the irregularly shaped Y (6 on each arm) over a total extent of about 25 km. Further details about the array can be found at the GMRT website at http://www.gmrt.ncra.tifr.res.in. The observations were made in the standard fashion, with each source observation interspersed with observations of the phase calibrator. The primary flux density calibrator was either 3C48, 3C147 or 3C286, with all flux densities being on the Baars et al. (1977) scale. The observing time on the source varied from about an hour to a few hours. However, the low-frequency data were sometimes significantly affected by ionospheric disturbances.

The observations with the VLA were made in the snap-shot mode in the L and C bands with approximately 10 to 20 minutes on the source. The flux densities are again on the Baars et al. (1977) scale. All the data were calibrated and analysed in the standard way using the NRAO AIPS package. Spectral indices were estimated from our data only for regions or features which were unlikely to be significantly affected by any missing flux density.
The observing log for both the GMRT and the VLA observations is given in Table 1 which is arranged as follows. Columns 1 and 2 show the name of the telescope, and the array configuration for the VLA observations; column 3 shows the approximate frequency of the observations in GHz, while the sources observed and the dates of the observations are listed in Columns 4 and 5 respectively. The precise frequencies in MHz are shown in each image and are also listed in Table 2.


3 Observational results
The images of the sources are presented in Figure 1, while the observational parameters and some of the observed properties are presented in Table 2, which is arranged as follows. Column 1: Name of the source; column 2: frequency of observations in units of MHz, and the letter G or V representing either GMRT or VLA observations; columns 3-5: the major and minor axes of the restoring beam in arcsec and its PA in degrees; column 6: the rms noise in units of mJy/beam; column 7: the integrated flux density of the source in mJy estimated by specifying an area enclosing the entire source. We examined the change in flux density by specifying different areas and found the difference to be within a few per cent. The flux densities at different frequencies have been estimated over similar areas. Columns 8, 11 and 14: component designation, where W, E, N, S and C denote the western, eastern, northern, southern and core components respectively; columns 9 and 10, 12 and 13, and 15 and 16: the peak and total flux densities of each of the components in units of mJy/beam and mJy. The core flux densities were sometimes evaluated by imaging the source using the longer spacings so that the core appears reasonably isolated. The superscript indicates that the flux densities have been estimated from a two-dimensional Gaussian fit to the core component. A denotes a possible detection of a core component which requires further confirmation.


3.1 Notes on the sources
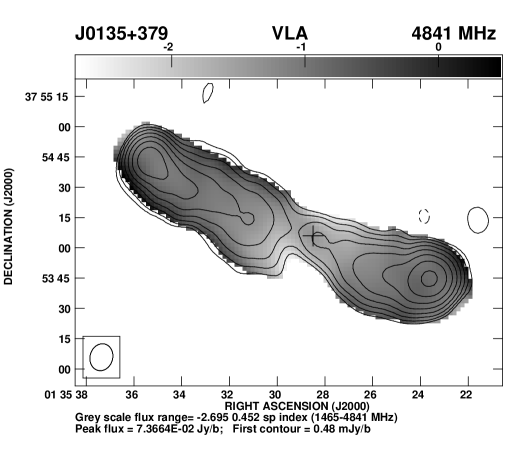
J0135+379, 3C46 VLA B- and C-array images at L-band (Gregorini et al. 1988; Vigotti et al. 1989) show the extended lobes of emission. Higher-resolution A-array observations by Neff et al. (1995) list the core flux density as 11 and 3.6 mJy at 1478 and 4848 MHz, suggesting it might be a steep-spectrum core. The 6cm value is similar to the value of 2.3 mJy estimated by Giovannini et al. (1988), but no significant core emission is seen in the tapered image of Neff et al. which has an rms noise of 0.4 mJy/beam. The 20cm value is not consistent with the estimate of 3 mJy by Gregorini et al. (1988). We made an image using the longer spacings, and find the core flux density to be 1.2 mJy at 4841 MHz and 1.1 mJy at 1465 MHz, yielding a spectral index 0.1. In Fig. 1, we present the 6cm image and the spectral index image between L and C bands superimposed on it. The spectral index, varies from 0.9 to 1.6 in the western lobe, and from 1.0 to 1.8 in the eastern one. The implied ages using the formalism of Myers & Spangler (1985) are 2.3107 and 3.0107 yr respectively.
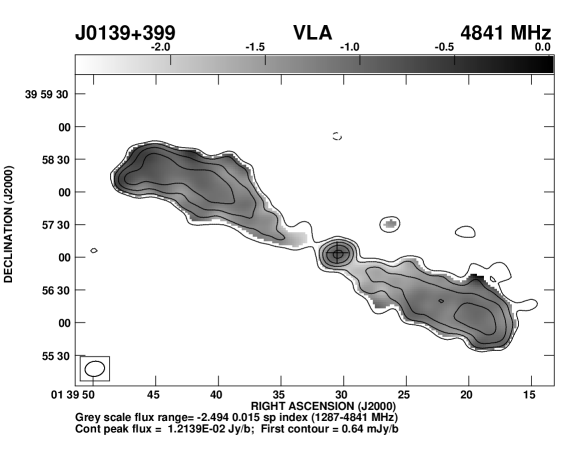
J0139+399, 4C39.04 The large-scale structure showing the relaxed lobes has been reported earlier by a number of authors (e.g. Hine 1979; Vigotti et al. 1989). The flux densities listed in Table 2 suggest that the spectral index of the entire source between 1.3 and 4.8 GHz is 1.34 while that of the core is 0.8. The existence of an SSC was noted earlier (e.g. Hine 1979; Klein et al. 1995). Similar-resolution observations of about 5 arcsec between 1.4 and 5 GHz (Fomalont & Bridle 1978; Gregorini et al. 1988; Bondi et al. 1993; Klein et al. 1995) also yield a core spectral index of 0.8. This is consistent with the 10.6 GHz value of 41 mJy (Mack et al. 1994). Saripalli et al. (1997) find the core to be a compact source with a flux density of 205 mJy from VLBI observations at 1.67 GHz with a resolution of 25 mas. Our GMRT image highlights the diffuse lobes and bridge of emission, and well resolves the possibly unrelated source to the north-east (RA 01h 39m 46.s9, Dec 39∘ 58′ 11.′′3), which appears to be an FRI type of source with a flux density of 42 mJy at 1287 MHz. The spectral index, varies from 1.1 to 1.8 in the western lobe, and from 0.7 to 1.5 in the eastern one, suggesting that the ages are 3107 and 4.5107 yr respectively. Our values of core flux density are similar to those measured by Gregorini et al. (1988) and Bondi et al. (1993) at the L and C bands respectively, suggesting that the core has not varied over a time scale of 10 yr.
| Source | Freq. | Beam size | rms | SI | Cp | Sp | St | Cp | Sp | St | Cp | Sp | St | ||
| MHz | ′′ | ′′ | ∘ | mJy | mJy | mJy | mJy | mJy | mJy | mJy | mJy | ||||
| /b | /b | /b | /b | ||||||||||||
| J0135+379 | V1465 | 14.0 | 11.5 | 34 | 0.18 | 1217 | W | 218 | 640 | C | 1.1 | E | 199 | 579 | |
| V4841 | 13.5 | 11.2 | 165 | 0.12 | 356 | W | 74 | 184 | Cg | 1.2 | 1.1 | E | 59 | 172 | |
| J0139+399 | G1287 | 6.2 | 3.8 | 37 | 0.05 | 1201 | W | 4.5 | 600 | Cg | 34 | 35 | E | 10 | 579 |
| V4841 | 18.0 | 13.8 | 101 | 0.16 | 203 | W | 7.6 | 85 | Cg | 11 | 12 | E | 9.4 | 110 | |
| J0200+408 | V4841 | 13.0 | 11.5 | 146 | 0.13 | W | Cg | 2.8 | 2.6 | E | 5.9 | 5.8 | |||
| J0313+413 | G606 | 11.8 | 6.6 | 137 | 0.33 | Jet | 20 | 179 | Cg | 348 | 375 | N | 8.8 | 129 | |
| V1425 | 19.5 | 15.9 | 39 | 0.10 | Jet | 13 | 63 | Cg | 302 | 308 | N | 5.5 | 21 | ||
| J0657+481 | G617 | 28.1 | 10.3 | 90 | 0.81 | 259 | W | 74 | 152 | E | 53 | 94 | |||
| V1425 | 13.6 | 8.0 | 75 | 0.10 | 73 | W | 23 | 40 | C | 0.6 | E | 19 | 29 | ||
| V4848 | 15.9 | 12.8 | 131 | 0.10 | 22 | W | 8.1 | 10 | Cg | 0.7 | 0.9 | E | 7.0 | 9.3 | |
| J0754+432 | V4816 | 16.8 | 12.8 | 82 | 0.10 | 38 | N | 1.9 | 11 | Cg | 16 | 16 | S | 1.0 | 7.4 |
| J0819+756 | V4841 | 20.5 | 11.1 | 60 | 0.10 | 181 | W | 19 | 106 | Cg | 46 | 46 | E | 4.6 | 30 |
| J1101+365 | V1425 | 15.2 | 5.0 | 104 | 0.10 | 111 | N | 17 | 48 | C? | 0.6 | 0.8 | S | 23 | 60 |
| V4841 | 24.1 | 14.7 | 107 | 0.10 | 38 | N | 11 | 17 | C? | 0.6 | 0.6 | S | 12 | 20 | |
| J1200+348 | V1465 | 15.7 | 5.0 | 109 | 0.10 | 198 | N | 65 | 132 | C | 0.2 | S | 20 | 64 | |
| V4873 | 15.3 | 13.8 | 70 | 0.11 | 77 | N | 33 | 50 | C | 0.3 | S | 16 | 26 | ||
| J1235+213 | V1385 | 16.9 | 12.1 | 103 | 0.27 | 2975 | W | 543 | 1549 | E | 586 | 1431 | |||
| J1313+696 | G605 | 8.1 | 4.6 | 151 | 0.20 | 2499 | N | 39 | 1441 | C | 2.0 | S | 27 | 1046 | |
| V1425 | 14.9 | 6.5 | 121 | 0.10 | 1383 | N | 54 | 797 | Cg | 4.6 | 7.0 | S | 40 | 585 | |
| V4873 | 20.4 | 12.2 | 60 | 0.13 | 431 | N | 30 | 255 | Cg | 4.1 | 4.3 | S | 18 | 172 | |
| J1604+375 | G613 | 7.8 | 4.8 | 171 | 0.10 | 264 | N | 14 | 111 | Cg | 5.4 | 6.4 | S | 53 | 142 |
| V1425 | 32.3 | 10.4 | 58 | 0.21 | 106 | N | 17 | 43 | Cg | 1.9 | 2.9 | S | 31 | 56 | |
| V4873 | 37.9 | 11.8 | 116 | 0.14 | 25 | N | 4.9 | 7.5 | Cg | 1.4 | 1.5 | S | 9.3 | 14 | |
| J1637+417 | V1425 | 23.0 | 8.6 | 54 | 0.10 | 52 | N | 5.1 | 14 | Cg | 3.9 | 3.9 | S | 19 | 34 |
| V4873 | 41.3 | 11.8 | 119 | 0.12 | 19 | N | 2.0 | 4.7 | Cg | 2.3 | 2.1 | S | 9.6 | 11 | |
| J1702+422 | G602 | 15.6 | 14.0 | 26 | 0.26 | 393 | N | 56 | 235 | C | 1.7 | S | 39 | 159 | |
| V1425 | 21.7 | 6.7 | 53 | 0.11 | 172 | N | 26 | 102 | C | 0.6 | S | 17 | 72 | ||
| V4848 | 45.1 | 12.0 | 120 | 0.11 | 51 | N | 12 | 31 | Cg | 1.7 | 1.7 | S | 6.5 | 18 | |
| J1919+517 | V4866 | 24.7 | 18.7 | 74 | 0.23 | 70 | N | 23 | 53 | Cg | 5.3 | 5.7 | S | 4.2 | 14 |
| J2042+751 | G599 | 29.5 | 14.2 | 143 | 1.80 | 4078 | N | 82 | 1208 | Cg | 152 | 174 | S | 1001 | 2623 |
| V4816 | 20.0 | 10.9 | 110 | 0.16 | 471 | N | 5.1 | 66 | Cg | 250 | 249 | S | 76 | 172 | |
| J2312+187 | V1425 | 14.2 | 12.7 | 179 | 0.26 | 1885 | N | 311 | 802 | Cg | 3.2 | 4.1 | S | 356 | 1069 |
| V4866 | 14.2 | 13.7 | 120 | 0.12 | 538 | N | 102 | 230 | Cg | 2.9 | 3.6 | S | 123 | 307 | |
J0200+408, 4C40.08 It has been classified as a double source with no detected radio core (Vigotti et al. 1989; Gregorini et al. 1988; Schoenmakers et al. 2000a). The NVSS image (Fig. 1) shows the diffuse large-scale structure along a PA of 110∘ with no prominent hotspot at the outer edges. Our VLA observations at 4.8 GHz reveal a radio core which is coincident with the optical identification and has a flux density of 2.6 mJy. We also detect the compact component to the east which has a spectral index of 0.6 using the NVSS flux density at 1.4 and our value at 5 GHz. An examination of the Digital Sky Survey (DSS) image shows a faint galaxy coincident with the radio position of this compact component, suggesting that this is an unrelated source.


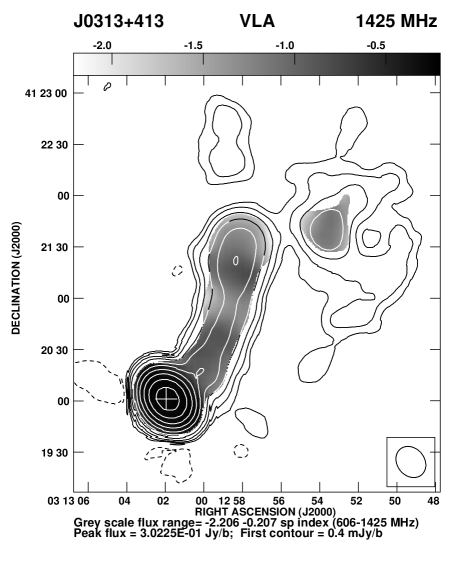
J0313+413 The large-scale structure of this broad line radio galaxy (Marchã et al. 1996) was presented by de Bruyn (1989) with rather coarse resolution. Subsequent published observations with the VLA and VLBI have revealed a prominent core and a weak jet-like extension (Patnaik et al. 1992; Henstock et al. 1995; Taylor et al. 1996; Schoenmakers et al. 2000a; Fey & Charlot 2000). Our GMRT image at 606 MHz reveals a curved radio jet extending over a distance of 250 kpc, and then bending abruptly to enter the northern hotspot. Convolving the GMRT image to that of our VLA image at 1425 MHz shows the core to have a flat radio spectrum of 0.21 while in the jet the average value of is 1.1, with the values close to the peaks of emission being 0.9.
J0657+481, 7C The GMRT image at 617 MHz shows the bridge of emission (Konar et al. 2003) while the VLA 4.8-GHz image shows the radio core co-incident with the galaxy. The core has an inverted spectrum with a spectral index 0.3 between 1.4 and 4.8 GHz. The component to the north-west is possibly unrelated. This GRS was identified by Cotter et al. (1996) from the 7C survey.
J0754+432 The WENSS, NVSS and FIRST images have been presented by S99. Our 4.8-GHz VLA image shows the core to have a flat spectrum (0.07), and the southern lobe to consist of three features which are also visible in the FIRST image. The spectral indices of the western, southern and eastern features using the flux densities from the FIRST and our images are 0.51, 1.0 and 0.58 respectively. The weaker features are more compact and significantly flatter, suggesting that these are possibly unrelated to the GRS.
J0819+756 The WENSS and NVSS images have been presented by S99, while a VLA L-band image with a resolution of 8 arcsec has been published by Lara et al. (2001). Our core flux density at 4.8 GHz is 46 mJy, which is much lower than the value of 57 mJy found by Lara et al. at 4.9 GHz, suggesting variability of the core flux density. This would be consistent with its prominent core and a small angle of inclination to the line of sight. This giant source has multiple hotspots; the furthest component towards the north-east being an unrelated source (cf. Lara et al. 2001).
J1101+365, 7C This GRS has been identified from the 7C survey by Cotter et al. (1996). We detect a possible core which has a flat radio spectrum between 1.4 and 4.8 GHz.
J1200+348 A VLA C-array image at 1465 MHz of this GRS from the GB/GB2 sample has been published by Machalski & Condon (1985).
J1235+213, 3C274.1 The core flux density has an average value of 12 mJy at 963 MHz (Bedford et al. 1981; Kerr et al. 1981) and 3 mJy at 4874 MHz (Strom et al. 1990), yielding a core spectral index of 0.85.
J1313+696, 4C69.15 The 1.4-GHz image shows the prominent bridge of emission, with a weak radio core. The limit on the core flux density at 605 MHz suggests that the core spectrum turns over at 1 GHz. The core spectral index between 1.4 and 4.8 GHz is 0.4.
J1604+375, 7C The GMRT 613-MHz image shows possible evidence of a curved twin-jet structure, with the overall structure resembling an S-shaped source. Such structures could arise due to precession of the jet axis.
J1637+417, 7C The core spectral index from our VLA observations is 0.50, suggesting that it could be an SSC.
J1702+422, 7C The GMRT 602-MHz image shows a prominent bridge of emission with no core component. Our estimate of the core flux density of 0.6 mJy at 1.4 GHz is consistent with a weak feature of 0.66 mJy seen in the FIRST image. Our 4.8-GHz image shows a core with a flux density of 1.7 mJy showing that it has an inverted radio spectrum (0.8).
J1919+517 The WENSS and a Westerbork L-band image have been presented by S99, and it has been observed with low resolution at 10.7 GHz with the Effelsberg telescope (Mack et al. 1997 and references therein). Our VLA 4.8-GHz image clearly shows the radio core with a flux density of 5.7 mJy, which combined with the 1.4 GHz value listed by S99 yields a spectral index of 1.0. The component east of the core is possibly unrelated and has a flux density of 9.2 mJy at 4866 MHz.
J2042+751, 4C74.26 This GRS, identified with a quasar has a prominent core and a one-sided radio jet (Riley et al. 1989; Riley & Warner 1990; Pearson et al. 1992). The total flux density of the core at 5 GHz decreased from 0.42 to 0.31 Jy between 1986 and 1988 (Riley et al. 1989). Our estimate of 250 mJy at 4816 MHz in 2000 is consistent with a strongly variable radio core.
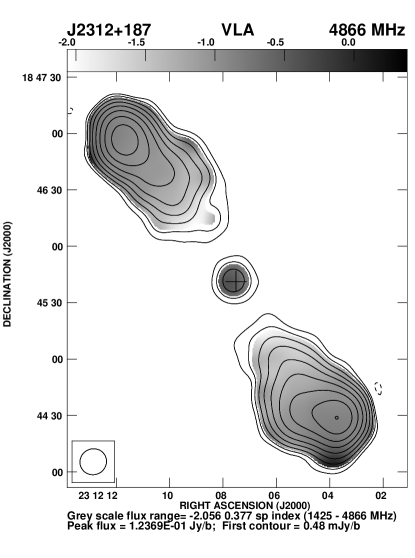
J2312+187, 3C457 The spectral indices of both the northern and sourthern lobes between 1.4 and 4.9 GHz varies from 0.9 to 2.0, suggesting a spectral age of 3.5107 yr. The region with a flatter spectral index at the edge of the southern lobe is close to the position of the unrelated source identified by Leahy & Perley (1991). The core spectral index is 0.1 between 1.4 and 4.9 GHz.
| Source | Alt. | Opt. | Redshift | LAS | l | P1.4 | fc | Cmp. | umin | Beq | Cmp. | umin | Beq |
|---|---|---|---|---|---|---|---|---|---|---|---|---|---|
| name | Id. | 10-14 | 10-14 | ||||||||||
| ′′ | kpc | W Hz-1 | J m-3 | nT | J m-3 | nT | |||||||
| J0135+379 | 3C46 | G | 0.4373 | 150 | 846 | 27.01 | 0.004 | W | 26.36 | 0.53 | E | 20.67 | 0.47 |
| J0139+399 | 4C39.04 | G | 0.2107 | 370 | 1259 | 26.15 | 0.07 | W | 19.30 | 0.46 | E | 11.83 | 0.36 |
| J0200+408 | 4C40.08 | G | 0.0827 | 920 | 1414 | 24.61 | 0.05 | W | 1.09 | 0.11 | E | 1.40 | 0.12 |
| J0313+413 | B3 | G | 0.136 | 570 | 1357 | 25.34 | 0.86 | Jet | 44.44 | 0.69 | |||
| J0657+481 | 7C | G | 0.776 | 133 | 989 | 26.34 | 0.04 | W | 14.57 | 0.40 | E | 14.55 | 0.40 |
| J0754+432 | G | 0.3474 | 485 | 2368 | 25.67 | 0.35 | N | 0.99 | 0.10 | S | 0.55 | 0.08 | |
| J0819+756 | G | 0.2324 | 454 | 1666 | 25.97 | 0.31 | W | 3.39 | 0.19 | E | 2.69 | 0.17 | |
| J1101+365 | 7C | G | 0.750 | 154 | 1131 | 26.49 | 0.01 | N | 4.25 | 0.21 | S | 4.35 | 0.22 |
| J1200+348 | G | 0.55 | 145 | 927 | 26.43 | 0.006 | N | 8.01 | 0.29 | S | 5.75 | 0.25 | |
| J1235+213 | 3C274.1 | G | 0.422 | 151 | 834 | 27.28 | 0.004 | W | 24.45 | 0.51 | E | 26.48 | 0.53 |
| J1313+696 | DA340 | G | 0.106 | 388 | 745 | 25.60 | 0.01 | N | 6.54 | 0.27 | S | 5.24 | 0.24 |
| J1604+375 | 7C | G | 0.814 | 178 | 1346 | 26.54 | 0.04 | N | 45.55 | 0.70 | S | 21.42 | 0.48 |
| J1637+417 | 7C | G | 0.867 | 134 | 1035 | 26.36 | 0.09 | N | 3.65 | 0.20 | S | 5.47 | 0.24 |
| J1702+422 | 7C | G | 0.476 | 196 | 1160 | 26.16 | 0.03 | N | 5.04 | 0.23 | S | 6.88 | 0.27 |
| J1919+517 | G | 0.284 | 429 | 1825 | 25.95 | 0.06 | N | 4.40 | 0.22 | S | 3.54 | 0.20 | |
| J2042+751 | 4C74.26 | Q | 0.104 | 610 | 1151 | 25.68 | 0.42 | N | 2.73 | 0.17 | S | 3.83 | 0.20 |
| J2312+187 | 3C457 | G | 0.427 | 190 | 1056 | 27.09 | 0.006 | N | 18.34 | 0.44 | S | 19.30 | 0.46 |
4 Discussion and results
4.1 Radiative losses
For the sources listed in Table 2 we estimate the minimum energy density, umin and the equipartition magnetic field, Beq for all the extended components (Miley 1980; Longair 1994). These are listed in Table 3 which is arranged as follows. Columns 1 and 2: source name and an alternative name. Column 3: optical identification where G denotes a galaxy and Q a quasar; column 4: redshift; columns 5 and 6: the largest angular size in arcsec and the corresponding projected linear size in kpc; column 7: the luminosity at 1.4 GHz in logarithmic units of W Hz-1; column 8: the fraction of emission from the core, fc, at an emitted frequency of 8 GHz. For sources without detailed spectral information, spectral indices of 0 and 0.9 have been assumed for the cores and lobes respectively. Columns 9 and 12: component designation; columns 10, 11 and 13, 14: the corresponding minimum energy density, umin, in units of 10-14 J m-3 and the equipartition magnetic field, Beq, in nT (1T = 104 G) for the extended components. For sources such as J0200+408, where most of the lobe emission has been resolved out in our images, we have used the NVSS images for estimating these parameters. The minimum energy density and equipartition magnetic field have been estimated for the extended emission assuming a cylindrical or spheroidal geometry, a filling factor of unity and that energy is distributed equally between relativistic electrons and protons. The size of the lobes has been estimated from the lowest contours in the available images. The luminosity has been estimated between 10 MHz and 100 GHz using the known spectral indices of the extended emission or else assuming a value of 0.9.
The minimum energy densities are in the range of 1 to 45 10-14 J m-3 with a median value of about 5.8 10-14 J m-3, while the equipartition magnetic field for the lobes range from 0.08 to 0.7 nT with a median value of 0.25 nT. We examine the relative importance of synchrotron and inverse-Compton losses in the lobes of these radio sources. The equipartition magnetic field of the lobes for all the sources are less than the equivalent magnetic field of the microwave background radiation at the redshift of the source, Bic=0.32(1 + z)2 nT. This suggests that the inverse-Compton losses are larger than the synchrotron radiative losses in the evolution of the lobes of these giant sources, consistent with earlier results (e.g. IC99).
The dominance of inverse Compton losses is likely to severely affect the appearance and identification of GRSs at high redshifts due to the suppression of bridge emission by inverse-Compton losses against the cosmic microwave background radiation, which increases sharply with redshift. This could lead to ‘tail-less’ hotspots leading to their classification as independent radio sources (e.g. Baldwin 1982). For the sources discussed here, we quantify the prominence of the bridge emission, fbridge, as the ratio of emission from the bridge to that of the total emission, estimated from either single-dish or low-resolution observations available in the literature. The flux density from the bridge has been estimated by subtracting the ‘hot-spot’ and core flux densities from the total flux density. The ‘hot-spot’ flux densities have been estimated by smoothing our images to a uniform linear resolution of 70 kpc and taking the peak flux densities at the outer edges as a measure of the ‘hot-spot’ flux densities. It was possible to do this for 14 of the objects in our sample. With observations of higher linear resolution, one could get better estimates of the ‘hot-spot’ flux densities. A plot of fbridge at an emitted frequency of 1.4 GHz against redshift is shown in Fig. 2. The error bars indicate a 1 error in fbridge adopting an error of 10 per cent in the flux densities. The plot clearly shows an inverse correlation, with a Spearman rank correlation coefficient of 0.52, corresponding to a confidence level of 95 per cent, suggesting that suppression of bridge emission could affect the identification of GRSs at high redshifts.
4.2 Relic radio emission
In order to understand the nature of episodic activity in the nucleus of the parent galaxy, which sometimes manifests itself as a double-double radio galaxy (Schoenmakers et al. 2000b), we attempt to identify relic radio emission from an earlier cycle of nuclear activity. The lifetime of a relativistic electron at an observed frequency, , due to both synchrotron and inverse-Compton losses is given by
where is in MHz and the magnetic fields Bic and Beq are in units of 10-10 T (e.g. Mack et al. 1998). For a median redshift of 0.4 as in our sample of sources and a median magnetic field of 0.25 nT, the lifetime of the relativistic electron at an observed frequency of 1400 MHz is 4107 yr. For a velocity of advancement of 0.1c, the outer hotspots would traverse a distance of 1.2 Mpc during this time period.
Radio sources, with an inactive nucleus for timescales , may be characterised by a very relaxed lobe with no hotspot at the outer edges and a steep radio spectrum (1.0). Detection of a radio core in such a source could indicate the beginning of a new period of activity. Such sources can be distinguished from the low-luminosity FRI sources. Although FRI sources also have lobes without hotspots, these sources are characterised by radio jets which expand to form the diffuse lobes of emission, reflecting ongoing activity in the nucleus of the parent galaxy. Also, the spectral indices of FRI sources are usually flatter, consistent with the radio luminosityspectral index correlation (e.g. Laing & Peacock 1980)

Two candidate sources with evidence of relic radio emission are J0139+399 and J0200+408. J0139+399 has a very relaxed morphology with no hotspots, a weak radio core (Fig. 1), no jets and a spectral index of 1.34 from similar resolution GMRT and VLA data at L and C bands respectively. The second candidate, J0200+408, has similar structural features and a very steep spectrum of 1.78 using the flux density at 325 MHz (S99) and the NVSS value at 1400 MHz.
4.3 Steep-spectrum cores (SSCs)
The cores of extended double-lobed sources usually tend to have flat and complex radio spectra with 0.5. The occurrence of SSCs with 0.5 is indeed rare, and is often due to contamination of the measured low-frequency flux density by more extended emission (e.g. Saikia, Kulkarni & Porcas 1986). However, the occurrence of an SSC suggests that the emission is largely optically thin, which could be due to small-scale jets and/or lobes not resolved by the existing observations. One of the well-known sources with an SSC is the GRS 3C236 where the core spectral index was estimated by Mack et al. (1997) to be 0.610.01. VLBI imaging of the SSC shows it to consist of a core, jet and two oppositely-directed lobes of emission (Schilizzi et al. 2001). The small- and large-scale structure of 3C236 suggests that it could be considered to be a double-double radio galaxy, which is a sign of recurrent activity. It is interesting to note that 3C236 shows evidence of star formation and also HI absorption against a lobe of the inner radio source (Conway & Schilizzi 2000; Schilizzi et al. 2001; O’Dea et al. 2001), which could be due to infall of gas fuelling the central engine. Another possible steep spectrum core is associated with the giant radio galaxy DA240 and has a spectral index of 0.560.01 (Mack et al. 1997). VLBI observations of the core with an angular resolution of 25 mas shows that it possibly has a twin-jet structure (Saripalli et al. 1997).
Of a sample of 30 radio galaxies, with known cores observed with the VLA A-array between 1.4 and 15 GHz, no radio core, except the GRS DA240, showed evidence of a straight, steep radio spectrum. The radio core of DA240 was found to have a flux density of 191 and 110 mJy at 1465 and 4885 MHz, yielding a spectral index of 0.5 (Saikia et al., in preparation). Only three of these 30 sources are GRSs, the other two being NGC315 and NGC6251, both of which have flat-spectrum cores. Similarly for a sample of 17 sources from the Molonglo Reference Catalogue observed with the VLA A-array between 1.4 and 15 GHz, the cores tend to have flat and complex spectra. Only two sources whose low-frequency flux densities were significantly affected by contamination from more extended emission appeared to have steep spectra (Ishwara-Chandra & Saikia 2000). Only two of these 17 sources are GRSs, the remaining ones being of smaller sizes.
Considering the rarity of SSCs and the occurrence of two of these with known GRSs, it is meaningful to enquire whether this is entirely due to chance or it might have a deeper significance. For example, if the occurrence of SSCs is related to recurrent activity, the preferential occurrence of SSCs in GRSs might enable us to get further insights into the time scales of recurrent activity. Towards this end, we have tried to identify SSC candidates in the present sample of GRSs and have identified four candidates. As discussed in Section 3.1, J0139+399, J1235+213 and J1919+517 appear to have 0.8, while J1637+417 is a more marginal case with a steep spectrum, 0.5. For confirmation, the spectra of these candidate SSCs need to be determined over a larger frequency range from higher resolution observations. If confirmed, this would indicate a higher incidence of SSCs among GRSs compared with smaller-sized sources as discussed earlier, which is possibly related to the time scales of recurrent activity.
4.4 Core prominence and variability
The fraction of emission from the core at an emitted frequency of 8 GHz, fc, ranges from 0.004 to 0.86, with a median value of 0.04. The values of fc are usually comparable to the other sources of similar radio luminosity. The four sources with prominent cores (fc0.2) are J0313+413, J0754+432, J0819+756 and J2042+751, the first three of which are associated with galaxies and J2042+751 with a quasar. Given the prominence of the cores, it is reasonable to assume that these galaxies lie close to 45∘ to the line of sight, the dividing line between galaxies and quasars in the unified schemes (e.g. Barthel 1989). The classification of J0313+413 as a broad line radio galaxy (Marchã et al. 1996), the detection of broad hydrogen Balmer lines in J0754+432 and a broad component in the H line of J0819+756 (Schoenmakers et al. 2001) are consistent with this interpretation. For an inclination angle of 45∘ their intrinsic sizes would increase to 1900, 3350 and 2350 kpc respectively.
The GMRT and VLA images of the radio galaxy J0313+413 shows a prominent radio jet which curves towards the north and then bends abruptly towards the west (Fig. 1). There is also a suggestion of a weak counter-jet in the GMRT image at 606 MHz. The jet to counter-jet brightness ratio varies from 7 to 20 along the length of the jet. If the asymmetry is due to relativistic beaming, this imples a jet speed of 0.40.6c for an inclination angle of 45∘. We have also compiled the core flux densities of J0313+413 in Table 4. Although the data are not homogeneous, measurements of a higher flux density with higher resolution compared with coarser-resolution observations at a different epoch at both 5 and 8 GHz suggests that the core is variable, which is consistent with the assumed angle to the line of sight. The giant quasar J2042+751 (4C74.26) which has a prominent core, exhibits a one-sided radio jet and variability of the core flux density by approximately 50 per cent over a two-year time scale (Riley & Warner 1990). Our value of the core flux density at 4816 MHz is only 250 mJy compared with previous measurements in the range of 310 to 420 mJy (Riley et al. 1989; Pearson et al. 1992), consistent with a strongly variable core. In the quasar 4C74.26, the inferred orientation angle of 49∘ (Pearson et al. 1992) implies an intrinsic size 1525 kpc.
| Teles- | resn. | Date | Freq. | S | Ref. |
|---|---|---|---|---|---|
| cope | ′′ | MHz | mJy | ||
| GMRT | 8.8 | 2003Sep06 | 606 | 375 | 1 |
| VLA-A | 2.0 | 1995Jul10 | 1415 | 309 | 6 |
| VLA-BnC | 17.6 | 2000Mar13 | 1425 | 308 | 1 |
| VLBA | 0.0048 | 1997Jan1012 | 2320 | 270 | 3 |
| VLA-B | 2.0 | 1994Aug06 | 4710 | 408 | 6 |
| VLA-C | 4.4 | 1980Jul13,14 | 4885 | 337 | 2 |
| VLBI | 0.0014 | 1993Jun916 | 4992 | 461 | 7 |
| VLA-A | 0.2 | 1990Feb1923 | 8400 | 673 | 5 |
| VLBA | 0.0012 | 1997Jan1012 | 8550 | 290 | 3 |
| VLA-CnD | 8.0 | 1997Sep-Oct | 8460 | 458 | 4 |
| VLA-C | 1.4 | 1980Jul13,14 | 15035 | 465 | 2 |
1: Present paper; 2: Saikia et al. 1984; 3: Fey et al. 2000; 4: Dennett-Thorpe et al. 2000; 5: Patnaik et al. 1992; 6: Taylor et al. 1996; 7: Henstock et al. 1995.
5 Concluding remarks
Multifrequency GMRT and VLA observations of a sample of seventeen largely GRSs have either helped clarify the radio structures or provided new information at a different frequency. The broad line radio galaxy, J0313+413, has an asymmetric, curved radio jet and a variable radio core, consistent with a moderate angle of inclination to the line of sight, while J1604+375 shows evidence of a precessing twin-jet structure. We identify four candidate steep spectrum radio cores, which may be a sign of recurrent activity. J0139+399, J1235+213 and J1919+517 appear to have 0.8, while J1637+417 is a more marginal case with 0.5. The spectra of these candidate SSCs need to be determined over a larger frequency range from higher resolution observations. If confirmed, this would indicate a higher incidence of SSCs among GRSs, compared with sources of smaller dimensions, which is possibly related to the time scales of recurrent activity. From the structure and integrated spectra of the sources, we suggest that the diffuse lobes of emission in J0139+399 and J0200+408 may be due to an earlier cycle of nuclear activity. We find that inverse-Compton losses with the cosmic microwave background radiation dominate over synchrotron radiative losses in the lobes of all the sources, consistent with earlier studies. We also show that the prominence of the bridge emission decreases with redshift, possibly due to inverse-Compton losses. This would affect the appearance and identification of GRSs at large redshifts.
Acknowledgments
We thank an anonymous referee for a detailed report and many useful suggestions, and Ian Browne and Graham Smith for several useful comments on the manuscript, all of which have significantly improved the paper. The Giant Metrewave Radio Telescope is a national facility operated by the National Centre for Radio Astrophysics of the Tata Institute of Fundamental Research. The National Radio Astronomy Observatory is a facility of the National Science Foundation operated under co-operative agreement by Associated Universities Inc. This research has made use of the NASA/IPAC extragalactic database (NED) which is operated by the Jet Propulsion Laboratory, Caltech, under contract with the National Aeronautics and Space Administration. DJS thanks the Director, Jodrell Bank Observatory for hospitality, where this work was completed.
References
- [] Baars J.W.M., Genzel R., Pauliny-Toth I.I.K., Witzel A. 1977, A&A, 61, 99
- [] Baldwin J.E., 1982, in Heeschen D.S., Wade C.M., eds, Proc. IAU Symp. 97, Extragalactic Radio Sources, Reidel, Dordrecht, p21
- [] Bedford N.H., Kerr A.J., Mathur S.H., Morison I., Spencer R.E., Stannard D., 1981, MNRAS, 195, 245
- [] Barthel P.D., 1989, ApJ, 336, 606
- [] Blundell, K.M., Rawlings, S., Willott, C.J., 1999, AJ, 117, 677
- [] Bondi M., Gregorini L., Padrielli L., Parma P., 1993, A&AS, 101, 431
- [] Conway J.E., Schilizzi R.T., 2000, In EVN Symposium 2000, eds J.E. Conway, A.G. Polatidis, R.S. Booth, Y.M. Pihlström, Onsala Space Observatory, p. 123
- [] Cotter G., Rawlings S., Saunders R., 1996, MNRAS, 281, 1081
- [] Chyży K. et al., 2003, Baltic Astron., in press (astro-ph/0310606)
- [] de Bruyn A.G., 1989, A&A, 226, L13
- [] Dennett-Thorpe J., Marchã M.J., 2000, A&A, 361, 480
- [] Fey A.L., Charlot P., 2000, ApJS, 128, 17
- [] Fomalont E.B., Bridle A.H., 1978, AJ, 83, 725
- [] Giovannini G., Feretti L., Gregorini L., Parma P., 1988, A&A, 199, 73
- [] Gregorini L., Padrielli L., Parma P., Gilmore G., 1988, A&AS, 74, 107
- [] Henstock D.R., Browne I.W.A., Wilkinson P.N., Taylor G.B., Vermeulen R.C., Pearson T.J., Readhead A.C.S., 1995, ApJS, 100, 1
- [] Hine R. G., 1979, MNRAS, 189, 527
- [] Ishwara-Chandra C.H., Saikia D.J., 1999, MNRAS, 309, 100 (IC99)
- [] Ishwara-Chandra C.H., Saikia D.J., 2000, MNRAS, 317, 658
- [] Kaiser C.R., Alexander P. 1999, MNRAS, 302, 515
- [] Kerr A.J., Birch P., Conway R.G., Davis R.J., Stannard D., 1981, MNRAS, 197, 921
- [] Klein U., Mack K.-H., Gregorini L., Parma P., 1995, A&A, 303, 427
- [] Konar C., Saikia D.J., Ishwara-Chandra C.H., Kulkarni V.K., 2003, BASI, 31, 437
- [] Laing R.A., Peacock J.A., 1980, MNRAS, 190, 903
- [] Lara L., Cotton W.D., Feretti L., Giovannini G., Marcaide J.M., Márquez I., Venturi T., 2001, A&A, 370, 409
- [] Law-Green J.D.B., Eales S.A., Leahy J.P., Rawlings S., Lacy M., 1995, MNRAS, 277, 995
- [] Leahy J. P., Perley R. A., 1991, AJ, 102, 537
- [] Longair, M. S., 1994, High Energy Astrophysics, Cambridge University Press, Cambridge.
- [] Machalski J., Condon J. J., 1985, AJ, 90, 5
- [] Machalski J., Jamrozy M., Zola S., 2001, A&A, 371, 445
- [] Mack K.-H., Gregorini L., Parma P., Klein U., 1994, A&AS, 103, 157
- [] Mack K.-H., Klein U., O’Dea C.P., Willis A.G., 1997, A&AS, 123, 423
- [] Mack K.-H., Klein U., O’Dea C. P., Willis A. G., Saripalli L., 1998, A&A, 329, 431
- [] Marchã M.J.M., Browne I.W.A., Impey C.D., Smith P.S., 1996, MNRAS, 281, 425
- [] Miley G. K., 1980, ARA&A, 18, 165
- [] Myers S. T., Spangler S. R., 1985, ApJ, 291, 52
- [] Neff S.G., Roberts L., Hutchings J.B., 1995, ApJS, 99, 349
- [] O’Dea C.P., Koekemoer A.M., Baum, S.A., Sparks W.B., Martel A.R., Allen M.G., Macchetto F.D., Miley G.K., 2001, AJ, 121, 1915
- [] Patnaik A.R., Browne I.W.A., Wilkinson P,N., Wrobel J.M., 1992, MNRAS, 254, 655
- [] Pearson T. J., Blundell K. M., Riley J. M., Warner P. J., 1992, MNRAS, 259, L13
- [] Riley J. M., Warner P. J., 1990, MNRAS, 246, L1
- [] Riley J. M., Warner P. J., Rawlings S., Saunders R., Pooley G. G., Eales S. A., 1989, MNRAS, 236, L13
- [] Saikia D.J., Shastri P., Kapahi V.K., Sinha R.P., Swarup G., 1984, JA&A, 5, 429
- [] Saikia D.J., Kulkarni V.K., Porcas R.W., 1986, MNRAS, 219, 719
- [] Saripalli L., Patnaik A.R., Porcas R.W., Graham D.A., 1997, A&A, 328, 78
- [] Schilizzi R.T. et al., 2001, A&A, 368, 398
- [] Singal A.K.; Konar C., Saikia D.J., 2004, MNRAS, 347, 79L
- [] Schoenmakers A.P., Mack K.-H., de Bruyn A.G., Röttgering H.J.A., Klein U., van der Laan H., 2000a, A&AS, 146, 293
- [] Schoenmakers A.P., 1999, PhD Thesis, Rijksuniversiteit Groningen (S99)
- [] Schoenmakers A.P., de Bruyn A.G., Röttgering H.J.A., van der Laan H., Kaiser C.R., 2000b, MNRAS, 315, 371
- [] Schoenmakers A.P., de Bruyn A.G., Röttgering H.J.A., van der Laan H., 2001, A&A, 374, 861
- [] Spergel D.N. et al., 2003, ApJS, 148, 175
- [] Strom R.G., Riley J.M., Spinrad H., van Breugel W.J.M., Djorgovski S., Liebert J., McCarthy P.J., 1990, A&A, 227, 19
- [] Subrahmanyan R., Saripalli L., 1993, MNRAS, 260, 908
- [] Subrahmanyan R., Saripalli L., Hunstead R.W., 1996, MNRAS, 279, 257
- [] Taylor G.B., Vermeulen R.C., Readhead A.C.S., Pearson T.J., Henstock D.R., Wilkinson P.N., 1996, ApJS, 107, 37
- [] Vigotti M., Grueff G., Perley R., Clark B.G., Bridle A.H., 1989, AJ, 98, 419