The Case of the Off-Center, Levitating Bar in the Large Magellanic Cloud
Abstract
I explore the hypothesis that many of the unusual aspects of the apparent stellar bar of the Large Magellanic Cloud are the result of viewing a triaxial stellar bulge that is embedded in a highly obscuring thin disk. Specifically, this hypothesis explains the observed off-center position of the bar within the disk, the differing apparent distances of the bar and disk, the near alignment of the bar’s major axis position angle and the disk’s line-of-nodes, and the asymmetric appearance of the bar itself. Indirectly, it may also play a role in explaining the microlensing rate toward the LMC and the recently observed large velocity dispersion of RR Lyrae stars.
Subject headings:
Magellanic Clouds — galaxies: photometry — galaxies: stellar content1. Introduction
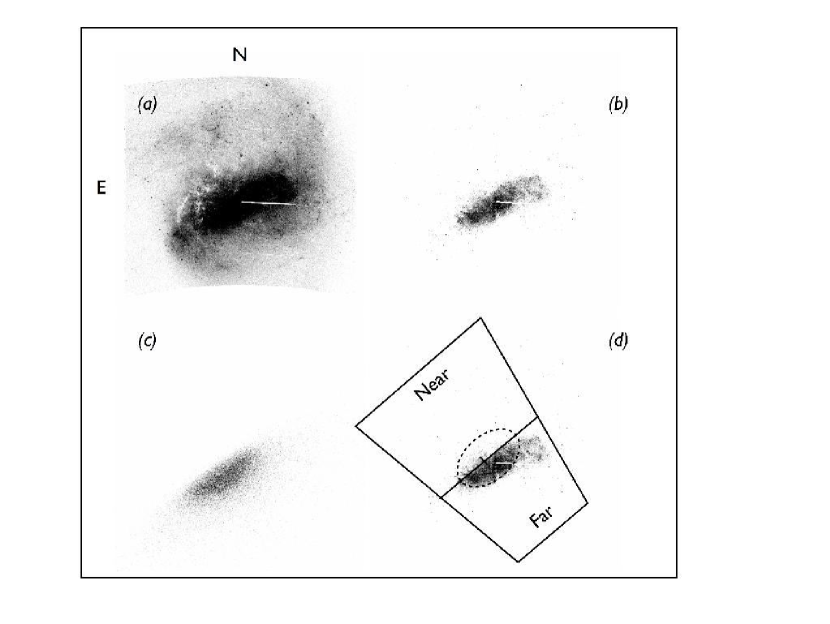
The off-center bar of the Large Magellanic Cloud (LMC) has helped define a class of irregular galaxies (de Vaucouleurs & Freeman, 1972) and become a prime motivation for the study of off-center, spiral wave driving models (Colin & Athanassoula, 1989; Gardiner et al., 1998). Despite the obvious “barred” appearance of the LMC (Figure 1a), there are surprisingly few direct constraints on the three dimensional structure of the apparent feature (see Zhao & Evans, 2000). Is the bar in the LMC real or an illusion?
Several features of the LMC bar are difficult to reconcile with the simplest version of barred disk galaxies:
1) The bar is off-center relative to the underlying disk. At large radius ( kpc), where there is no contamination of the disk isophotes by other components and where the deprojected position angle, ellipticity, and centroid remain approximately constant, the disk center is measured to lie approximately at (see Fig 4 of van der Marel, 2001). At small to intermediate radii (0.5 kpc 2.5 kpc), where the bar dominates the isophotes and the deprojected position angle and centroid remain approximately constant, the centroid is shifted from that of the outer disk by 0.5 and 0.3 kpc in and , respectively (van der Marel, 2001). This type of misalignment has been defined to be a common characteristic of barred Magellanic irregulars (de Vaucouleurs & Freeman, 1972) and dynamically important in defining the weak spiral structure of these systems, but its cause has not yet been conclusively identified (Gardiner et al., 1998).
2) The measured distance to the bar is different than that to the disk. Nikolaev et al. (2004) conclude that the bar is “elevated” above the disk plane, located closer to us by kpc.
3) The bar’s major axis is nearly parallel to the disk’s line-of-nodes ( and , respectively; van der Marel (2001)). The foreshortening of any bar whose major axis position angle is not oriented along the line-of-nodes will make the alignment appear closer than it truly is, but most bars in disk galaxies are sufficiently elongated that they are typically not aligned in projection.
4) The bar is asymmetric. The stellar density is ellipsoidal on the southwestern side and flat along the northeastern edge. The flat edge lies nearly parallel to the disk’s line-of-nodes (Figure 1b).
The hypothesis I explore is that the LMC’s barred appearance and the features listed above are the result of viewing a bulge population that is obscured by an optically thick inner disk.
2. A Simple Model
2.1. The Observational Situation
The data come from the Magellanic Clouds Photometric Survey, which is a and survey of the central of the Large Magellanic Cloud and of the Small Magellanic Cloud. Both catalogs are published (Zaritsky et al., 2002, 2004).
I plot in Figure 1 the stellar density on the sky of stars with . The high-contrast panels (Figures 1b,d), show how the distribution of the central population appears to be sharply truncated toward the northeast and rounded toward the southwest. The line-of-nodes and center derived by van der Marel (2001) are plotted for reference in Figure 1d. Some rectilinear irregularities in the density distribution that are present in Figure 1 arise from different completeness limits among drift scan images in this region of high stellar density. Although these irregularities do not affect the qualitative conclusions presented here, they do preclude detailed model fitting to these data prior to obtaining the results from extensive artificial star tests. I do, however, provide values for the various models presented for intercomparison, assuming only Poisson noise in the star counts. These values are calculated within a rectangular region than incorporates the visible bar in Figure 1b, and the model is normalized to have the same total number of stars within this region. Because of the systematics described above, and the lack of a modeled disk component, is expected to be even for the correct model.
2.2. Exploring the Hypothesis
I begin with a model defined by the disk geometry measured by van der Marel & Cioni (2001). The choice of geometry, in particular the position angle of the line-of-nodes (122∘ in that study), will be explored below. Within the adopted geometry, the bulge has two of its principal axes in the disk plane (and hence the third perpendicular to the disk plane), but has an otherwise unconstrained position angle and axial ratio. Its center is assumed to be coincident with that of the disk, because the focus here is to determine whether the observations can be explained without invoking an offset component. I assume that all of the obscuring dust is in the disk plane and has a much smaller vertical scaleheight than any dynamically hot population (see Zaritsky et al., 2004, for a confirmation of this assumption for the LMC as a whole). The volume density of bulge stars is assumed to be constant for , where , to follow an density profile for , and to otherwise be zero. The scales, and , are free parameters. The constant density core is set to avoid a divergence at small radii and to mimic the observed shallow density gradient in the inner kpc. Because of crowding in the MCPS images, the true profile may be significantly steeper than that suggested by Figure 1 and hence, the flat central density of the models may not reflect reality even though it is ultimately successful in reproducing the observations. I draw stars from a power law luminosity function, , place them in projection according to the viewing geometry of the LMC, apply extinction (extinction prescription is discussed below), and accept only those stars that satisfy the observational criteria. Distance differences are accounted for in determining the apparent magnitude and no disk component is included in the generated stellar density maps. In summary, the parameters of the model that vary are the three scaling parameters, and , the core radius in scale-free units (although it was fixed for all models once a satisfactory value was found), and the bulge’s position angle.
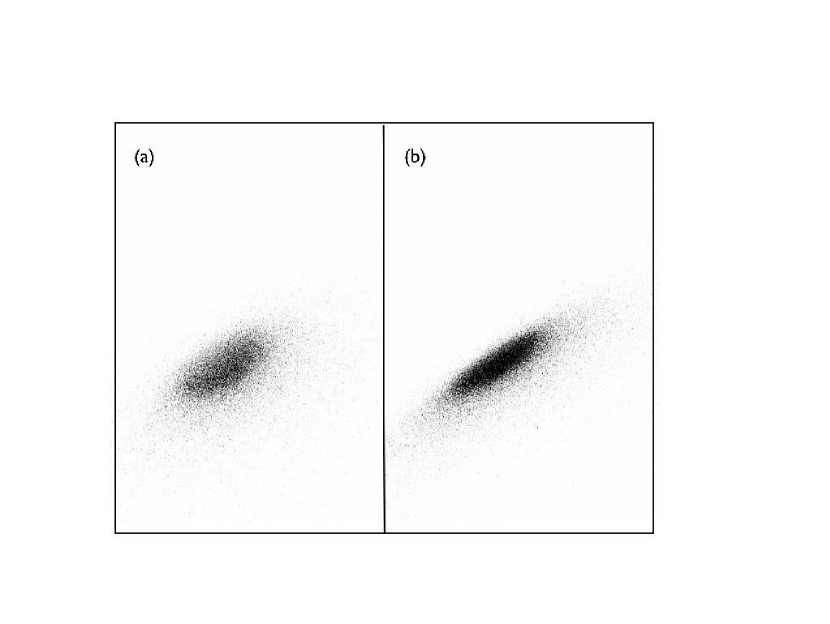
After exploring various parameter combinations, I reached a few principal conclusions. First, the extinction in the midplane, at least in this central portion of the LMC disk, must be significantly larger than estimated by Zaritsky et al. (2004) to sufficiently obscure the rear portion of the bulge. To increase the extinction in the modeling, I define a minimum visual extinction value, . At any location for which the extinction value from the Zaritsky et al. (2004) extinction map is less than this minimum value, the extinction is set to . An extreme value of was used in Figure 1c to mimic complete extinction, but a strong extinction edge is seen toward the northeast side of the bulge for . These large extinction values do not contradict the Zaritsky et al. (2004) results because such highly obscured stars would not be in their sample. Second, the extension of the bulge must be relatively short along the y-axis (the disk plane, short axis of the bulge) because otherwise the sharp northeastern edge created by the disk bisection of the bulge becomes increasingly blurred (see Figure 2a for a model with double the y-scale of that shown in Figure 1c). Third, the extension of the bulge along the z-axis (out of the disk plane) must be relatively large to produce the noticeable rounding of the southwestern edge (Figure 2b).
The parameters for the model shown in Figure 1c are kpc, kpc, and kpc, which makes this bulge an oblate spheroid that protrudes from the disk plane (this model has , while the same geometric model without any midplane extinction has ). The physical scale of the constant density central region along each axis is given by the core boundary, defined previously to be , times either , or . The extreme nature of this bulge can be mitigated somewhat, at the expense of a moderate worsening of the fit. For example, a bulge with , and still reproduces the principal qualitative structure but does not produce as sharp an edge toward the northeast (Figure 2a). This model has a slightly lower , 9.2, than the previous model presumably because it is more extended and so partially accounts for the missing disk stars in the model. The extent along the z axis cannot be decreased significantly without losing the rounded appearance of the bar (see Figure 2b for a model with and ; ). Any detailed exploration of the parameter space would require a disk model in which the bulge is embedded, and higher resolution imaging to produced stellar density distributions that are less severely affected by crowding.
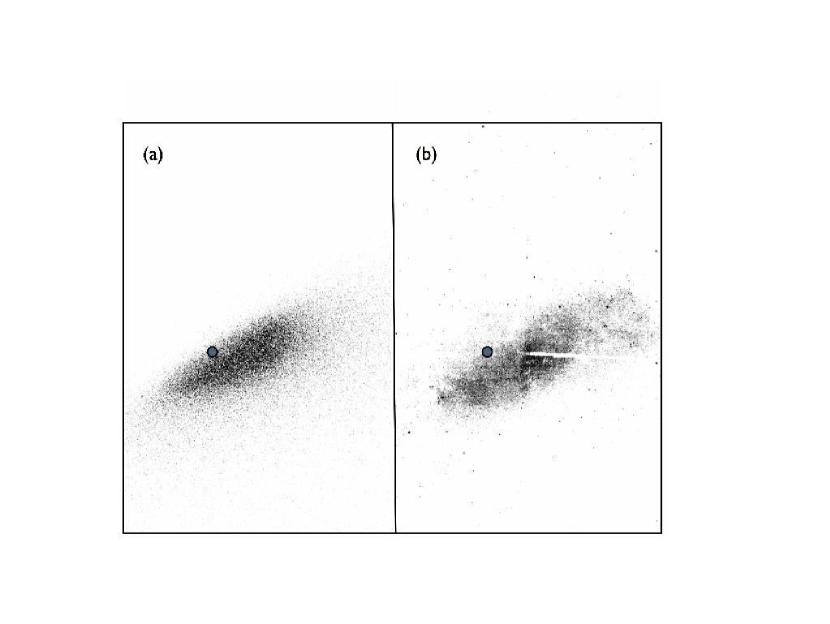
Finally, I explore the effect of changing the adopted position angle of the disk’s line-of-nodes. The initial angle in the models was that measured by van der Marel & Cioni (2001), but another recent measurement produced an angle that is 30∘ larger (Nikolaev et al., 2004). Surprisingly, this difference does not affect the model’s ability to recreate the bar appearance. By changing the bulge position angle from being 10∘ off the line-of-nodes to 45∘, I reproduce the observed appearance (Figure 3; and ). This new geometry helps explain one feature that was not well accounted for in the original models. The circles in Figure 3 represent the center of the LMC as determined from the outer disk isophotes. The observed midpoint of the “bar” along the line-of-nodes is displaced by 15 arcmin toward the northwest, while the stellar density weighted centroid of the model presented here is displaced by 23 arcmin in the same northwesterly direction. In the simulations, at least, this offset from the center is due to the longer line of sight through the bulge to the disk on one side of the LMC center than on the other. The uncertainties in determining a precise LMC center and in the stellar density distribution of the MCPS in this highly crowded region preclude one from inverting the model fits to reach a conclusion on the correct position angle of the line-of-nodes. Nevertheless, is is possible to reproduce the qualitative nature of the observations over the range of observed values for the position angle of the disk’s line-of-nodes. The relative ease with which the general model was able to fit the data despite a large change in the line-of-nodes demonstrates that its ability to produce populations that mimic the observations is not predicated on a special coincidence of paramaters.
3. Discussion and Summary
Although this modeling exercise demonstrates that the LMC might have a stellar bulge that when viewed in projection across an optically thick disk produces a feature that appears to be an off-center, levitating bar, it does not prove that this is indeed the case. The principal differences between a bar and a bulge in the LMC lie in the line-of-sight extent and the vertical (out of the disk plane) velocity dispersion. There are tantalizing observations that suggest that these might both be large, and hence support the bulge hypothesis. First, aside from the different distance measurement to the disk and bar (Nikolaev et al., 2004), a protruding stellar population would help reproduce the larger-than-expected microlensing rates toward the LMC (Zhao & Evans, 2000). Although Zhao & Evans (2000) speculated that the lensing arose from an unrelaxed stellar population that in projection appeared to be a bar, the hypothesized bulge will produce an analogous lensing enhancement and the strong disk-plane extinction would address the spatial asymmetry of the discovered microlensing events (Mancini et al., 2004). Whether this hypothesis survives further, more quantitative, scrutiny depends on the mass and radial profile of the bulge, both of which are unknown, but evaluating models similar to those carried out by Mancini et al. (2004) for this newly proposed geometry is the next step. Alves (2004) has fit King models to the distribution of RR Lyrae stars, which presumably trace an old population, and finds a core radius of kpc (a rough match to the core radii of 0.7 to 1.0 kpc imposed in these models), and a steep decline (exponential scale length of kpc). This measurement might be providing a description of the radial distribution of the bulge population. Second, there is evidence for a kinematically hot stellar component in the LMC (Minniti et al., 2003; Borrisova et al., 2004). Those authors suggest that this component is associated with the stellar halo, but because they observe the high velocity stars at small projected radii (for example, for the Borrisova et al. (2004) study), rather than at radii where only LMC “halo” would exist, these stars may instead be members of a dynamically hot bulge component. The large velocity dispersion ( km/sec; Borrisova et al., 2004) implies a significantly larger vertical scaleheight than that of the disk for this population (the kinematically hottest disk component has a velocity dispersion of 20 km/sec; Meatheringham et al., 1988; van der Marel et al., 2002).
Now I revisit each of the “anomalous” observations discussed in §1 in the context of the bulge plus obscuring disk hypothesis:
1) The apparent bar is off-center because we only see half the bulge, and that half at an odd angle. The general geometrical features of the apparent bar are reproduced well with either the van der Marel & Cioni (2001) or Nikolaev et al. (2004) disk geometry (Figures 1 and 3). The latter does slightly better at fully reproducing the apparent misalignment of disk and bar centroids.
2) The bar and disk appear to be at different distances because the bar stellar sample is biased in favor of stars in front of the disk. The apparent average displacements in distance of the entire bar population relative to the disk center for the models presented in Figures 1c and 3a are 1 and 0.6 kpc, respectively. These are both larger than the measurement presented by Nikolaev et al. (2004) of kpc, but there are various simple ways in which the models could reproduce the published value. For example, if the mid-plane extinction is reduced slightly then some stars behind the disk will enter the sample.
3) The bar major axis is nearly aligned with the disk line-of-nodes because the obscuring sheet cuts through the bulge along the line-of-nodes. As such, the alignment of the projected major axis with the line-of-nodes is less problematic in this obscured bulge model than in an unobscured bar model. For the van der Marel & Cioni (2001) geometry, the bulge major axis in our model is within of the line-of-nodes, but for the Nikolaev et al. (2004) geometry the difference in position angles is . Within the range of observationally allowed line-of-node angles, the model does not require precise alignment between the line-of-nodes and bulge position angle to reproduce the observations.
4) The apparent bar asymmetry arises because the northeastern side is artificially truncated by the obscuring disk (Figure 1).
Despite these successes, the bulge hypothesis is not without challenges. First, the shape of the derived bulge, with a long or intermediate axis out of the plane, is unusual. This geometry is driven by having to reproduce the extent of the bar in the southwestern direction. If the disk plane is actually more highly inclined to the line of sight than in the models, then the bulge would not need to extend as far out of the disk to project as far on the sky. Because the inclination is well determined for the outer disk, such an adjustment in inclination would require the LMC disk to be warped. Second, the bar feature does not appear grossly different in infrared stellar density images (van der Marel, 2001). For extinction to strongly affect the 2m isopohotes would require an optical extinction 10 (; Cardelli, Clayton, & Mathis, 1989). Such a large, rather uniform extinction appears to be unlikely. Again, a more highly inclined disk would help the situation because the path length through the disk would be longer and the extinction would be larger. Lastly, existing reddening measurements (Nikolaev et al., 2004; Zaritsky et al., 2004) do not find a significant tail of moderately extincted () stars. Unfortunately, the Nikolaev et al. (2004) Cepheid sample is sparse in the region of interest immediately northeast of the bar (consisting of only a few tens of stars), the Zaritsky et al. (2004) photometry is strongly affected by crowding in the inner LMC, and the extinction may be sufficient to eliminate the highly extincted stars from these samples in the first place.
How can we make further progress in determining whether the obscured bulge hypothesis is correct? A complete kinematic survey of the LMC from which one could determine whether the dynamically hot component has a similar spatial distribution as the projected bulge and whether, or not, there are kinematic signatures within the disk of a bar potential could provide a definitive test. Zhao et al. (2003) present an extensive kinematic survey, but for this purpose their velocity resolution is too coarse (15 km sec-1) and the bar region is undersampled. Infrared surveys should eventually penetrate through the dust and provide evidence for or against a hidden bulge population. And so, on the basis of the available data, I can only suggest that the conundrums posed by the LMC bar may be resolved by the presence of a triaxial bulge and an optically thick inner disk, and look forward to learning whether this is indeed the case.
References
- Alves (2004) Alves, D. R. 2004, ApJ, 601, 151
- Borrisova et al. (2004) Borrisova, J., Minniti, D., Rejkuba, M., Alves, D., Cook, K.H., and Freeman, K.C 2004, A&A, in press (astro-ph/0405377)
- Cardelli, Clayton, & Mathis (1989) Cardelli, J.A., Clayton, G.C., & Mathis, J.S. 1989, ApJ, 345, 245
- Colin & Athanassoula (1989) Colin, J., & Athanassoula, E. 1989, A&A, 214, 99
- de Vaucouleurs & Freeman (1972) de Vaucouleurs, G., & Freeman, K. C. 1972, Vistas Astron., 14, 163
- Gardiner et al. (1998) Gardiner, L. T., Turfus, C., & Putman, M. E. 1998, ApJ, 507, L35,
- Mancini et al. (2004) Mancini, L., Calchi Novati, S., Jetzer, Ph., & Scarpetta, G. 2004, A&A submitted (astro-ph/0405257)
- Meatheringham et al. (1988) Meatheringham, S.J., Dopita, M.A., Ford, H.C., & Louise, W.B. 1988, ApJ, 327, 651
- Minniti et al. (2003) Minniti, D., Borissova, J., Rejkuba, M., Alves, D.R., Cook, K. H., & Freeman, K. C. 2003, Science, 301, 1508
- Nikolaev et al. (2004) Nikolaev, S., et al. 2004, ApJ, 601, 260
- van der Marel (2001) van der Marel, R. P. 2001, AJ, 122, 1827
- van der Marel & Cioni (2001) van der Marel, R.P., & Cioni, M.-R. L. 2001, AJ, 122, 1807
- van der Marel et al. (2002) van der Marel, R.P., Alves, D.R., Hardy, E., and Suntzeff, N.B. 2002, AJ, 124, 2639
- Zaritsky et al. (2002) Zaritsky, D., Harris, J., Thompson, I.B., Grebel, E.K., & Massey, P. 2002, AJ, 123, 855
- Zaritsky et al. (2004) Zaritsky, D., Harris, J., Thompson, I.B., & Grebel, E.K. 2004, AJ, in press
- Zhao & Evans (2000) Zhao, H.-S. & Evans, N. W. 2000, ApJ, 545, 35
- Zhao et al. (2003) Zhao, H.-S., Ibata, R.A., Lewis, G.F. & Irwin, M.J. 2003, MNRAS, 339, 701