Detection of 21 Centimeter H i Absorption at in a Survey of Radio Continuum Sources
Abstract
We report the detection of a deep broad H I 21 cm absorption system at toward the radio source [HB89] 2351+456 (4C+45.51) at . The H I absorption was identified in a blind spectral line survey conducted at the Green Bank Telescope spanning toward a large sample of radio continuum sources. The H I column density is cm-2, where is the spin temperature and is the continuum covering factor of the absorbing gas. For K, this system is by definition a damped Ly absorption system ( cm-2). The line is unusually broad, with a FWHM of 53 km s-1 and a full span of 163 km s-1, suggesting a physically extended H I gas structure. Radio surveys identify damped Ly systems in a manner that bypasses many of the selection effects present in optical/UV surveys, including dust extinction and the atmospheric cutoff for . The smooth broad profile of this H I 21 cm absorption system is similar to the H I absorption toward PKS 1830211, which suggests that the absorber toward [HB89] 2351+456 is also a gravitational lens and a molecular absorption system. However, very long baseline interferometry and Hubble Space Telescope observations show little evidence for gravitational lensing, and BIMA millimeter observations show no HCO+ () or HCN () absorption down to () in 5 km s-1 channels. Although this radio damped Ly selection technique would include dusty, molecule-rich systems, [HB89] 2351+456 appears to be a “vanilla” H I 21 cm absorber.
1 Introduction
Identification of damped Ly (DLA) systems, quasar absorption line systems with neutral hydrogen column density cm-2, has historically been an optical/UV pursuit. DLA catalogs suffer from the selection effects associated with an optically selected sample of redshifted Ly lines, including the atmospheric cutoff at , the requirement of a strong UV continuum, and the potential loss of dusty DLA systems. To overcome the UV atmospheric cutoff, low ionization absorption lines such as Mg II 2796, 2803 and Fe II 2600 provide proxies for DLA systems that can subsequently be observed in the Ly line from space or in the H I 21 cm line from the ground (Rao & Turnshek, 2000; Lane, 2000). The H I 21 cm line, unlike Ly, does not saturate, is unaffected by dust, and can occasionally offer multiple lines of sight through the absorption system. H I 21 cm absorption is a prerequisite for molecular absorption, so a dust-independent DLA selection method maximizes the likelihood of adding to the very small sample of extragalactic molecular absorption systems. These systems provide insight into the physical state of the cold interstellar medium in galaxies and can constrain the cosmic evolution of physical constants (e.g., Wiklind & Combes, 1997; Darling, 2004; Kanekar, Chengalur, & Ghosh, 2004). While there does not appear to be a dominant undetected population of high column density DLA systems compared to the DLA population overall, optically selected samples may exclude a large fraction of the dusty absorption line systems that do exist (Carilli et al., 1998; Ellison et al., 2001), thereby significantly diminishing the likelihood of identifying molecular absorption systems.
Traditional approaches to H I 21 cm observations of DLA systems have focused on identifying the radio line toward optically identified systems of known redshift (e.g., Carilli et al., 1996), although there have also been “blind” narrow instantaneous bandwidth surveys for intervening H I absorption and surveys for intrinsic absorption in quasars (e.g., Brown & Roberts, 1973; Carilli et al., 1998). New radio astronomy facilities equipped with broadband receivers and high resolution spectrometers now offer the opportunity to conduct line searches for DLA systems in a manner similar to traditional optical/UV DLA surveys, spanning large redshift intervals with high spectral resolution. For example, the Green Bank Telescope111The National Radio Astronomy Observatory is a facility of the National Science Foundation operated under cooperative agreement by Associated Universities, Inc. (GBT) offers continuous frequency coverage from 290 to 1420 MHz (–3.9 in H I), large instantaneous redshift coverage, and high velocity resolution (e.g., and km s-1 at 800 MHz).
We have conducted a DLA survey toward strong radio sources at the GBT at 800 MHz spanning the redshift range –1.10 with 5 km s-1 resolution that is sensitive to all DLA systems. We select sources with predicted 780 MHz flux density Jy, as interpolated from 1.4 GHz White & Becker (1992) and 365 MHz Douglas et al. (1996) measurements. This is not a perfect radio survey: we also require sources to have , which biases the sample toward systems with optical identifications and measurable lines.
We report the first detection of the Green Bank DLA survey, a deep broad H I absorption system at toward the radio source [HB89] 2351+456 (hereafter 2351+456, but also known as 4C+45.51, B3 2351+456, NVSS J235421+455304, and WMAP 074, among others). To investigate the nature of this absorption system, we present BIMA millimeter observations of HCO+ and HCN. We also reexamine published optical spectra and infrared photometry and find that the H I absorption system provides new interpretations of observed properties of 2351+456. This Letter assumes the concordance cosmology: km s-1 Mpc-1, , and .
2 Observations
2.1 Green Bank Telescope
We observed 2351+456 at 773.75 MHz spanning 192.5 MHz at the GBT on 2004 January 26. We observed four 50 MHz IFs with 2.5 MHz overlap in two linear polarizations, spanning the range 677.5–870 MHz or –1.10. Each bandpass was broken into 8192 6.1 kHz channels, but adjacent channels in the autocorrelation spectrometer are not independent and the effective spectral resolution is 12.2 kHz or 4.7 km s-1 at the band center (). Fast sampling (1.5 s data records) was used to facilitate radio frequency interference (RFI) excision. Observations of 2351+456 include a single 5 minute position-switched observation and a 25 minute on-source scan.
An H I absorption line was identified at 798.2 MHz () in individual 1.5 s records during observations. We find no evidence for RFI contamination of the detected 21 cm line, and we find no evidence that the line is an RFI signal in the off-source scan or an out-of-band harmonic; the HI absorption line is clearly visible in individual records, and this line is not seen in any other program source.
Records were individually calibrated and bandpasses flattened using the winking calibration diode. The 25 minute on-source scan was calibrated in a position-switched mode using the 5 minute off-source scan at the cost of added noise. A 25 minute scan on [HB89] 2338+042 observed during the same session as 2351+456 was calibrated in an identical manner as a template for subtraction of the feed resonance from the 2351+456 spectrum (Figure 1, inset). A least-squares fit of the template spectrum to the 2351+456 spectrum in line- and RFI- free regions indicated that a small shift (0.073 Jy) and scaling (0.975) was adequate to fit the resonance in 2351+456. We subtracted the shifted and scaled template from the 2351+456 spectrum to obtain a resonance and baseline subtracted spectrum. A polynomial baseline was subtracted from a fit of 5 MHz centered on the H I line to remove bandpass ripples of order 2 MHz (the total span plotted in Figure 1 is 1.6 MHz). We reached a typical rms noise of 4 mJy in 6.1 kHz (2.3 km s-1) channels. All data reduction was performed in AIPS++.222The AIPS++ (Astronomical Information Processing System) is freely available for use under the Gnu Public License. Further information may be obtained from http://aips2.nrao.edu
2.2 BIMA HCO+ and HCN Observations
We observed 2351+456 in the HCO+ (178.3751 GHz) and HCN (177.2611 GHz) lines redshifted to 100.2344 and 99.60678 GHz, respectively (assuming ), at the Berkeley-Illinois-Maryland Association (BIMA; Welch et al. 1996) array at Hat Creek on 2004 April 9 and 18. We used correlator mode 6, which provides four independent spectral windows. Two of them are 100 MHz wide with a spectral resolution MHz ( km s-1), and two are 200 MHz wide with a resolution MHz ( km s-1). The two high-resolution windows were partially overlapped and centered on each expected absorption feature, covering a velocity range of km s-1 around it. The two low-resolution windows extended this velocity coverage to km s-1.
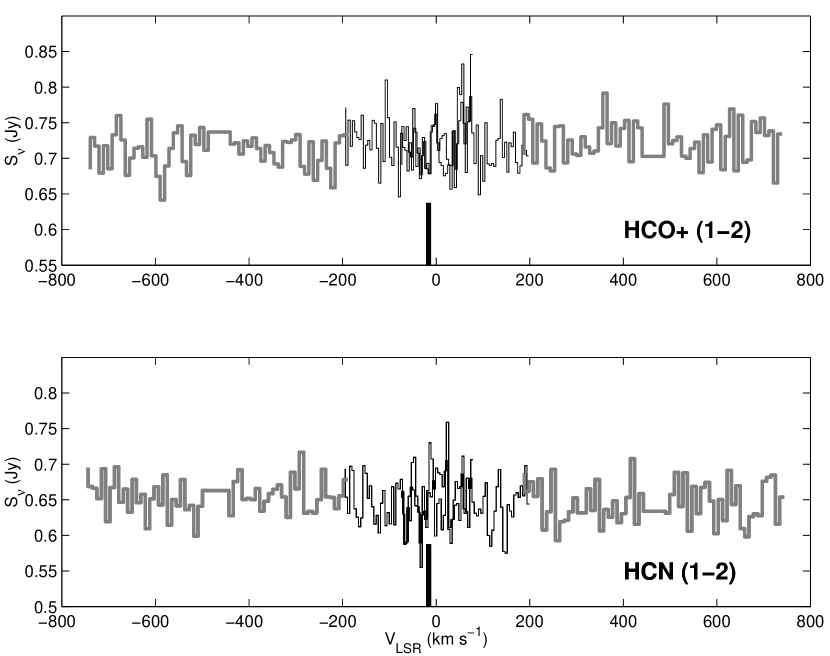
Observations of a passband calibrator were interleaved (a few minutes every hour) with the science observations and used to remove passband features. During the first track on April 9, we used QSO 0102+584, which was considerably weaker ( Jy) than predicted by the flux database and introduced some noise into the passband correction. For the second track on April 18, we switched to QSO 0136+478, which yielded better results ( Jy). The passband-corrected spectra, which are featureless, are shown in Figure 2. The sensitivities achieved after passband correction are mJy in the high resolution region. Like most flat spectrum sources, 2351+456 appears to be variable, with a flux density of mJy on April 9 and mJy on April 18.
3 Results and Analysis
Confusion, coupled with RFI-induced effects like slopes and steps in the spectral bandpass, indicates that the GBT spectral baseline does not accurately reflect the continuum emission from 2351+456. Within the 15.5′ (FWHM) GBT primary beam at 800 MHz, there is a contribution of roughly 100 mJy at 1.4 GHz from sources of unknown spectral index (Condon et al., 1998). We thus interpolate the 800 MHz flux density from previous interferometric measurements: Jy at 1.4GHz (Condon et al., 1998) and Jy at 365 MHz (Douglas et al., 1996) indicate a flat-spectrum source with (). Hence, at 798.2257 MHz, the expected (and henceforth assumed) flux density is Jy in the absence of variability (but see, e.g., Aller, Aller, & Hughes (2003)).
Fits to the H I profile (Figure 1) require a minimum of seven Gaussian components to obtain residuals consistent with the spectral noise. These fits are not presented because they are not unique and thus not physical. The seven component requirement and the width of the absorption system indicates that the H I profile is a highly blended, perhaps continuous, ensemble of gas complexes sampling a galaxy-scale range of velocities and physical dimensions.
The peak optical depth in the H I line is 0.320 (545.0 mJy) at . We use the most conservative error estimate of the redshift of channel in lieu of unique reliable Gaussian fits to the profile. The integrated optical depth is 13.05 km s-1, and the column density is thus cm-2, where is the spin temperature in K and is the covering factor of the continuum source by the absorbing gas. The absorption system qualifies as a DLA system ( cm-2) for K. Typical values span –1000 K (Kanekar & Chengalur, 2003), indicating a column density from to cm-2 for . The FWHM of the absorption line is 53 km s-1, and the total span of absorption is 163 km s-1. Since the line is unusually broad and the width is due to bulk velocities rather than to thermal kinetic broadening, the usual constraint on the kinetic temperature K is not physical.
In the BIMA spectra, no HCO+ () or HCN () lines were detected with (105 mJy) at significance in 5 km s-1 channels (Figure 2). In contrast, the four known molecular absorption systems show large optical depths, from in HCO+ () and in HCN () toward B3 1504+377 to saturated lines toward PKS 1830211 and B0218+357 (Wiklind & Combes, 1995, 1996a, 1996b, 1997). The limit on HCO+ absorption toward 2351+456 corresponds to cm-2, which translates into the limit cm-2 assuming a gas kinetic temperature of 50 K and (Liszt & Lucas, 2000). For K, we obtain cm-2, which is equivalent to for a Galactic dust-to-gas ratio.
4 Discussion
The nature of the absorption system toward 2351+456 remains unclear. The H I 21 cm absorption profile shows striking similarities in width and lack of prominent substructure to the absorption toward PKS 1830211 (Chengalur, de Bruyn, & Narasimha, 1999). The absorber toward PKS 1830211 is both a gravitational lens and a molecular absorber (Subrahmanyan et al., 1990; Wiklind & Combes, 1996a), and the unusually broad and smooth H I profile likely represents illumination of a significant fraction of an H I spiral disk by a background radio source magnified by gravitational lensing (Patnaik, Muxlow, & Jauncey, 1993; Chengalur, de Bruyn, & Narasimha, 1999). But BIMA observations show that the 2351+456 absorber does not have strong molecular absorption lines, and existing VLBI and Hubble Space Telescope (HST) observations can explore the possibility of gravitational lensing of 2351+456.
VLBI observations of 2351+456 at 18 cm (1664 MHz) show a –30 mas resolved core plus a one-sided jet morphology with total extent mas (Polatidis et al., 1995). There is no clear evidence of a second image on scales of tens to mas in the VLBI map (although there is a tantalizingly strong knot of emission mas from the core that could be a weak counterimage), and an archival -band (F814W) HST WFPC2 image shows no second image on scales mas. Although scales relevant to gravitational lensing are probed by HST images and VLBI maps from mas to arcseconds, no clear companion images have been identified. We conclude that 2351+456 is unlikely to be gravitationally lensed.
The physical scale subtended by the 18 cm VLBI core at the absorber redshift is 0.15–0.22 kpc, but this scale is likely to be larger at 37.5 cm (800 MHz). The absorption line width strongly suggests that the H I absorption arises from a unusually large physical scale, of order the size of the illuminating “beam” of the VLBI core. The high frequency picture of 2351+456 is dramatically different: Lister (2001) shows that 2351+456 at 43 GHz subtends only mas. The millimeter illuminating beam is thus only pc at the absorber redshift, which can potentially explain the lack of molecular absorption in the BIMA spectra. Although the scales probed at centimeter wavelengths are large, the millimeter scales are in the “pencil beam” regime that makes the detection of molecular absorption so rare and difficult.
Previous optical observations of 2351+456 may offer some clues to the nature of the H i absorption system at . Based on the 1987 September 15 optical spectrum of 2351+456, which shows a dramatic continuum increase from 1986 October 26 but preserves flux in emission lines and the equivalent width in the Mg II absorption line at (Lawrence et al., 1996), we identify additional absorption lines consistent with two absorbing complexes. One is roughly at the redshift of the quasar (), showing possible absorption in Ly, Fe II 2344, 2374, 2382, 2586, and 2600, Mg II 2796 and 2803, and Mg I 2852 (many of these are blended). The other is consistent with the redshift of the H I detection at , with absorption in Fe II 2344 and 2600, Mg II 2796 and 2803, and possibly H and H (many of these are blended, and H roughly coincides with Fe II 2586 at , so one is likely a spurious identification). Some of these absorption lines can also be seen in the Stickel & Kühr (1993) spectrum. Rao & Turnshek (2000) show that half of absorption systems with Mg II 2796 and Fe II 2600 equivalent widths greater than 0.5 Å are DLA systems and that low redshift DLA systems that do not meet these requirements are rare (only one is known). Hence, although a higher resolution spectrum is required to extract reliable absorption redshifts and equivalent widths, the presence of Mg II and Fe II absorption lines is consistent with the identification of a DLA system at .
The absorption system toward 2351+456 may also have been mistakenly identified as the host galaxy of the quasar itself. Kukula et al. (2001) modeled the HST NICMOS -band surface brightness of 2351+456 and obtained a half light radius of 18.5 kpc (corrected to the concordance cosmology) for the quasar host assuming an model (de Vaucouleurs, 1948). If the extended emission is in fact from the intervening absorber at , then the half light radius of the absorber is 16.2 kpc. If this is the case, then a de Vaucouleurs profile may not be an appropriate parameterized fit.
5 Conclusions
We have identified a DLA system toward 2351+456 via the H I 21 cm absorption line. We identify Mg II 2796 and 2803 and Fe II 2344 and 2600 lines in the optical spectrum of Lawrence et al. (1996), in support of the H I 21 cm absorption line at being a DLA system. Although the H I absorption line profile of 2351+456 is remarkably similar to the profile of PKS 1830211, the DLA system toward 2351+456 does not appear to be either a molecular absorption system or a gravitational lens. This new detection provides a proof-of-concept for blind H I surveys with broadband radio receivers and backends that offer a new dust- and atmosphere-independent method to identify DLA systems. Broadband radio surveys for DLA systems are perhaps key to identifying exceptionally rare molecular absorption systems and may identify gravitational lenses as well.
References
- Aller, Aller, & Hughes (2003) Aller, M. F., Aller, H. D., & Hughes, P. A. 2003, ApJ, 586, 33
- Brown & Roberts (1973) Brown, R. L. & Roberts, M. S. 1973, ApJ, 184, L7
- Carilli et al. (1996) Carilli, C. L., Lane, W., de Bruyn, A. G., Braun, R., & Miley, G. K. 1996, AJ, 112, 1317
- Carilli et al. (1998) Carilli, C. L., Menten, K. M., Reid, M. J., Rupen, M. P., & Yun, M. S. 1998, ApJ, 494, 175
- Chengalur, de Bruyn, & Narasimha (1999) Chengalur, J. N., de Bruyn, A. G., & Narasimha, D. 1999, A&A, 343, L79
- Condon et al. (1998) Condon, J. J., Cotton, W. D., Greisen, E. W., Yin, Q. F., Perley, R. A., Taylor, G. B., & Broderick, J. J. 1998, AJ, 115, 1693
- Darling (2004) Darling, J. 2004, ApJ, in press (astro-ph/0405240)
- de Vaucouleurs (1948) de Vaucouleurs, G. 1948, Ann. Astrophys., 11, 247
- Douglas et al. (1996) Douglas, J. N., Bash, F. N., Bozyan, F. A., Torrence, G. W., & Wolfe, C. 1996, AJ, 111, 1945
- Ellison et al. (2001) Ellison, S. L., Yan, L., Hook, I. M., Pettini, M., Wall, J. V., & Shaver, P. 2001, A&A, 379, 393
- Kanekar & Chengalur (2003) Kanekar, N. & Chengalur, J. N. 2003, A&A, 399, 875
- Kanekar, Chengalur, & Ghosh (2004) Kanekar, N., Chengalur, J. N., & Ghosh, T. 2004, Phys. Rev. Lett., 93, 051302
- Kukula et al. (2001) Kukula, M. J., Dunlop, J. S., McLure, L., Miller, L., Percival, W. J., Baum, S. A., & O’Dea, C. P. 2001, 326, 1533
- Lane (2000) Lane, W. M. 2000, Ph.D. thesis, Univ. Groningen
- Lawrence et al. (1996) Lawrence, C. R., Zucker, J. R., Readhead, A. C. S., Unwin, S. C., Pearson, T. J., & Xu, W. 1996, ApJS, 107, 541
- Lister (2001) Lister, M. L. 2001, ApJ, 562, 208
- Liszt & Lucas (2000) Liszt, H. & Lucas, R. 2000, A&A, 355, 333
- Patnaik, Muxlow, & Jauncey (1993) Patnaik, A. R., Muxlow, T. W. B., & Jauncey, D. L. 1993, Gravitational Lenses in the Universe, Proceedings of the 31st Liege International Astrophysical Colloquium (LIAC 93), Eds J. Surdej, D. Fraipont-Caro, E. Gosset, S. Refsdal, & M. Remy. Liege: Universite de Liege, Institut d’Astrophysique, 363
- Polatidis et al. (1995) Polatidis, A. G., Wilkinson, P. N., Xu, W., Readhead, A. C. S., Pearson, T. J., Taylor, G. B., & Vermeulen, R. C. 1995, ApJS, 98, 1
- Rao & Turnshek (2000) Rao, S. M. & Turnshek, D. A. 2000, ApJS, 130, 1
- Stickel & Kühr (1993) Stickel, M. & Kühr, H. 1993, A&AS, 101, 521
- Subrahmanyan et al. (1990) Subrahmanyan, R., Narasimha, D., Pramesh-Rao, A., & Swarup, G. 1990, MNRAS, 246, 263
- Welch et al. (1996) Welch, W. J. et al. 1996, PASP, 108, 93
- White & Becker (1992) White, R. L. & Becker, R. H. 1992, ApJS, 79, 331
- Wiklind & Combes (1995) Wiklind, T. & Combes, F. 1995, A&A, 299, 382
- Wiklind & Combes (1996a) Wiklind, T. & Combes, F. 1996, Nature, 379, 139
- Wiklind & Combes (1996b) Wiklind, T. & Combes, F. 1996, A&A, 315, 86
- Wiklind & Combes (1997) Wiklind, T. & Combes, F. 1997, A&A, 328, 48