The Luminous Erupting Dwarf Nova CV1 in the Dense Globular Cluster M15111Based on observations with the NASA/ESA Hubble Space Telescope, obtained from the Data Archive at the Space Telescope Science Institute,which is operated by the Association of Universities for Research in Astronomy, Inc., under NASA contract NAS5-26555. ,222We acknowledge with thanks the variable star observations from the AAVSO International Database contributed by observers worldwide and used in this research.
Abstract
Despite decades-old predictions of the expected presence of dozens of cataclysmic variables in the cores of globular clusters, the number of irrefutable, out-bursting candidates is still barely a handful. Using multi-wavelength, multi-epoch HST images we have produced outburst and quiescence light curves for the recently discovered large amplitude variable CV1 in the core of the post core-collapse globular cluster M15. The light curves and blue colors show that the object is a bona fide dwarf nova, with absolute magnitude at maximum light rivaling that of the most luminous known dwarf novae.
1 Introduction
The realization that X-ray binaries are 100-1000 times overabundant in Galactic globular clusters relative to the rest of the Milky Way (Clark, 1975; Katz, 1975) was crucial in understanding that intimate and tightly coupled relationships exist between stellar evolution and stellar dynamics. Among the predictions of this theory is the expectation that many white dwarf/red dwarf binaries should form via two-body tidal capture (Fabian et al., 1975) and/or three-body exchange captures (Hut, 1983; Hut & Paczynski, 1984). Some of these binary systems will be in very close orbits, such that the red dwarf fills its Roche lobe. This leads to the transfer of mass, via an accretion disk, from the red dwarf to the white dwarf component – in other words, to cataclysmic variables (CVs). Yet searches for the many dozens of expected erupting CVs have typically found zero to two dwarf novae in clusters searched from the ground (Shara et al., 1994; Ó Tuairisg et al., 2003) and with the Hubble Space Telescope (HST) (Shara et al., 1996; Knigge et al., 2002).
Recently, Chandra X-ray Observatory and HST observers claimed the detections of dozens of cataclysmic variable (CV) candidates in the cores of several globular clusters. These candidates are X-ray bright in Chandra observations (Grindlay et al., 2001) or UV-bright in HST observations (Knigge et al., 2002) and clustered in the cores of their host clusters. However, only zero or one of these UV or X-ray sources per cluster has yet exhibited the degree of variability (2 magnitude or larger outbursts) that originally led to labeling these variables as “cataclysmic.”
About half of all the CVs known in the solar neighborhood exhibit large amplitude outbursts — the Dwarf Novae. In the absence of spectroscopic confirmation (very challenging to obtain) and/or large amplitude outbursts, the X-ray and UV-bright CV candidates in globular clusters may remain just that: candidates, for the foreseeable future. It is thus important to fully substantiate every claim of large amplitude variability in globular cluster stars. Only a few irrefutable, spectrographically confirmed CVs (e.g. Grindlay et al. (1995); Edmonds et al. (1999)), and cataclysmics confirmed by slitless far-UV spectroscopy (Knigge et al., 2003; Knigge, 2004), (including 2 good candidates in Edmonds et al. (2003)) are known in globular clusters. A recent addition to this exclusive club of erupting CVs is the variable labelled V1 in the dense globular cluster M15 (Charles et al. 2002, hereafter C02).
M15 is one of the densest globular clusters in the Galaxy. It has probably undergone core collapse and almost certainly contains a significant amount of non-luminous matter in its core (Baumgardt et al., 2003). The cluster hosts the remarkable low mass X-ray binary (LMXB) 4U2127+119, whose optical counterpart (Aurière et al., 1984) is the eclipsing binary AC211 (Ilovaisky et al., 1987). M15 has been extensively imaged by HST, with which observers have discovered a sharp central density cusp (Guhathakurta et al., 1996), very blue stars and mass segregation in the core (De Marchi et al., 1996), Blue Stragglers (Yanny et al., 1994) and optically identified millisecond pulsars (Anderson et al., 1990)—all indicators of strong dynamical interactions. If confirmed as an erupting CV, the candidate dwarf nova (C02) would be one of the rarest of exotic globular cluster stars, and an object worthy of further, intensive study. In anticipation fo our key result — that V1 really is an erupting dwarf nova – we will hereafter refer to it as CV1. This is to avoid confusion with the nomenclature used in the Sawyer-Hogg (1973) catalog of variables in globular clusters, recently updated by Clement et al. (2001). There is an entirely different variable star labeled V1 (in M15) in these catalogs.
2 The M15 Dataset
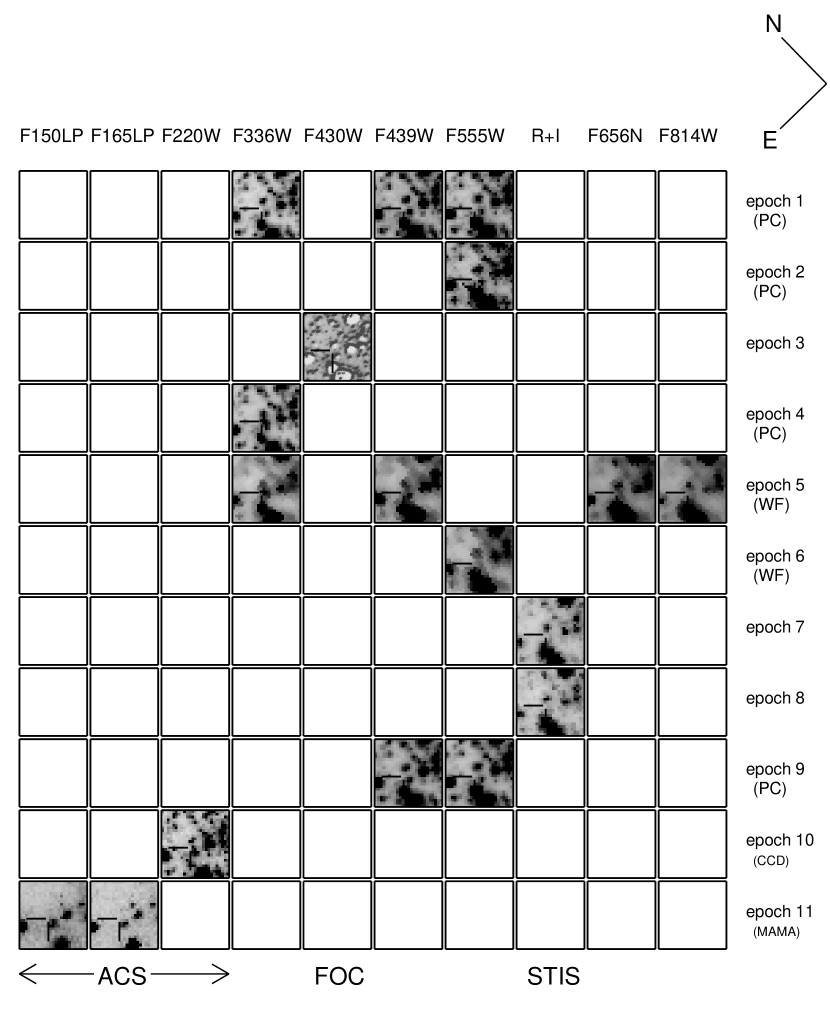
M15 has been imaged with the HST Wide Field Planetary Camera (WFPC2) during 6 epochs, during one epoch with the HST Faint Object Camera (FOC), two epochs using the HST Space Telescope Imaging Spectrograph (STIS), and finally with the HST Advanced Camera for Surveys (ACS) for two epochs. The wide range of filters and long time base of the observations (a decade) are particularly useful in characterizing variable stars. We downloaded all available images of M15 from the HST archive, and summarize the dataset in Table 1 and Figure 1. The variable is seen in eruption in the 4th and 5th epochs (see Figure 2), and in quiescence (below our frame limits) in the 1st, 2nd, 3rd, 6th, 7th, 8th, 9th, and the 11th epochs. It is detected in the near UV in the 10th epoch, possibly in transition between eruption and quiescence. There is Planetary Camera (0.044”/ pixel)coverage of CV1 in the 1st, 2nd, 4th and ninth epochs. The 5th and 6th epochs have only WF2 (hence lower resolution, 0.1”/pixel) coverage. The 10th and 11th epochs were taken with ACS for our own survey for UV variables. Thumbnail images of the vicinity of CV1 in most of the filters used in each epoch are presented in Figure 1; the variable is indicated in each frame.
2.1 Photometry of the Dwarf Nova Candidate
All of the WFPC2, ACS, and FOC data were obtained from the STScI Data Archive while the STIS images were still in the proprietary stage. All images were subject to the normal STScI on-the-fly recalibration pipeline software. The individual WFPC2 images were combined using the “Montage2” routine contained within the stand-alone DAOphot package. These frames were run through DAOphot’s matching program “DAOmaster” to derive the subpixel frame-to-frame shifts and thereby register all images to the first image of the first epoch. These shifts were passed to Montage2, which produced a single, sky subtracted, high signal-to-noise image for each epoch and filter. A variability search was performed by blinking rapidly through groups of four of the eleven epochs to look for any subtle changes in the appearance of the stellar field. Dwarf novae should rise from invisibility to easily detectable in the timeframe defined by the observations. Brightening from previously empty regions of the sky is easily seen. Aside from CV1 and the three other object mentioned in C02, no other DN-like behavior was observed.
Accurate measurement of the dwarf nova candidate’s brightness is nontrivial because it is crowded between two neighboring stars. We have found that the most accurate way to carry out photometry on CV1 is to use an aperture large enough to encompass CV1 and its two companions. We measured the summed brightness of the two companions in epoch 1 (when CV1 is invisible), and verified in subsequent epochs (with CV1 in quiescence) that these two stars do not vary. We subtracted off the brightness of these two companions in subsequent epochs. All of the results presented in this paper utilize aperture photometry while accounting for the varying platescales between instruments.
The long-term light curve of CV1 is shown in Figure 3. We have assumed a distance modulus to M15 of 15.0 (McNamara et al., 2004) and thereby transformed to the absolute magnitudes displayed in the Figure. The observations which use the ACS, FOC, and STIS instruments (with the F150LP, F165LP, F220W, F430W, and F28X50LP filters) are calibrated to the ST magnitude system, while the WFPC2 magnitudes are in the Vega system. Vega zeropoints are only available for the WFPC2 filters, and so the ACS, FOC and STIS photometry was left in the ST system. Reddening corrections have been imposed on the photometry using a reddening value for M15 of (Cox, 2000). Using this value, the reddening corrections in the Figs. 3 and 5 were , , and for the F220W, F336W, and F439W filters, respectively. Similar reddening corrections, appropriate for each band, were applied to the derived platelimits in Fig. 3. CV1 was fainter than the WFPC2 frame limit corresponding to absolute magnitude in each of the April 1994 and August 1994 images. The variable reached maximum brightness as seen in the F336W filter on 26 October 1994, at absolute magnitude +1.5. It was next imaged in December 1998 for seven consecutive days in multiple filters, when it was also in eruption. We have assembled the photometry for every available image during this week in Figure 4. There are indications that the variable was dimming towards the end of this epoch. CV1 was below our detection threshold in the remaining epochs, except for a detection in the near UV with the F220W filter on ACS on 27 October 2003.
3 The Eruptions of CV1
Charles et al (2002) discovered CV1 in eruption in U band (F336W) HST PC images of October 1994 (seen in Figure 1 as epoch 4). They predicted that the object is blue, and suggested (since X-ray transients erupt only rarely) that CV1 is much more likely to be a dwarf nova than an X-ray transient.
The December 1998 images (epoch 5) all have CV1 on the (lower resolution) HST WF. CV1 is somewhat blended with its nearest neighbors, but careful measurement of the position of CV1 (see also Figure 2) shows that it is resolved and seen in eruption in F336W during the 1998 observations (contrary to the claim by C02). Comparison of the F336W and F439W images of CV1 in this epoch (Figure 1) clearly show that CV1 is very blue, with as predicted by C02. The light curve (and peak eruption luminosity) of CV1 shown in Figures 3 and 4 are very similar to the typical eruption light curve and luminosity of the prototypical dwarf nova SS Cygni centered on Julian Date 24501226, shown in Figure 5. The color is also similar to that of SS Cyg (Hopp & Wolk, 1984) in outburst. The apparently significant flickering seen in the F502N and the H images (Figure 4) is often seen in erupting dwarf novae.
SS Cygni erupts, on average, every 40 days, and is brighter than minimum light for 16 days during this time (Szkody & Mattei, 1984). It is nearly at maximum for 7 days, followed by a 7 day long decline to minimum. If CV1 is like SS Cygni then we should see it above its minimum state of the time. In fact we detect CV1 in eruption or above minimum in 3 of 11 epochs, or 27% of the time — an entirely consistent result, given the small number statistics.
Finally, CV1 is faint but visible in the F220W images of epoch 10, at absolute magnitude 5.7, about 4.0 magnitudes fainter than in epochs 4 and 5 (ignoring color effects). If we assume a UV color (F220W – then CV1 is still 3.5 magnitudes fainter in epoch 10 than in epochs 4 and 5. We suggest that this is an intermediate state between the star’s quiescent and outburst states. This is because CV1 is NOT seen in the far-UV images (of epoch 11), which should be even more sensitive to UV-bright CVs than the near-UV imagery of epoch 10.
3.1 Is CV1 a Dwarf Nova?
The absolute magnitude of CV1 at maximum light, coupled with its very blue color, similarity in light curve to SS Cygni near maximum, detection in near UV but not in visible light near minimum, relative frequency of eruption (at least twice and possibly three times in eleven independent epochs) and amplitude of eruption (at least 4 and possibly more magnitudes) are all strongly supportive of CV1 being a dwarf nova.
While the case is not perfect (we do not have confirmatory spectra or a full light curve from quiescence to outburst and back again) it is very strong, and we fully concur with the characterization of C02 of CV1 as a dwarf nova.
We predict that an HST outburst spectrum of CV1 would show Balmer absorption lines, but both the crowding of CV1 in particular and the unpredictability of dwarf nova outbursts in general will make this a challenging observation (the for the the imagery of epoch 5 is too low to test this prediction).
While M15 now appears to possess a dwarf nova, it remains the only one known in this dense, massive cluster. The two week duration search for dwarf novae in M15 by Ó Tuairisg et al. (2003) failed to detect any new candidates. The remarkable result that either zero, one or at most two erupting dwarf nova can be found in massive globular clusters seems to be holding true.
References
- Anderson et al. (1990) Anderson, S. B., Gorham, P. W., Kulkarni, S. R., Prince, T. A., & Wolszczan, A. 1990, Nature, 346, 42
- Aurière et al. (1984) Aurière, M., Le Fevre, O., and Terzan, A. 1984 A&A, 138, 415
- Baumgardt et al. (2003) Baumgardt, H., Hut, P., Makino, J., McMillan, S., and Portegies Zwart, S. 2003, ApJ, 582, L21
- Charles et al. (2002) Charles, P.A., Clarkson, W.I. and van Zyl, L. 2002, New Astronomy, 7, 21
- Clark (1975) Clark, G. W. 1975, ApJ, 199, L143
- Clement et al. (2001) Clement, C. M., et al. 2001, AJ, 122, 2587
- Cox (2000) Cox, A. N. (Editor) 2000, “Allen’s Astrophysical Quantities” (New York: Springer-Verlag)
- De Marchi et al. (1996) De Marchi, G., and Paresce, G. 1996, ApJ, 467, 658
- Edmonds et al. (1999) Edmonds, P.D., Grindlay, J.E., Cool, A., Cohn, H., Lugger, P., and Bailyn, C. 1999, ApJ, 516, 250
- Edmonds et al. (2003) Edmonds, P.D.,Gilliland, R.L.,Heinke, C.O., and Grindlay, J.E. 2003, ApJ, 596, 1197
- Fabian et al. (1975) Fabian, A.C., Pringle, J. E., and Rees, M. J. 1975, MNRAS, 172, 15
- Grindlay et al. (1995) Grindlay, J. E., Cool, A. M., Callanan, P. J., Bailyn, C. D., Cohn, H. N., and Lugger, P. M. 1995, ApJ, 455, L47
- Grindlay et al. (2001) Grindlay, J. E.,Heinke, C. O.,Edmonds, P. D., and Murray, S. S. 2001, Science, 292, 2290
- Guhathakurta et al. (1996) Guhathakurta, P., Yanny,B., Schneider, D.P., and Bahcall, J.N. 1996, AJ, 111, 267
- Hopp & Wolk (1984) Hopp, U., and Wolk, C. 1984, Ap&SS, 98, 237
- Hut (1983) Hut, P. 1983, AJ, 88, 1549
- Hut & Paczynski (1984) Hut, P., and Paczynski, B. 1984, ApJ, 284, 675
- Ilovaisky et al. (1987) Ilovaisky, S. A., Auriere, M., Chevalier, C., Koch-Miramond, L., Cordoni, J.-P., and Angebault, L. P 1987, A&A, 179, L1
- Katz (1975) Katz, J. I. 1975, Nature, 253, 698
- Knigge et al. (2002) Knigge, C., Zurek, D. R., Shara, M. M., & Long, K. S. 2002, ApJ, 579, 752
- Knigge et al. (2003) Knigge, C., Zurek, D. R., Shara, M. M., Long, K. S., & Gilliland, R. L. 2003, ApJ, 599, 1320
- Knigge (2004) Knigge, C. 2004, Modern Physics Letters A, in press (astro-ph/0407054)
- McNamara et al. (2004) McNamara, B.J., Harrison, T.E., and Baumgardt, H., 2004, ApJ, 602, 264
- Shara et al. (1994) Shara, M.M., Bergeron, L.E., and Moffat, A.F.J. 1994 ApJ, 429, 767
- Shara et al. (1996) Shara, M.M., Bergeron, L.E., Gilliland, R.L., Saha, A., and Petro, L. 1996 ApJ, 471, 804
- Szkody & Mattei (1984) Szkody, P. & Mattei, J. A. 1984, PASP, 96, 988
- Ó Tuairisg et al. (2003) Ó Tuairisg, S., Butler, R.F., Shearer, A., Redfern, R.M., Butler, D., and Penny, A.2003, MNRAS, 345, 960
- Warner et al. (1995) Warner, B. 1995, Cambridge Astrophysics Series, Vol. 28 “Cataclysmic Variable Stars” (Cambridge: Cambridge University Press)
- Yanny et al. (1994) Yanny, B., Guhathakurta, P., Bahcall, J.N., and Schneider, D.P. 1994, AJ, 107, 1745


| Epoch | PI/Prog # | F150LP | F165LP | F220W | F336W | F430W | F439W | F555W | R+I | F656N | F814W |
|---|---|---|---|---|---|---|---|---|---|---|---|
| ACS | ACS | ACS | WFPC2 | FOC | WFPC2 | WFPC2 | STIS | WFPC2 | WFPC2 | ||
| 1: 04/07/94 | Yanny/5324 | 2 PC200s | 2 PC80s | 4 PC32s | |||||||
| 2: 08/30/94 | Bahcall/5687 | 2 PC400s | |||||||||
| 3: 09/27/94 | King/5301 | 12021s | |||||||||
| 4: 10/26/94 | Westphal/5742 | 11 PC5000s | |||||||||
| 5a: 12/15/98 | Bond/6751 | 9 WF207s | 9 WF180s | 6 WF3820s | 9 WF126s | ||||||
| 5b: 12/16/98 | ”” | 1 WF23s | 1 WF20s | 1 WF1400s | 1 WF14s | ||||||
| 5c: 12/17/98 | ”” | 1 WF23s | 1 WF20s | 1 WF1400s | 1 WF14s | ||||||
| 5d: 12/18/98 | ”” | 1 WF23s | 1 WF20s | 1 WF1400s | 1 WF14s | ||||||
| 5e: 12/19/98 | ”” | 1 WF1700s | |||||||||
| 5f: 12/20/98 | ”” | 1 WF23s | 1 WF20s | 1 WF14s | |||||||
| 5g: 12/22/98 | ”” | 1 WF23s | 1 WF20s | 1 WF1700s | 1 WF14s | ||||||
| 6: 08/31/99 | Van Altena/7469 | 12 WF312s | |||||||||
| 7: 10/21/99 | Van der Marel/8262 | 48s | |||||||||
| 8: 10/22/01 | Van der Marel/8262 | 24s | |||||||||
| 9: 04/05/02 | McNamara/9039 | 4 PC160s | 12 PC192s | ||||||||
| 10: 10/27/03 | Knigge/9792 | 52900s | |||||||||
| 11: 11/13/03 | ”” | 32410s | 22500s |