Large Scale CO and [C I] emission in the Ophiuchi Molecular Cloud
Abstract
We present a comprehensive study of the Ophiuchi molecular cloud that addresses aspects of the physical structure and condition of the molecular cloud and its photodissociation region (PDR) by combining far-infrared and submillimeter-wave observations with a wide range of angular scale and resolution. We present 1600 square arcminute maps (2.3 sq. pc) with 0.1 pc resolution in submillimeter CO and [C I] line emission from the Antarctic Submillimeter Telescope and Remote Observatory (AST/RO), and pointed observations in the CO and [C I] lines. Within the large scale maps, smaller spectral line maps of 3000 A.U. resolution over 90 square arcminutes (0.2 sq. pc) of the cloud in CO, CS, HCO+ and their rare isotopomers are made at the Heinrich Hertz Submillimeter Telescope Observatory (HHT) in Arizona. Comparison of CO, HCO+, and [C I] maps with far-infrared observations of atomic and ionic species from the Infrared Space Observatory (ISO), far-infrared and submillimeter continuum emission, and near-infrared H2 emission allows clearer determination of the physical and chemical structure of the Oph photodissociation region (PDR), since each species probes a different physical region of the cloud structure. Although a homogeneous plane parallel PDR model can reproduce many of the observations described here, the excitation conditions needed to produce the observed HCO+ and [O I] emission imply inhomogeneous structure. Strong chemical gradients are observed in HCO+ and CS; the former is ascribed to a local enhancement in the H2 ionization rate, the latter is principally due to shocks. Under the assumption of a simple two component gas model for the cloud, we find that [C II] and [C I] emission predominantly arises from the lower density envelopes (103 to 104 cm-3) that surround denser cloud condensations, or “clumps”. The distribution of [C I] is very similar to C18O, and generally consistent with illumination from the “far” side of the cloud. A notable exception is found at the the western edge of the cloud, where UV photons create a PDR viewed “edge-on”. The abundance of atomic carbon is accurately modeled using a radiation field that decreases with increasing projected distance from the exciting star HD 147889 and a total gas column density that follows that of C18O, decreasing toward the edges of the cloud. In contrast to conclusions of other studies, we find that no non-equilibrium chemistry is needed to enhance the [C I] abundance. Each spectral line is traced to a particular physical component of the cloud & PDR. Though CO rotational line emission originates from both dense condensations and diffuse envelopes, the millimeter-wave transitions mostly find their origins in envelope material, whereas the high-J submillimeter lines stem more from the dense clumps. Submillimeter HCO+ and infrared [O I] and [C II] emission indicate clump surface temperatures of 50-200K, an ultraviolet radiation field with I, densities of 105 to 106 cm-3, and interior temperatures of K. This study highlights the value of large-scale infrared and submillimeter mapping for the interpretation of molecular cloud physical and chemical structure, and important future observations are highlighted.
Subject headings:
ISM: clouds — ISM: molecules — ISM: atoms — ISM: individual(Rho Oph) — radio lines: ISM1. Introduction
With the advent of millimeter-wave spectroscopy, large-scale surveys of the 115 GHz CO line (e.g. Dame et al. 2001) have revolutionized our understanding of molecular clouds, the birthplaces of all stars. Yet, in terms of clouds’ physical structure and evolution, many elementary questions remain shrouded in uncertainty. Illuminating these fundamental issues will enable a more complete understanding of how stars form (e.g. Bally et al. 1987) in a Galactic context. Sadly, numerous observational challenges frustrate these efforts. For example, optically-thin spectral line diagnostics of CO that probe the contents of the entire cloud entangle all structural cloud components along a given line of sight. One solution to this problem is to constrain one’s view to particular structural regions of a cloud; for example a cloud’s “surface”, where ambient ultraviolet (UV) photons have not been entirely absorbed by dust grains and (e.g. H2) molecules, and therefore illuminate (and dominate) physical structure and chemical processes.
Photodissociation regions (PDR’s) are these boundary interfaces, representing the transition between atomic and molecular phases of the interstellar medium (ISM). Most models invoked to explain the physics in these regions assume molecular clouds of uniform properties surrounding the UV radiation source, typically a neighboring early type star (Tielens and Hollenbach 1985; van Dishoeck & Black 1988; Burton, Hollenbach, & Tielens 1990; Hollenbach et al. 1991; Le Bourlot et al. 1993; Köster et al. 1994; Kaufman et al. 1999). UV photons with energies greater than the hydrogen ionization threshold of 13.6 eV create an H II region surrounding the energetic star(s). UV photons with energy less than this threshold escape from the H II region into an adjacent molecular cloud, where photodissociation of dominant molecules like H2 and CO takes place, as well as photoionization of atoms with an ionization threshold lower than that of hydrogen – such as carbon, which is abundant and ionizes with photon energies as low as 11.26 eV. The combined effect of CO photodissociation and C0 photoionization by UV photons produces a layered structure of C+/C0/CO surrounding the H II region and extending into the molecular cloud. This basic picture of the C+/C0/CO interface structure, as modeled for homogeneous cloud structures, is not in very good agreement with observations of edge-on PDRs (i.e. M17); in general it is unable to account for the extended distribution of [C II] and [C I] emission seen in these regions (Stutzki et al. 1988, Keene et al. 1985). However, models of inhomogeneous photodissociation regions have proven capable of accounting for the extended [C II] and [C I] distribution observed in some PDR’s (Stutzki et al. 1988; Boissé 1990; Tauber & Goldsmith 1990; Howe et al. 1991; Pineau Des Forêts, Roueff, & Flower 1992; Meixner and Tielens 1993 [MT93]; Spaans 1996; Plume et al. 1999). The inhomogeneity, or “clumpiness”, of molecular clouds is well recognized (e.g. Blitz & Williams 1987); it seems only natural that such clouds’ UV-illuminated surfaces should bear similar physical traits.
An ideal observational target for such studies is the Ophiuchi molecular cloud. It is one of the nearest ( 130 pc) and most active star-forming clouds and has a rich and varied environment that provides the observational basis for the current “standard model” of low-mass star formation (Shu 1977; Shu, Adams, & Lizano 1987). The region hosts three hot B-type stars, although HD 147889 appears to dominate the heating and excitation of the cloud’s atomic and molecular “surface” (Liseau et al. 1999). HD 147889 is the most-embedded (EB-V=1.09; A) optically-visible star that has been studied by high resolution ultraviolet and optical spectroscopy; the line of sight passes through the diffuse atomic and molecular “halo” of the Oph cloud (cf. van Dishoeck & de Zeeuw 1984; Crutcher & Chu 1985; Cardelli & Wallerstein 1986). Because of its deep obscuration and periphery to the main molecular cloud, HD 147889 is thought to lie just beyond the molecular cloud, illuminating it from behind. Modeling of the 158 µm [C II] line intensity as a function of projected distance from HD 147889 led Liseau et al. (1999) to the conclusion that the UV-illuminated PDR back surface of the Oph cloud is approximately concave.
Study of such a varied and complicated environment as Oph is challenging. High spectral and angular resolution is required to disentangle the complicated structure of actively star-forming environments, but simultaneously the overall structure of the cloud only becomes apparent with studies of large angular extent. We have attempted to bridge these two disparate extremes by exploiting the powers of far-infrared and submillimeter spectroscopy on both large and small telescopes. In § 2 and § 3, we present and interpret large-scale () maps of the molecular cloud in submillimeter CO and [C I] emission, with 25,000 A.U. (0.1 pc) resolution, from the 1.7-meter Antarctic Submillimeter Telescope and Remote Observatory (AST/RO). The large maps provide a global view of the entire cloud, enhancing the analysis of existing observations, such as those of Liseau et al. (1999) with ISO and large scale submillimeter continuum mapping observations such as Motte et al. (1998) and Johnstone et al. (2000). Regions of special interest are mapped at 3000 A.U. angular resolution in CO, CS, HCO+ and their rare isotopomers from the 10-meter Heinrich Hertz Telescope of the Submillimeter Telescope Observatory (HHT) in Arizona. The distribution of all of these species, and their relevance to the structure of the Oph cloud is discussed. In § 4, the cloud’s photodissociative properties are explored by combining CO, HCO+ and [C I] data with a thorough far-infrared spectroscopic survey of the Oph region using the Infrared Space Observatory (ISO) (Liseau et al. 1999). We use simple one- and two-component models to compute molecular column densities and physical conditions from the sample of observed diagnostic atomic and molecular spectral lines. Finally, we examine the future role of infrared H2 emission as a useful probe of the Oph cloud’s PDR structure and excitation.
2. Presentation of Observations
Several large-scale studies of the Oph cloud have been performed, from millimeter-wave spectral line maps of C18O pioneered by Wilking & Lada (1983), to infrared studies of the embedded stellar cluster such as Barsony et al. (1997), to (sub)millimeter continuum studies, most recently Motte, André & Neri (1998), Wilson et al. (1999), and Johnstone et al. (2000). Liseau et al. (1999) used the Long Wavelength Spectrometer (LWS) on ISO to obtain continuum fluxes and integrated intensities for the far-infrared (FIR) atomic fine-structure lines of [C II](158 µm) and [O I](63 and 145 µm) toward several positions of the Oph cloud and PDR. To enhance the interpretation of these varied studies, we mapped regions to maximize overlap with published data. For example, we chose several east-west strip positions from Liseau et al. (1999) for spectral line mapping. We have also mapped over much of the Oph A cloud core, and toward denser portions of the stellar cluster.
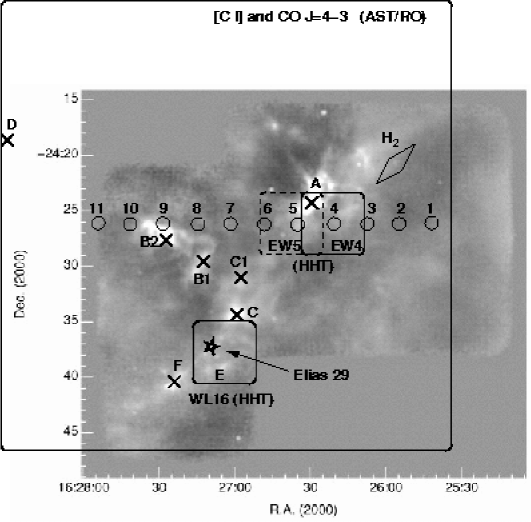
The observations were obtained using the AST/RO telescope at the South Pole, the Heinrich Hertz Telescope (HHT) on Mt. Graham (Arizona), the Caltech Submillimeter Observatory (CSO) on Mauna Kea (Hawaii), and with published data from the Infrared Space Observatory (ISO) (Liseau et al. 1999). These data are summarized in Table 1 and described in detail below. Figure 1 provides an overview of our submillimeter spectral line maps in the overall context of the Oph cloud.
| Position(a)(a)Equatorial coordinates of central positions in epoch J2000: “WL1”= (16h27m01s.5, -24o26′41″7), WL16=(16h27m02s.1, -24o37′25″.5), ISO EW4=(16h26m21s.92, -24o25′40″.4), ISO EW5=(16h26m35s.1, -24o25′40″.9) | Line | Telescope | Map Size | FWHM |
|---|---|---|---|---|
| (′) | (″) | |||
| WL1 | CO | AST/RO | 4040 | 180 |
| CO | AST/RO | 33 | 60 | |
| [C I] | AST/RO | 4040 | 210 | |
| [C I] | AST/RO | 33 | 60 | |
| WL16 | CO | CSO | 55 | 34 |
| C18O | HHT | 55 | 34 | |
| C18O | HHT | 55 | 23 | |
| HCO | HHT | 65 | 28 | |
| ISO-EW4 | C18O | HHT | 55 | 34 |
| C18O | HHT | 55 | 23 | |
| 13CO | HHT | 55 | 34 | |
| CO | HHT | 55 | 33 | |
| HCO | HHT | 66 | 28 | |
| H13CO | HHT | 1.51.5 | 28 | |
| HCO | HHT | 55 | 21 | |
| CS | HHT | 55 | 34 | |
| CO | AST/RO | 33 | 60 | |
| [C I] | AST/RO | 33 | 60 | |
| [O I] (b)(b)Data taken from Table 2 of Liseau et al. 1999 | ISO | … | 62 | |
| [O I] (b)(b)Data taken from Table 2 of Liseau et al. 1999 | ISO | … | 83 | |
| [C II](b)(b)Data taken from Table 2 of Liseau et al. 1999 | ISO | … | 68 | |
| ISO-EW5 | C18O | HHT | 55 | 23 |
| HCO | HHT | 85 | 28 | |
| HCO | HHT | 36 | 28 |
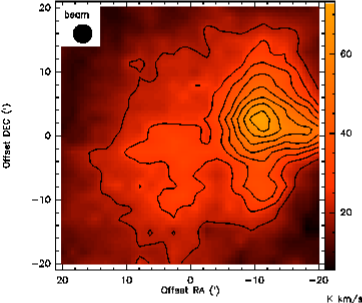
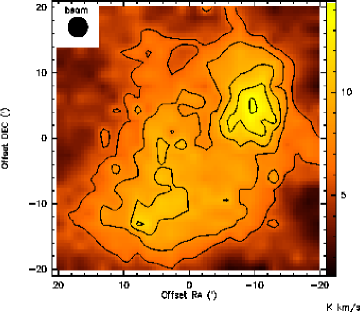
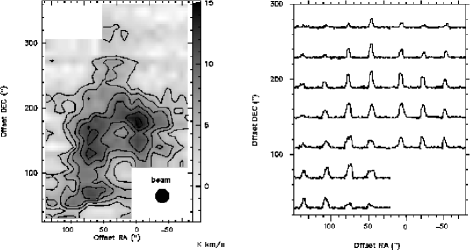
Large 40′40′ maps of the Oph dark cloud were made in the 492.1607 GHz (609 µm) fine-structure neutral carbon line and in the 461.0878 GHz (650 µm) CO line with AST/RO in October 1998 (Figure 2). Our reference off-source position (offset +9000″ in RA and -3000″ in DEC) for these observations was tested to be free of measurable CO line emission at these frequencies. The maps were centered near the source WL1 (Wilking & Lada 1983) and oversampled (1 grid in RA and DEC). Pointed observations were performed in the CO and 809.3 GHz (370 µm) toward the Oph A cloud core, the ISO EW4 position of Liseau et al. (1999) and the 460/490 GHz map center. All AST/RO observations were taken in position switching mode and the total integration time (on and off) per position was 1 minute for CO, 3 minutes for [C I] and 20 minutes for [C I] . The [C I] observations were taken with a 492 GHz quasi-optical receiver (Engargiola, Zmuidzinas & Lo 1994, Zmuidzinas & LeDuc 1992) in 1998 and the new 810 Ghz, 4-beam heterodyne array receiver, PoleSTAR in 2003. The CO observations were performed in 1998 with a 461 GHz SIS waveguide receiver (Walker, Kooi and Jacobs 2001). The beam size at the time of the 492, 461, and 810 GHz observations was 3.5′, 3′ and 1′, respectively. The line strengths were calibrated using hot and cold loads, coupled with sky measurements at the reference position (see Stark et al. 2001). A velocity resolution of 0.4 km s-1 was achieved for these spectra using a 2048 channel acousto-optical spectrometer (Schieder, Tolls & Winnewisser 1989). The main beam efficiency and system temperature for the 400 GHz receivers was 0.7 and 1000-2000 K, respectively. PoleSTAR’s coupling efficiency, 0.5 (T 20,000 K) was lower owing to very coarse optical alignment at the time of (first light) observations. An instrumental velocity offset of 3 km sec-1 at 460 & 490 GHz was removed by comparison with observed CO and [C I] lines toward infrared source WL16 from the HHT and the Caltech Submillimeter Observatory (CSO).
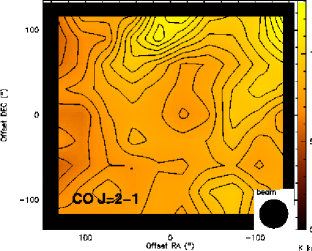
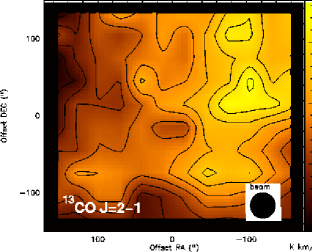
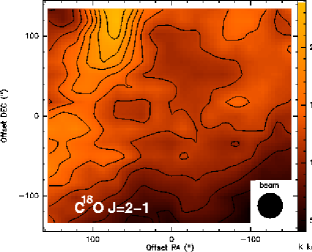
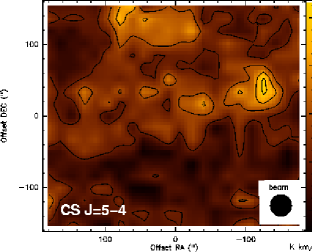
We used the HHT to obtain overlapping CO isotopomer maps (C18O and 13CO) for two of the east-west ISO strip positions of Liseau et al. (1999). Roughly 5′5′ maps were made in C18O, C18O, 13CO, CO, CS , HCO and HCO toward the east-west strip position EW4 of Liseau et al. (1999), and a limited subset of observations toward EW5 and toward infrared source WL16 and nearby Elias 29 (Figures 3,4). The maps were taken in March 1999, May 1999, and April 2001 using the spectral line on-the-fly mapping capabilities at the HHT with facility 230 GHz and 345 GHz SIS waveguide receivers. A 2048 channel, 250 KHz resolution acousto-optical spectrometer was used as a backend for both receivers, as were three filterbanks of 1 MHz, 250 KHz, and 62.5 KHz resolution. We adopted the same (clean) reference position (9000″,-3000″) as used at AST/RO for the higher-frequency observations. The half-power beamsize was 30″ for the 230 GHz band observations and 20″ for the 345 GHz band. The adopted beam efficiencies for an extended source were 0.8 for the 230 GHz receiver and 0.7 for the 345 GHz receiver, interpolated from measurements of point sources and the full moon. System temperatures with the 230 GHz receiver were typically 400–600 K, and 500–1500 K with the 345 GHz receiver. Calibration uncertainty for the AST/RO, HHT and CSO data is estimated to be 20% below 500 GHz and 30% at 810 GHz.
3. Morphology of the Oph Cloud
3.1. Line Excitation and Radiative Transfer
Emergent spectral line intensities from molecular clouds are a product of the combined effects of molecular abundances, excitation, and physical and kinematic cloud structure. Explicit treatment of the level populations and transfer of line radiation is necessary to disentangle these components and obtain a meaningful picture of the structure of molecular clouds. To simplest approximation, we can assume that the level populations can be described by a Boltzmann distribution (i.e., local thermodynamic equilibrium, or LTE), and determine total column densities in a simplified and standard way (cf. Keene et al. 1987):
| (1) |
where is the main beam integrated intensity of the spectral line, is the partition function for the energy levels accessible under these interstellar conditions, is the statistical weight of level , and is the Einstein coefficient for a transition from rotational state . In the case of CO and its isotopomers, the populations of the lowest rotational levels, with nominal in the transition to in the transition, should be thermalized to good approximation for an adopted density of , consistent with ISO observations of [C II] and [O I] line emission (Liseau et al. 1999).
Because the excitation of submillimeter and THz-wave lines of CO and related atoms and molecules may be subthermal, a more explicit calculation of the level populations is necessary. Assuming detailed balance and steady state, the equations of statistical equilibrium are solved iteratively with the level populations and corresponding column densities, using the LTE level populations as initial conditions. Using the observed linewidths, emergent line intensities and optical depths are computed using an escape probability formalism for radiative transfer (de Jong, Boland, & Dalgarno 1980). The competition between radiative and collisional processes in depopulating a particular energy level typically involves a large number of possible collisional transitions, the effects of radiative trapping of optically thick lines, and the rates of absorption and stimulated emission. We adopt the collisional cross sections from Schinke (1985), Monteiro (1985), Schröder et al. (1991), Jaquet et al. (1992), and Flower (1990) for H2 interactions with CO, HCO+, C0, C+, and O0, respectively, and suitably scaled for the appropriate kinetic temperature. The H2 ortho-para ratio is assumed to be thermalized at the gas temperature. Interactions of O0 and C+ with electrons are computed using rates from Pequignot(1990) and Blum & Pradhan (1992), respectively.
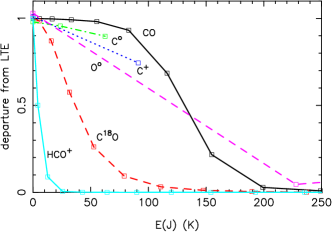
A sample calculation highlights the differences in excitation between LTE and NLTE (escape probability) at moderate densities for various PDR-probing species. The results are plotted in Figure 5. A plane-parallel slab of N(H2) and radiates in lines of CO, C18O, [C I], [C II], and [O I]. 2 km s-1 linewidths are adopted for the transfer of radiation through the slab. C+ and O0 are subject to K, the other species feel K. The level populations are compared to the predictions of LTE for the same total column densities as a function of energy above the ground state. The adopted abundances for this illustrative example, relative to H2, are [CO] = , [C18O] = , [C0] = , [C+] = , and [O0] = .
The submillimeter fine structure lines of atomic carbon are exceptionally represented by thermal excitation, as is [C II]. The very lowest rotational levels of C18O are thermalized, but the level populations rapidly depart from LTE for J5. Radiative trapping in optically thick low-J CO transitions maintains a thermal population distribution up to J8, after which it too becomes subthermally excited. It is useful to point out that in cold clouds with no hotter gaseous components, the lowest rotational levels of CO are the only levels that are populated, thusly LTE can often provide a reasonable approximation. Our calculation of C18O line intensities compare favorably with the LVG models of Mauersberger et al. (1992), which is expected since LVG and escape probability models are functionally similar. The high critical densities of HCO+ and O0 lead to subthermal excitation in all levels above the ground state. Careful accounting of the excitation and level populations of these species is especially critical to the correct interpretation of their spectra.
3.2. Morphology of Large Scale CO and [C I] Emission
With a simplified but effective mechanism for computing the NLTE level populations and emergent line intensities of interstellar atoms and molecules, we are prepared to explore the structure of the Oph cloud.
| Position | (CO) | |
|---|---|---|
| (K)(a)(a)In | (K)(b)(b)Derived from Gaussian fits to the peak intensity of the CO and lines | |
| Oph A | 45 | 41 |
| WL1 | 20 | 22 |
| WL16 | 24 | 27 |
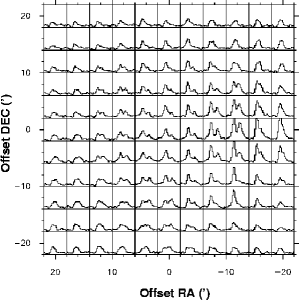
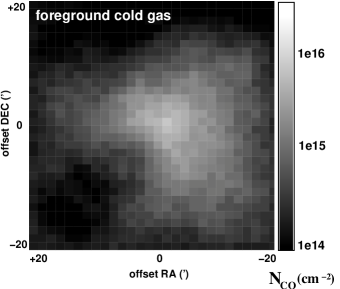
In Figure 2 we present the AST/RO large scale maps in CO and [C I], centered near infrared source WL1. The peaks of the two maps differ by roughly one beam, or 0.1 pc at the distance of the Oph molecular cloud. The CO line emission is very optically thick () where C18O is easily observed (Wilking & Lada 1983). We therefore expect the peak line intensity to trace the kinetic gas temperature at the surface of the cloud’s “CO photosphere”. Sample 12CO spectra across the cloud are plotted in Figure 7. Where the CO line profile is Gaussian, the corrected main beam antenna temperature is generally 10-15K although it peaks at 35K at offset (-20′, 0′), consistent with surface heating from HD 147889. In practice, however, this analysis is often complicated by prominent self-absorption in the CO line profiles toward the cloud cores. We fit two component (simultaneous emission & absorption) Gaussian functions to the 12CO line profiles and recover reliable peak brightness temperatures. Since we measure absorption line strengths as a byproduct of this analysis, we also perform a (curve of growth) analysis of the absorption lines to yield maps of the foreground cold absorbing gas. Over much of the map, the excitation of the cold gas is not well constrained, but certainly must be lower than the excitation temperature of the line-emitting gas. Over the range of , the derived column densities vary by less than 30% if we assume that the cold gas is represented by =15K. The gas is certainly not colder than 10K, even in the unexcited eastern portion of the cloud, as the weaker CO lines emitted there are not self-absorbed, as they would be if the excitation of foreground gas were markedly colder than the line-emitting gas.
The CO emission peak, with a peak brightness temperature of 45K is spatially coincident with the filamentary western boundary of the cloud. This strongly implies the foreground heating of the CO boundary due to UV photoillumination and the subsequent competition for those photons by H2 molecules and dust grains. The warm CO is localized, suggesting that the rest of the molecular cloud’s Earth-facing “CO photosphere” is cold and not subject to the significant radiation field from HD 147889 or the other B-stars attending the dark cloud.
In contrast to 12CO, the overall structure of the [C I] integrated intensity map closely resembles the C18O integrated intensity map toward Oph taken by Wilking and Lada (1983) and matches the line intensities and profiles of Frerking et al (1989). The [C I] map morphology generally does not match the CO map, due to the large differences in line optical depth. The addition of the 810 GHz CO and [C I] lines confirms that the [C I] level populations are thermalized at the CO excitation temperature (Table 2: 25-45K in the west, 20-25K in the map center, and 10-15K to the east). The [C I] emission peak has a line center optical depth of , similar to C18O (§3.3.1). Indeed, the 492 GHz line optical depth actually reaches a maximum of at the second [C I] peak near Oph F due to the lower kinetic temperatures expected there and the correspondingly greater populations in the and levels.
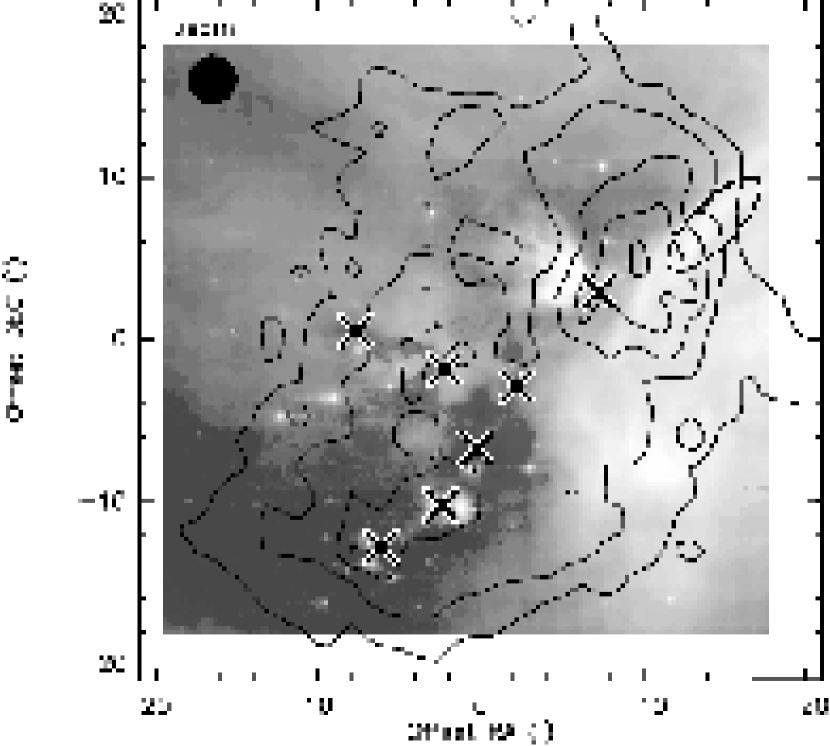
In Figure 6, we overplot the same AST/RO [C I] contours atop a gray-scale image of the Oph cloud taken in 7 & 15 µm dust emission, from Abergel et al. (1996). The warm dust probed by the mid-IR highlights the heated “edges” of the molecular cloud, especially the filament-like structure at the western edge of the cloud. This western filament is coincident with copious rotational and ro-vibrational H2 line emission and PAH emission indicative of an H2 photodissociation front (Boulanger et al. 1999). The [C I] emission is clearly extended, and generally follows the edges of the warm IR dust emission, as expected for a tracer of the warm surfaces of molecular clouds. [C I] emission peaks in two regions; both correspond to dense condensations of dust and gas seen in (sub)millimeter dust continuum intensity maps (Motte et al. 1998, Johnstone et al. 2000). The eastern intensity peak is well correlated with the dense molecular ridge associated with the Oph E and F condensations (Motte et al. 1998) and matches a similar distribution in C18O line emission (Wilking & Lada 1983). The western [C I] peak lies just south-east of the H2 dissociation front as observed from Earth. The C18O peak of Oph A lies even further southeast of the [C I] peak, reminiscent of the C+/C0/CO arrangement of plane-parallel PDR models. This suggests that some of the western PDR front is observed edge-on or at least obliquely. We will return to the structure of the western PDR front in §4.3.
3.2.1 Relation of [C I] to [C II] and CO Line Emission
Kamegai et al. (2003) also reports large scale, albeit undersampled, observations of the Oph cloud in [C I] emission, and it is of interest to compare their maps with the present work. The previous study interprets the eastern [C I] line emission peak (“Peak II”) as being potentially due to the chemical youth of the region, because the atomic carbon and C18O integrated intensity maxima do not follow the standard C+/C/CO arrangement expected in plane-parallel PDRs. Indeed, an atomic-carbon-rich region could be due to the ongoing formation of a dark cloud where the ionic, atomic, and molecular forms of carbon have not yet equilibrated. Although this prospect is exciting, our study of the Oph cloud in both species does not strongly support this interpretation for the following reasons:
1) Emission from atomic carbon does in fact trace the CO column density and dust continuum relatively faithfully. The eastern “carbon peak” in our maps follows a northwest-to-southeast ridge that is also reproduced in C18O J=10 emission in the Wilking & Lada (1983) map and also realized by our C18O J=21 and HCO+ J=32 maps around Elias 29, part of the atomic carbon “ridge” (Figure 4). Furthermore, the Oph dust continuum cores “E” and “F” pass through the same ridge (Motte et al. 1998), including sources such as Elias 29 and a portion of the stellar cluster (see Figures 1 and 6 for an overlay of our [C I] map and the ISO infrared map with dust continuum cores labeled).
There is some discrepancy however; the C18O ridge continues to the northwest, through the Oph continuum peak “C”, whereas the atomic carbon emission turns to the north instead. Kamegai et al. (2003) appear to use such a cut through the cloud to demonstrate the differentiation of atomic carbon and CO. However, they neglect the fact that HD 147889 lies beyond the Oph cloud. It is easy to imagine that the slightly reversed [C I]/CO arrangement on the sky is entirely due to projection effects along this particular cut. Most of the [C I] emission follows the 13CO or C18O distribution accurately.
2) A problem of timescales exists. The hypothesized “carbon-rich peak” in the youthful process of forming CO from C+ and C0 has already been the site of active star formation for 1 Myr, a typical age of young stars in the Oph cluster. Given the high gas densities suggested by the abundant HCO+ emission cospatial with the [C I] and CO ridge (Figure 4), the chemical timescales for equilibrating the CO abundance are likely to be appreciably shorter ( yr) than Kamegai et al. (2003) assume. Their values stem from the time dependent models of Lee et al. (1996), which adopt a maximum gas density of only 104 cm-3, over two orders of magnitude less than that needed to thermalize the transition of HCO+. One caveat with this interpretation lies in the possibility that the HCO+ and atomic carbon trace different gas along the line of sight. A carbon map of higher angular resolution will help clarify the density structure toward this complex region.
3.3. Structure of the Oph A Cloud Core
We have marked the location of our smaller scale maps taken with the HHT in Figure 1. The centers of two such maps coincide with ISO-LWS pointings from Liseau et al. (1999) in [C II] and [O I] in an east-west strip adjacent to the Oph A cloud core. A third mapped region is centered on infrared source WL16 (Wilking & Lada 1983) and includes Elias 29.
3.3.1 CO Line Opacity and Excitation
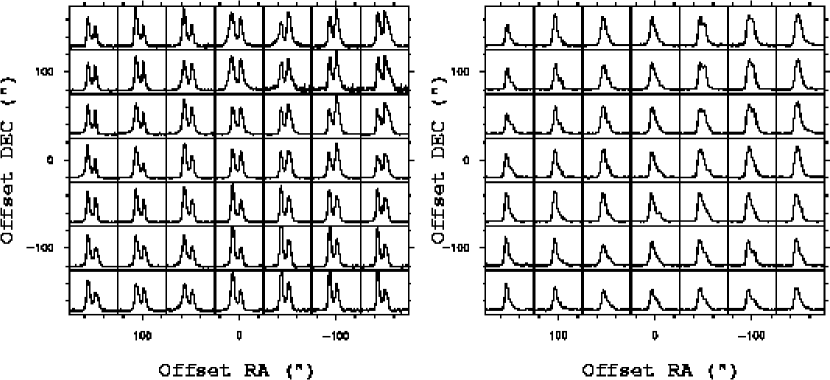
Figures 4 depicts the HHT spectral line maps toward ISO-EW4 which skirt the Oph A cloud core and bisect a hot dust filament seen in the ISOCAM images of Abergel et al. (1996). 12CO and line profiles through the region are badly contaminated by strong self-absorption (Figure 8), indicating high optical depth and cold foreground material. A plot of through the 13CO line is shown in Figure 9, where a standard abundance ratio of 7.1 has been adopted for . Although this ratio is higher in the outermost PDR layers from poor C18O self-shielding and subsequent selective dissociation (Black & van Dishoeck 1988, Plume et al. 1999), when summed over the column of the entire cloud, this estimate is likely to be reasonable. We see conclusively that the 13CO emission is optically thick with a line center optical depth of ; furthermore, the opacity in the transition of C18O is non-negligible, about 0.5. Even modest optical depths lead to radiative trapping which easily thermalizes the J3 levels for densities prevalent in dense clouds (103 cm-3). The 13CO line profiles are Gaussian except toward the Oph A cloud core, toward the northeast corner of the maps (Figure 8). Kinetic temperatures derived throughout the region are 20-35K, peaking at the position of the Oph A2 core (Motte et al. 1998) and along the warm dust filament that marks the western foreground edge of the cloud.
3.3.2 Abundance and Excitation of HCO+ and CS
While examining Figure 4, it is important to point out that no two tracers of molecular material appear alike in our maps, even those which should trace similar conditions. In the case of CO and its rare isotopomers, the differences result from the effects of radiative transfer and line optical depth, probing different depths into the cloud. However, HCO+ and CS line emission should be probing gas of high density, yet the emission line maps share nothing in common. Nor do they sample the same gas seen in C18O line emission.
For example, the emission in the C18O and HCO+ transitions strongly peak toward the NE corner of our map, coincident with the Oph A cloud core and protostellar source VLA1623 (André et al. 1993 and references therein). The C18O emission in particular is roughly comparable to the (sub)millimeter continuum emission by Motte, André & Neri (1998), Wilson et al. (1999), and Johnstone et al. (2000). The C18O line emission differs principally in that the Oph A core dominates, and the more filamentary structures seen in the continuum do not contrast as strongly. For example, VLA1623 is easily separated from the Oph A core itself in the IRAM and SCUBA maps, but is seen merely as the end of an elongated ridge of C18O line emission stemming from Oph A and not distinguishable from it.
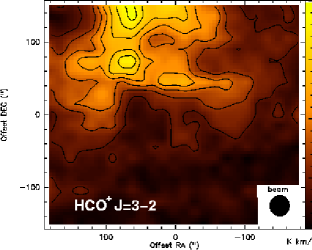
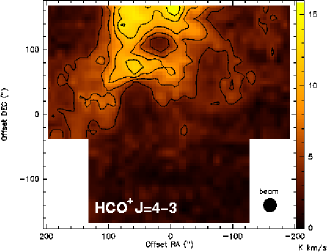
Unlike CO and its isotopomers, HCO+ emission (Figures 4, 10) is not prominent throughout the map; it is instead largely confined to a ring-like structure that includes the C18O core of Oph A at its eastern edge. It qualitatively reproduces the 1 mm submillimeter continuum structure of Motte et al. (1998) (figure 2a) and Johnstone et al. (2000). However, the ringed, filamentary structure is more pronounced in HCO+ than it is in submillimeter continuum emission or C18O line emission. It is notable that the center of the “ring” shows no sign of HCO+ self-absorption, as demonstrated by the line profile maps of Figure 10, and H13CO+ shows a similar drop in intensity at the center of the “ring”. Two possibilities explain the heightened HCO+ intensity around the Oph core: [1] a heightened HCO+ abundance due to enhanced cosmic ray flux, electron density and/or shock chemistry, [2] a normal HCO+ abundance, but in gas that is either exceptionally warm and subthermally excited, or very dense () and thermalized near the CO excitation temperature.
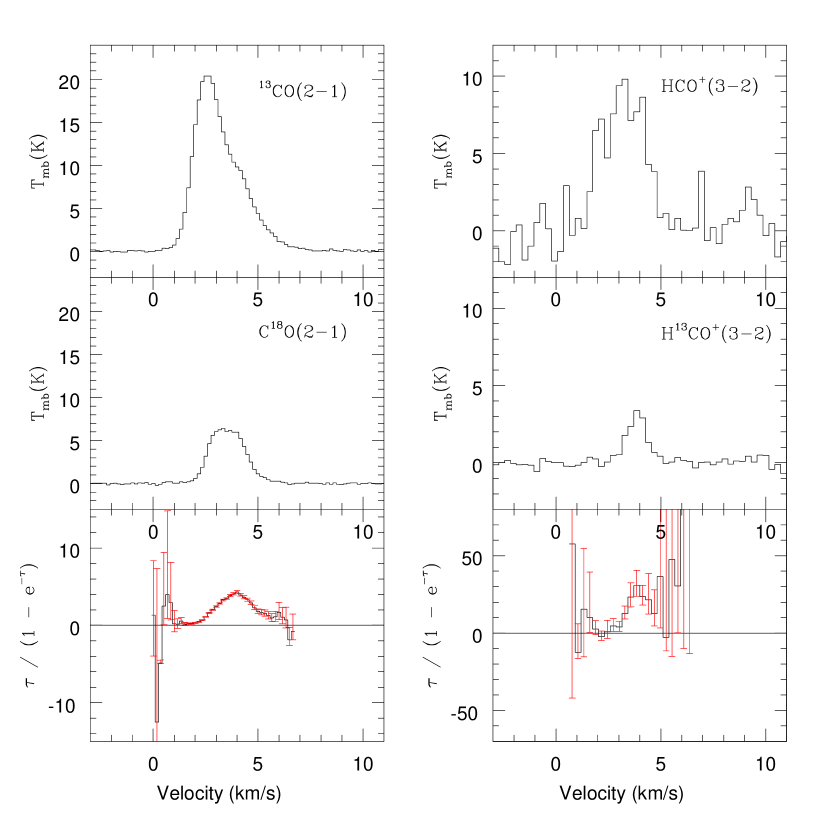
The column density and abundance of HCO+ provides the best constraints on these possibilities, and can be determined by observations of H13CO+. For example, a line opacity analysis for the HCO+ peak (EW4 offset +70″, +70″) that corresponds to VLA1623 is shown in Figure 9 assuming =70. The HCO emission is optically thick with at line center. Assuming that [HCO+/H13CO+]=70, N(HCO+) cm-2. To relate this value to that of CO and H2, the column density of C18O is calculated by measurement of its and integrated intensities. The derived gas temperature is 25K, consistent with the observed peak antenna temperature of 13CO, and the column density of cold C18O is computed to be cm-2, yielding N(H2) cm-2 if [C18O]= (Wilson & Rood 1994) and a strongly enhanced HCO+ abundance of . The same situation holds for the peak of HCO+ emission at the north-west corner of the HCO+ “ring” (see Figure 10, offset 0″, 180″).
The high abundance of HCO+ is localized. To illustrate this point, the south side of the HCO+ “ring”, at ISOEW4 offset (10″, 60″) can be seen in Figure 4. Based on the detection of optically-thin H13CO+ emission of intensity 0.5 K km s-1 and an estimated H2 column density of cm-2 from the and lines of C18O, the derived abundance of HCO+ is , somewhat enhanced but not unusual. Furthermore, the intense submillimeter continuum peak around VLA 1623 is all but absent in HCO+ and CO emission, suggesting significant depletion, with abundances of HCO+ not even reaching 10-10 times that of H2. The parameter space of kinetic temperature and density is plotted in Figure 11. The excitation of HCO+ is consistent with CO if it is subthermal at a density slightly less than 106 cm-3. If HCO+ stems from a colder environment than probed by CO line emission, higher densities are required.
The CS molecule is often adopted as a tracer of high density environments like HCO+, yet CS line emission in the Oph region looks very different from HCO+. The Oph A core is nearly indistinguishable from the high column density plateau in which it sits. The abundance of CS at the south-west corner of the filament, at the excitation conditions of CO and HCO+ (K) is only relative to H2 at a density of 107 cm-3. The derived abundances are only weakly dependent on excitation temperature between 20 and 50K, and no CS enhancement is seen in any of the regions where HCO+ is enhanced. On the contrary, the CS abundance seems lowest where C18O is concentrated. The CS distribution peaks instead at the Oph A2 core (Motte et al. 1998). The abundance, given a kinetic temperature of 35K from the C18O measurements, is higher; at cm-3 to at cm-3. The CS line profile has a red shoulder, indicating that it contributes to a (dense) outflow in the region; indeed, the line profiles of 13CO and C18O also indicate the presence of higher velocity material. The enhanced CS abundance toward Oph A2 is most readily explained by the liberation of sulphur-bearing species from dust grains to the ISM via heating and shocks in the outflow (e.g. Mitchell 1984).
The differences in the CS and HCO+ maps suggest that different chemical mechanisms are responsible for their relative abundance distributions. If shocks best explain the variation in CS, is an enhanced ionization rate a plausible explanation for the behavior of HCO+? To explore this possibility, we consider a simplified set of reactions which govern the abundance of HCO+, namely formation via the ionization of H2 to H (followed by H + CO HCO+ + H2), and destruction by recombination with free electrons and reactions with gaseous water. The latter is negligible due to the low abundance of water in the Oph A core as measured by the Submillimeter Wave Astronomy Satellite (SWAS) (Snell et al. 2000; Ashby et al. 2000). We adopt an electron fraction of , estimated coarsely from (Langer 1985) and increased by a factor of 3 to approximately account for (a low abundance of) metal species (Lee et al. 1996). The ionization rate is estimated by combining a normal cosmic ray ionization rate ( s-1) with the local X-ray flux derived from the brightness and projected distance from all point sources seen in public ACIS/Chandra images of Oph A (Hamaguchi et al. 2003). Three sources with erg s-1 are found within 3′ (the magnetic B star Oph S1 2.6′ away, and two sources within 1′, one seemingly at the position of VLA 1623). DoAr 21 ( erg s-1) lies at a separation of 6.5′ and also contributes to the total X-ray flux (Imanishi et al. 2002). Following Maloney et al. (1996), the impact of these sources upon the ionization rate of (molecular) hydrogen is estimated to be s-1, comparable to the contribution of cosmic rays. At a density of cm-3, this enhanced ionization rate yields HCO+ abundances of , matching the peaks observed toward Oph A.
These chemical gradients make the Oph A core an interesting chemical laboratory for the study of recent star formation and subsequent feedback upon molecular clouds that warrants further study.
4. PDR Modeling of the Oph Cloud
4.1. The Vicinity of the Oph A Core
The map that coincides with ISO pointing “EW4” (Liseau et al. 1999) slices through the southern-most portion of the hot dust filament seen in the Abergel et al. (1996) ISOCAM image, at the edge of a region loosely interpreted as the photoilluminated edge of the Oph cloud. It also lies immediately adjacent to the Oph A cloud core. Owing to the large amount of high-quality data toward EW4, we will initially focus our analysis toward this region.
4.1.1 Column Densities


The range of telescopes used to obtain these data result in half-power beam sizes that vary widely between emission lines. To compare the derived column densities in a consistent way, we convolve our HHT spectra to the resolution of AST/RO (3.5′) and ISO (1.1′). An indirect comparison between AST/RO and ISO observations can then be established via the convolved HHT maps. The convolved spectra, with , are plotted in Figure 12 along with the EW4 position spectra of CO and [C I] from AST/RO.
| Position | Species | |||
|---|---|---|---|---|
| Offset (70″,70″) | ||||
| HCO+ | 22 | |||
| C18O | 26 | |||
| Offset (10″,60″) | ||||
| HCO+ | 14 | |||
| C18O | 16 | |||
| 3.5′ convolved beam | ||||
| (0″, 0″) | C18O | 13.5 | ||
| 13CO | 49.1 |
The ratio of integrated intensities of C18O in its and transitions yields K for those levels under LTE. An escape probability calculation using the integrated intensities of observed C18O and 13CO lines yields the column densities listed in Table 3 for and , implied by the antenna temperature of 13CO , the homogenous PDR modeling of far-infrared lines toward ISO-EW4 by Liseau et al. (1999), and the observed [O I] and HCO+ lines in the beam, both of which have critical densities above . The resulting H2 column density is estimated to be cm-2, which corresponds to using standard dust grains, or using , likely to be more appropriate to dense molecular environments like Oph (Carrasco, Strom, & Strom 1973). The derived H2 column density from 13CO is 40% higher than that derived from C18O; however its higher optical depth, unmeasured excitation temperature and non-Gaussian line profile suggests that the C18O observations are likely to be more reliable. Furthermore, the escape-probability-calculated optical depths of the C18O lines are consistent with the previous LTE analysis that contributed Figure 9.
The total column densities for C0, C+ and O0 can only be calculated with knowledge of their excitation. As only one line is reliably observed for each of these species, we will now appeal to PDR models to provide the radiation field and excitation as a function of depth into a cloud, and will attempt to match all available observations. One can then elucidate the types of regions from which these three species must radiate, thereby disentangling some of the physical structure of the Oph PDR.
Liseau et al. 1999 have already performed an analysis of the [O I] and [C II] emission in their ISO-LWS spectra using homogeneous PDR models, and we will extend their results to include the CO, HCO+ and [C I] results presented here. We will also discuss two models of simple inhomogeneous clouds, which are offered to provide a better fit to all available observations.
4.1.2 Homogeneous PDR’s
| Diagnostic | Observed | Modeled | Reference |
|---|---|---|---|
| [C II] 158 µm | (a)(a)In | (a)(a)In | Kaufman et al. (1999) |
| [O I] 63 µm/ [C II] 158 µm | 0.43 | 0.4 | This paper(b)(b)Derived from both 809 and 492 GHz [C I] lines |
| 0.9 | Kaufman et al. (1999) | ||
| [C I] | (a)(a)In | (a)(a)In | Kaufman et al. (1999) |
| This paper(b)(b)Cloud model follows that of van Dishoeck & Black (1988), see text | |||
| CO / [C II] | 100 | Kaufman et al. (1999) | |
| HCO | 5.9 Kkm s-1 | 0.36 Kkm s-1 | This paper(b)(b)Cloud model follows that of van Dishoeck & Black (1988), see text |
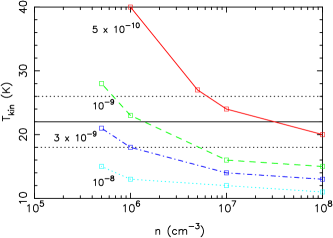
The archetypal PDR model invokes a plane parallel slab of constant density, illuminated on one side by a source of ultraviolet photons scaled by the local interstellar radiation field, IUV (also G0=I), and on both sides by the cosmic microwave background. The basic chemical network (including PAHs) and heating and cooling terms (i.e. thermal structure) follows the treatment of Kaufman al. (1999). The PDR is gridded into zones, each with a given radiation field, density, and temperature. The treatment of the photodissociation in each zone is then characterized by the methods described in van Dishoeck & Black (1988) and Black & van Dishoeck (1987). The rate of H2 dissociation includes the effects of UV line overlap as described by Draine & Bertoldi (1996). Given the excitation temperature derived from the 63 µm [O I] transition, and based on the results of Kaufman et al. (specifically Figure 1 of that paper), we estimate a radiation field of I for position ISO-EW4. We adopt a mean density of , which fits the the 63 µm [O I] and 158 µm [C II] line emission as per Liseau et al. (1999), with a slab of total column density N(H2) = . Our models predict the correct line intensity for [C I] emission, erg s-1 cm-2 sr-1, though the Kaufman et al. (1999) models overestimate the [C I] flux by 50%. Both models similarly fit the 158 µm [C II] and 63 µm [O I] line intensity within the observational uncertainties. As described by Liseau et al. (1999), the 145 µm [O I] emission is underproduced by an order of magnitude in the models. Furthermore, the observed intensity of HCO and , with critical densities of and , respectively, is not reproducible at unless the excitation is exceptionally hot (K) and subthermal. Such conditions are not indicated by the relative intensities of the HCO and lines, which are more consistent with a thermalized population at TK, similar to CO. Higher densities are simply necessary to create sufficient submillimeter HCO+ emission. A natural way to account for the discrepancy in excitation is to adopt a heterogeneous model for the physical structure of the region.
4.1.3 Clumpy PDR’s
| Diagnostic | Observed | Modeled |
|---|---|---|
| [C II] 158 µm | (a)(a)In | (a)(a)In |
| [O I] 63 µm/ [C II] 158 µm | 0.43 | 0.36 |
| [C I] | (a)(a)In | (a)(a)In |
| CO | (a)(a)In | (a)(a)In |
| HCO | 5.9 K km s-1 | 1.6 K km s-1 |
| Diagnostic | Observed | Modeled |
|---|---|---|
| [C II] | (a)(a)In | (a)(a)In |
| [O I] 63 µm/ [C II] 158 µm | 0.43 | 1.0 |
| [C I] | (a)(a)In | (a)(a)In |
| CO | (a)(a)In | (a)(a)In |
| HCO | 5.9 K km s-1 | 5.2 K km s-1 |
The simplest heterogeneous models for PDR’s involve the consistent composition and weighting of two homogeneous PDR models. That is, we consider a plane-parallel slab of gas containing dense condensations (clumps) of gas randomly embedded in a more diffuse envelope, and illuminated by an ultraviolet radiation field. The dense clumps individually receive an attenuated radiation field based on the amount of intervening diffuse material photons must travel to reach the clump. Scattering in the interclump medium is neglected. We consider two cases: one in which the clump:envelope density contrast is 30:1 ( and cm-3), and a second in which the contrast is 1000:1 ( and cm-3). The clumps are assumed to be spherical, 0.1 parsecs in diameter, with a volume filling factor of 0.1 and 0.2, respectively, so as to keep the mean density comparable to the homogeneous models, . The clump sizes are consistent with the assumed sizes for clumps in other multicomponent PDR models (e.g. Meixner & Tielens 1993; Spaans 1996) and correspond to the angular size of major C18O and HCO+ condensations in our spectral line maps.
The two inhomogenous PDR models give similar qualitative results, which are summarized in Figure 14. The large majority of the [C I] emission comes from the diffuse envelopes, as has been suggested by Spaans (1996) and MT93, among others. The envelope exceeds the low critical density and excitation energy needed to produce significant [C I] line emission, and as it dominates the filling factor of the region, it also dominates the production of [C I] . This is especially true of the high-density-contrast model. The excitation of the [C I] is expected to be similar to that of 13CO and C18O, which is borne out by the similar distribution of [C I] and C18O in Oph, as well as the similarities in line opacity and profile.
The somewhat higher excitation temperatures and critical densities of [C II] emission make its point of origin slightly more ambiguous. Almost 2/3 of the [C II] emission still arises in the more diffuse envelopes, but the remaining line emission stems from the warm surface layers of the denser clumps, particularly those closest to the PDR front.
Low-J 12CO line emission is highly saturated, and hence comes from the surface layer of the molecular cloud “photosphere” at the frequency of each CO line, and is equally excited in the diffuse envelope and the surfaces of the clumps that are near the PDR “surface”. Since the emergent line intensity is weighted by filling factor, most low-J line emission comes from the diffuse envelope. As one moves into the submillimeter and far infrared bands, the less-saturated high-J lines arise most prominently from the warm, dense clump surfaces. Line emission from the isotopically rare species, especially C18O, is also dominated by the envelopes, but to a lesser extent than 12CO, as the reduced self-shielding of the rarer species in the UV-dominated transition regions leads to isotope-selective dissociation and fractionation. The lower line optical depth in these transitions probes the depth of the entire cloud, not just the surface layers seen in low-J 12CO.
Far-infrared [O I] and submillimeter HCO+ line emission is only efficiently produced at higher densities, so it doesn’t significantly contribute to the line emission in the diffuse envelope, but instead stems from the dense clumps. The HCO and emission is readily excited at low temperatures, and therefore stems from the cold, shielded, molecular clump interiors as well as the UV-illuminated PDR surfaces of clumps. The relatively high 228K excitation energy of the [O I] transition limits the vast majority of the intense [O I] emission to the warm surfaces of the clumps. However, if atomic oxygen is not entirely bound up in molecules like CO, H2O, or depleted onto dust grains in the shielded cores of dense clouds, it can emit at detectable levels even at relatively cold temperatures (T K) at high densities (). Indeed, it now seems certain that O2 is not a significant repository of elemental oxygen in molecular clouds (cf. Goldsmith et al. 2000, and references therein); however, the nature of oxygen depletion in molecular clouds is still debated enthusiastically.
A narrow range of density contrast is required to simultaneously account for the modest strength of the 63 µm [O I] and submillimeter HCO+ emission. At the higher densities () needed to stimulate significant HCO emission, [O I] emission can become very efficient and rapidly overwhelms the 158 µm [C II] intensity for normal interstellar conditions, contrary to ISO-LWS observations of Oph where [C II] emission is dominant (Liseau et al. 1999; Kaufman et al. 1999). However, clumps with nonuniform (power law) density, , are theoretically expected and naturally satisfy both excitation conditions. As such, submillimeter HCO+ emission would then originate primarily from the dense cores of the clumps (), whereas the [O I] emission would stem from the warmer “surfaces” of the clumps ().
4.2. Other ISO positions
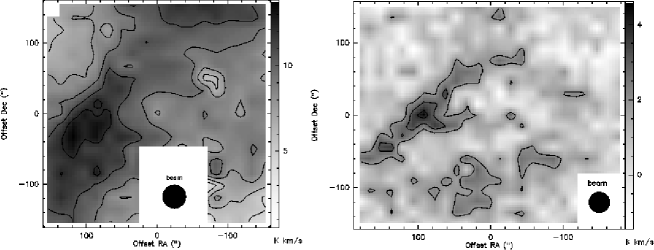
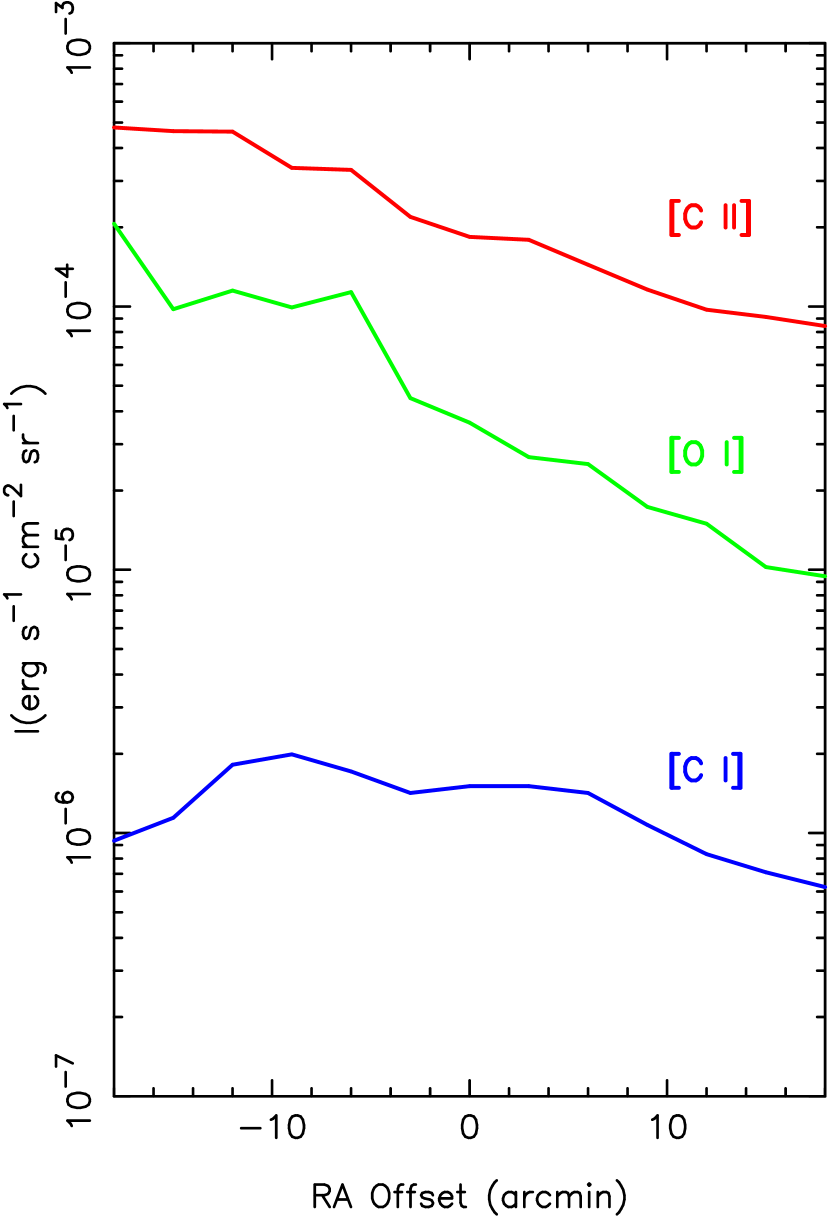
Our large scale maps of [C I] overlap with all 13 pointings of ISO-LWS from Liseau et al. (1999). We can therefore perform limited (homogenous) PDR modeling toward a 1-dimensional east-west cross section of the Oph cloud. In Figure 15, we plot the cross-sectional intensities of 158µm [C II], 63µm [O I] and 609µm [C I] line emission. As described in Liseau et al. (1999), the [C II] line emission decreases as projected distance from HD 147889 increases, tracing the incident radiation field upon the Oph PDR. With a high critical density and excitation energy, the [O I] flux traces both density and radiation field intensity. [C I] line emission however shows a different spatial relation, instead following the cold gas column density as traced by C18O (for comparison, see Wilking & Lada 1983); the two maxima in the [C I] distribution occur as the cross-sectional slice skirts the edges of the Oph A and Oph B2 cloud cores.
As in § 4.1.2, we use the ISO-LWS integrated intensities of 158 µm [C II] and 63 µm [O I] line emission to estimate and . The thickness of the PDR model is decreased with increasing projected distance from HD 147889 in order to correctly recover the correct [C I] line intensities. Model results for four representative points along the east-west cross section are presented in Table 7.
| RA Offset(a)(a)“EW” positions correspond to Liseau et al. (1999) | N(H2) | 63µm [O I]/ | 609µm [C I] | ||
|---|---|---|---|---|---|
| (from WL1) | (K) | (cm-2) | 158µm [C II] | (erg s-1 cm-2 sr-1) | |
| -18′=EW1 | 90 | 200 | 0.4 | ||
| -6′=EW5 | 30 | 100 | 0.5 | ||
| 3′=EW8 | 20 | 100 | 0.2 | ||
| 18′=EW13 | 10 | 50 | 0.1 |
4.3. Directly Probing the Western H2 PDR Front
Mapping across the western PDR front in the infrared emission lines of H2 can clarify the cloud geometry at its “true surface”. Boulanger et al. (1999) presents ISO H2 emission line spectra from the western PDR front of the Oph cloud in the 0-0 S(0) through S(7), and 1-0 S(1) transitions. The H2 emission is observed to be coincident with both PAH emission in the thermal IR and the filamentary dust structure seen with ISOCAM at 7 and 15 µm. The non-thermal population of high H2 rotational levels coupled with photoilluminated PAH emission suggests that UV fluorescence, rather than thermal shocks, are likely to be responsible for the H2 excitation. Fluorescing H2 emission directly probes the incident UV field, PDR density, and geometry of the H I/H2 transition region at A with high angular resolution.
Spectroscopy of fluorescent H2 emission can also elucidate the location of the H2 dissociation region relative to the rest of the molecular cloud. For example, the H2 1-0 S(0,1) and 1-0 Q(2,3) line pairs arise from the same upper states. As these are both intrinsically weak electric-quadrupole transitions, the effects of self-absorption can be safely neglected. Thus the relative intensities of these two lines are functions only of their relative spontaneous radiative transition probabilities and photon energies. For example:
| (2) |
for the quadrupole H2 A-values computed most recently by Wolniewicz, Simbotin & Dalgarno (1998).
In Table 8, line ratios are tabulated for visual extinction (Av) from 0 to 40. Such measurements, combined with the intensity of the emission, would not only constrain the physical conditions in which H2 is dissociated, but also would clarify whether the UV-illuminated surface that is fluorescing in H2 is on the front or back side of the Oph cloud.
| Av | IQ(3)/IS(1) | IS(1) (a)(a)Extinguished intensity of 1-0 S(1), in |
|---|---|---|
| 0 | 0.703 | |
| 5 | 0.785 | |
| 10 | 0.875 | |
| 20 | 1.09 | |
| 30 | 1.36 | |
| 40 | 1.70 |
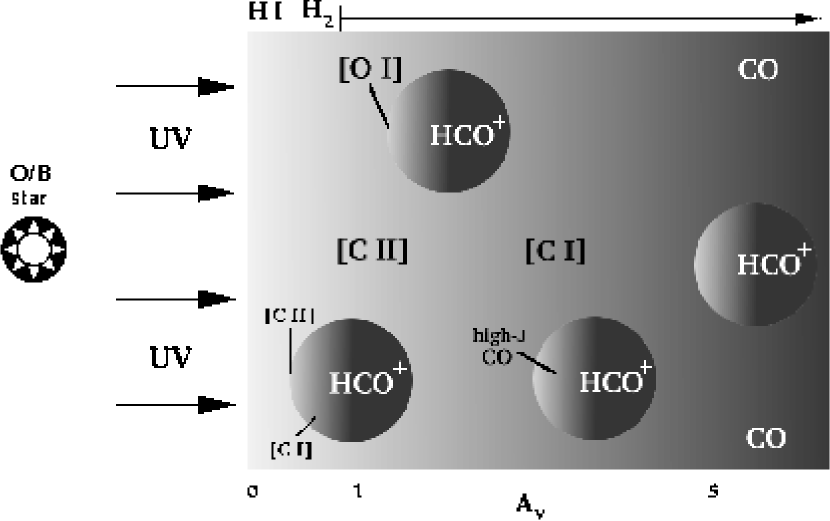
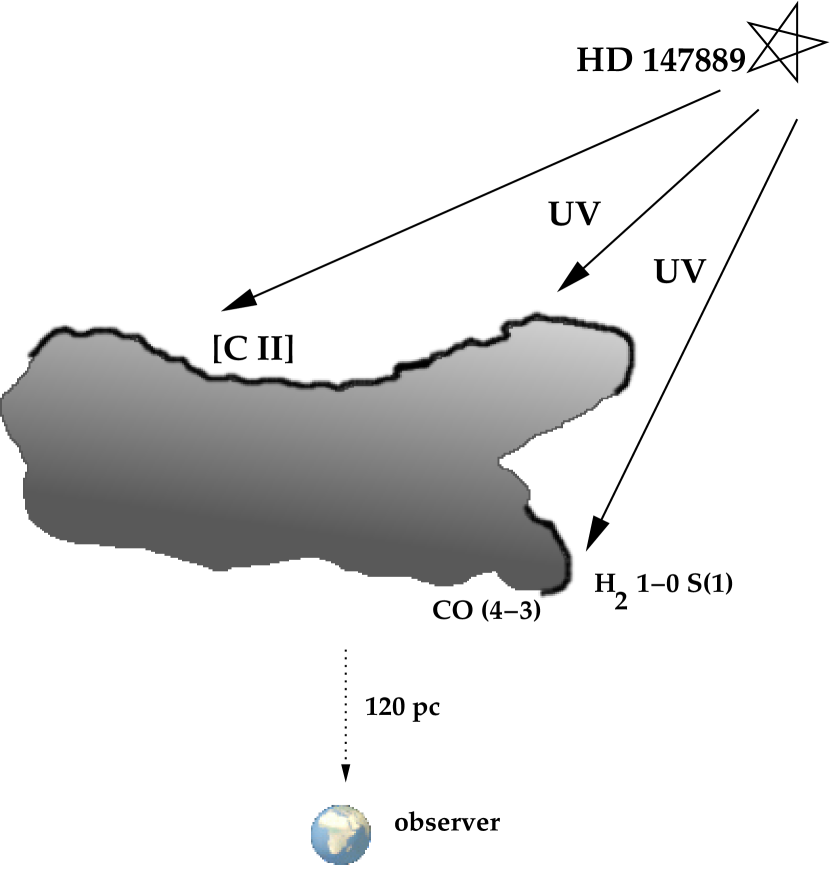
For example, at and , the expected H2 1-0 S(1) line intensity is modest, about . If the observed 1-0 S(1) emission (from Boulanger et al. 1999) originates from the back side of the cloud, as does the rest of the [C II] emission, the near-IR H2 emission would have to pass through a mean column density loosely equivalent to A, assuming a mean reference value of the gas/dust extinction ratio of measured in diffuse interstellar clouds. This translates to a mean extinction of magnitudes at 2.12 µm, interpolating the Rieke & Lebofsky (1985) infrared extinction curve. This would extinguish the H2 1-0 S(1) line flux by a factor of , to . Noting this faintness, and pending photometric calibration of the H2 1-0 S(1) images of Boulanger et al. (1999), we predict that the H2 emission instead comes from a region of molecular material on the front side of the cloud that is not shielded from HD 147889 and therefore is subject to photodissociation. A schematic view of the Oph PDR might then look like Figure 16.
Sensitive, high resolution near-infrared long slit spectroscopy of H2 in PDRs provides a natural complement to the kinds of long wavelength PDR diagnostics descibed in this paper, and are worth renewed effort with numerous far-infrared and submillimeter facilities soon to become available (such as Herschel & SOFIA).
5. Summary
In this paper, we have attempted to exploit the complementary information afforded by large-scale and high-resolution submillimeter spectroscopic observations made with small and large antennas.
We present large scale maps (), obtained with AST/RO, in CO and [C I] centered near the infrared source WL1 in the Ophiuchi molecular cloud. [C I] emission is extended on large scales, resembles the C18O column density map presented by Wilking and Lada (1983), and generally follows the edges of warm dust emission expected for the illuminated surface of the molecular cloud. The optically-thick CO emission traces the CO “surface” of molecular clouds and is strongest (hottest) at the western boundary of the molecular cloud, adjacent to exciting B2V star HD 147889. Adjacent ro-vibrational H2 emission, cospatial with a western filamentary structure in the hot dust continuum at 7 & 15 µm and in PAH emission, provides evidence for a new foreground PDR. This is in contrast to the rest of the cloud, which appears to be illuminated on the far side by HD 147889. Additional H2 spectroscopy is needed to verify these suppositions.
We also present smaller scale maps (), taken with the HHT, in C18O, C18O, 13CO, CO, CS, HCO and HCO toward a single region (EW4) in the AST/RO map, chosen to overlap with [C II] and [O I] observations made by Liseau et al. (1999) with ISO-LWS. The C18O structure of the Oph A core is directly comparable to recent submillimeter continuum emission, however HCO+ line emission is concentrated in a ring-like structure. Modeling of the HCO+ ring in comparison to CO suggests that the condensations are due to both a higher HCO+ abundance and a dominant dense gas component with . A slightly enhanced ionization rate contributes to the elevated HCO+ abundance in this region. Although it also stems from dense gas, the emission from CS follows a totally different morphology. The Oph A cloud core contributes to a plateau of CS emission, but the actual CS peak is coincident with the relatively minor Oph A2 core and outflow instead. Shock and outflow chemistry is suspected to contribute to a higher CS abundance in this region.
We use the emission lines presented in this paper to infer column densities of all optically thin species toward ISO-EW4, and three other positions examined by ISO-LWS. We use the indirect determinations of H2 column density from C18O and 13CO with PDR models to constrain the physical conditions in which [O I] and [C II] line emission is observed (Liseau et al. 1999). We model the physical structure of the Oph PDR in the traditional homogeneous, plane-parallel formalism, and obtain self-consistent fits to most available observations. However, the luminous and clumpy submillimeter HCO+ and infrared [O I] emission directly implies dense substructure. We adopt a simple two-component PDR model, featuring a diffuse gaseous envelope in which dense clumps reside, to account for the HCO+ and [O I] emission. In this picture of the physical structure of the PDR, we are able to attribute emission from different species to different physical locations within the Oph PDR. We find that [C II] and [C I] emission predominantly arises from the lower density envelopes. We find little evidence for non-equilibrium chemistry providing a “carbon-rich” region as per Kamegai et al. (2003), finding instead that the atomic carbon distribution follows the C18O ridge through dust continuum peaks E and F. We find that like [C I], low-J CO emission stems predominantly from the envelopes, and high-J emission should stem from the denser clumps. Submillimeter HCO+ and infrared [O I] emission stems from the clumps and clump surfaces, respectively, and indicate clump surface temperatures of K, an ultraviolet radiation field with I (G), densities of 105 to 106 cm-3, and interior temperatures of K.
This study illustrates the use of far-infrared, submillimeter, and infrared spectroscopy for dissecting the complicated structure of clouds and star forming regions. Yet, numerous new advances in detector technology will soon enhance our understanding more dramatically, putting the evolution of clouds and stars in a more global, Galactic context. The advent of large-format infrared detector arrays will make broad and narrow band observations of hot dust and gas possible over entire clouds, as well as providing photometry for detailed extinction maps. Although integrated heterodyne detector arrays at submillimeter wavelengths are in their infancy, rapid progress is expected to revolutionize the radio universe as arrays have already done for the infrared. Finally, new airborne and space-based platforms such as the Spitzer Space Telescope, Herschel, SOFIA, and SAFIR will open up the far infrared, opening new windows into the chemical history of carbon, nitrogen, oxygen and water in the Galaxy.
References
- Abergel et al. (1996) Abergel, A. et al. 1996, A&A, 315, L329
- (2) André, P., Ward-Thompson, D. & Barsony, M. 1993, ApJ, 406, 122
- Ashby et al. (2000) Ashby, M. L. N., et al. 2000, ApJ, 539, L119
- (4) Bally, J., Stark, A. A., Wilson, R. W., & Langer, W. D. 1987, ApJ, 312, L45
- Black & van Dishoeck (1987) Black, J. H. & van Dishoeck, E. F. 1987, ApJ, 322, 412
- Blitz & Williams (1997) Blitz, L. & Williams, J. P. 1997, ApJ, 488, L145
- Blum & Pradhan (1992) Blum, R. D. & Pradhan, A. K. 1992, ApJS, 80, 425.
- (8) Boissé, P. 1990, A&A, 228, 483
- (9) Boulanger, F., Abergel, A., Falgarone, E., Habart, E., Pineau Des Forêts, G., & Verstraete, L. 1999, H2 in Space, meeting held in Paris, France, September 28th - October 1st, 1999. Eds.: F. Combes, G. Pineau des Forêts. Cambridge University Press, Astrophysics Series, E34
- (10) Burton, M. G., Hollenbach, D. J., & Tielens, A. G. G. M. 1990, ApJ, 365, 620
- (11) Cardelli, J. A. & Wallerstein, G. 1986, ApJ, 302, 492
- Carrasco, Strom, & Strom (1973) Carrasco, L., Strom, S. E., & Strom, K. M. 1973, ApJ, 182, 95
- (13) Ceccarelli, C., Caux, E., White, G. J., Molinari, S., Furniss, I., Liseau, R., Nisini, B., Saraceno, P., Spinoglio, L., & Wolfire, M. 1998, A&A, 331, 372
- (14) Crutcher, R. M. & Chu, Y. 1985, ApJ, 290, 251
- (15) de Jong, T., Boland, W., & Dalgarno, A. 1980, A&A, 91, 68
- Draine & Bertoldi (1996) Draine, B. T. & Bertoldi, F. 1996, ApJ, 468, 269
- Engargiola, Zmuidzinas, & Lo (1994) Engargiola, G., Zmuidzinas, J., & Lo, K. Y. 1994, Review of Scientific Instruments, 65, 1833
- Flower (1990) Flower, D. R. 1990, MNRAS, 242, 1P.
- Flower & Pineau-Des-Forets (1990) Flower, D. R. & Pineau-Des-Forets, G. 1990, MNRAS, 247, 500.
- (20) Frerking, M. A., Keene, J., Blake, G., & Phillips, T. G. 1989, ApJ, 344, 311
- Goldsmith et al. (2000) Goldsmith, P. F. et al. 2000, ApJ, 539, L123
- Hamaguchi, Corcoran, & Imanishi (2003) Hamaguchi, K., Corcoran, M. F., & Imanishi, K. 2003, PASJ, 55, 981
- (23) Hollenbach, D. J., Takahashi, T., & Tielens, A. G. G. M. 1991, ApJ, 377, 192
- (24) Howe, J. E., Jaffe, D. T., Genzel, R., & Stacey, G. J. 1991, ApJ, 373, 158
- Imanishi, Tsujimoto, & Koyama (2002) Imanishi, K., Tsujimoto, M., & Koyama, K. 2002, ApJ, 572, 300
- Irvine, Goldsmith, & Hjalmarson (1987) Irvine, W. M., Goldsmith, P. F., & Hjalmarson, A. 1987, ASSL Vol. 134: Interstellar Processes, 561
- Jaquet, Staemmler, Smith, & Flower (1992) Jaquet, R., Staemmler, V., Smith, M. D., & Flower, D. R. 1992, Journal of Physics B Atomic Molecular Physics, 25, 285.
- Johnstone et al. (2000) Johnstone, D., Wilson, C. D., Moriarty-Schieven, G., Joncas, G., Smith, G., Gregersen, E., & Fich, M. 2000, ApJ, 545, 327
- Kaufman, Wolfire, Hollenbach, & Luhman (1999) Kaufman, M. J., Wolfire, M. G., Hollenbach, D. J., & Luhman, M. L. 1999, ApJ, 527, 795
- (30) Keene, J., Blake, G., Phillips, T. G., Huggins, P. J., & Beichman, C. A. 1985, ApJ, 299, 967
- (31) Keene, J. 1987, SETI Conference Carbon in the Galaxy
- (32) Köster, B., Störzer, H., Stutzki, J., & Sternberg, A. 1994, A&A, 284, 545
- Langer (1985) Langer, W. D. 1985, Protostars and Planets II, 650
- (34) le Bourlot, J., Pineau des Forêts, G., Roueff, E., & Flower, D. R. 1993, A&A, 267, 233
- (35) Liseau, R., White, G., Larsson, B., Sidher, S., Olofsson, G., Kaas, A., Nordh, L., Caux, E., Lorenzetti, D., Molinari, S., Nisini, B., & Sibille, F. 1999, A&A, 344, 342
- Maloney, Hollenbach, & Tielens (1996) Maloney, P. R., Hollenbach, D. J., & Tielens, A. G. G. M. 1996, ApJ, 466, 561
- Mauersberger et al. (1992) Mauersberger, R., Wilson, T. L., Mezger, P. G., Gaume, R., & Johnston, K. J. 1992, A&A, 256, 640
- (38) Meixner, M., & Tielens, A. G. G. M. 1993, ApJ, 405, 216
- Mitchell (1984) Mitchell, G. F. 1984, ApJ, 287, 665
- Monteiro (1985) Monteiro, T. S. 1985, MNRAS, 214, 419
- Motte, André, & Neri (1998) Motte, F., André, P., & Neri, R. 1998, A&A, 336, 150
- Pequignot (1990) Pequignot, D. 1990, A&A, 231, 499.
- (43) Pineau Des Forêts, G., Roueff, E., & Flower, D. R. 1992, MNRAS, 258, 45P
- (44) Plume, R., Jaffe, D. T., Tatematsu, K., Evans, N. J., & Keene, J. 1999, ApJ, 512, 768
- (45) Rieke, G. H. & Lebofsky, M. J. 1985, ApJ, 288, 618
- Schieder, Tolls, & Winnewisser (1989) Schieder, R., Tolls, V., & Winnewisser, G. 1989, Experimental Astronomy, 1, 101
- Schinke et al. (1985) Schinke, R., Engel, V., Buck, U., Meyer, H., & Diercksen, G. H. F. 1985, ApJ, 299, 939
- Schröder et al. (1991) Schröder, K., Staemmler, V., Smith, M. D., Flower, D. R., & Jaquet, R. 1991, J. Phys. B, 24, 2487
- (49) Shu, F. H. 1977, ApJ, 214, 488
- Shu, Adams, & Lizano (1987) Shu, F. H., Adams, F. C., & Lizano, S. 1987, ARA&A, 25, 23
- Snell et al. (2000) Snell, R. L., et al. 2000, ApJ, 539, L101
- (52) Spaans, M. 1996, A&A, 307, 271
- Stark et al. (2001) Stark, A. A. et al. 2001, PASP, 113, 567
- (54) Stutzki, J., Stacey, G. J., Genzel, R., Harris, A. I., Jaffe, D. T., & Lugten, J. B. 1988, ApJ, 332, 379
- Tauber & Goldsmith (1990) Tauber, J. A. & Goldsmith, P. F. 1990, ApJ, 356, L63.
- (56) Tielens, A. G. G. M. & Hollenbach, D. 1985, ApJ, 291, 722
- (57) Walker, C. K., Kooi, J., & Jacobs, K. 2002, in preparation.
- (58) Wilking, B. A. & Lada C. J. 1983, ApJ, 274, 698
- Wilson et al. (1999) Wilson, C. D. et al. 1999, ApJ, 513, L139
- (60) Wilson, T. L. & Rood, R. 1994, ARA&A, 32, 191
- (61) van Dishoeck, E. F. & de Zeeuw, T. 1984, MNRAS, 206, 383
- van Dishoeck & Black (1988) van Dishoeck, E. F. & Black, J. H. 1988, ApJ, 334, 771
- (63) Wolniewicz, L., Simbotin, I., & Dalgarno, A. 1998, ApJS, 115, 293
- (64) Zmuidzinas, J. & LeDuc, H. G. 1999, IEEE Trans. Microwave Theory Tech., 40, 1797