Radial Variation of Optical and Near-Infrared Colours in Luminous Early-Type Galaxies in ABELL 2199
Abstract
We performed band surface photometry for luminous early-type galaxies in a nearby rich cluster ABELL 2199. Combining it with and band surface photometry, radial variations of and colours in the galaxies were investigated. It is found that the inner regions of the galaxies are redder in both of and colours. Comparing the radial variations of both of the colours with predictions of Simple Stellar Population (SSP) models for a range of ages and metallicities, it is suggested that the cluster ellipticals have negative metallicity gradients but their age gradients are consistent with zero, although our sample is small; the typical metallicity gradient is estimated to be in , while the age gradient is estimated to be in . Considering that similar results have also been derived in the other recent studies using samples of ellipticals in the Coma cluster and less dense environments, it seems that there is no strong dependence on galaxy environment in radial gradient of stellar population in elliptical galaxy.
keywords:
galaxies: elliptical and lenticular, cD — galaxies: evolution — galaxies: formation — galaxies: clusters: individual: ABELL 2199 — galaxies: fundamental parameters (colour gradient).1 INTRODUCTION
Elliptical galaxies in a cluster show a tight colour-magnitude (CM) relation; colours of more luminous ellipticals are systematically redder (e.g., Bower, Lucey, & Ellis 1992). It has been found that the relation still holds in distant rich clusters around (e.g., Stanford, Eisenhardt, & Dickinson 1998). Based on these observational results, galaxy evolution models taking into account chemical evolution claim that elliptical galaxies in rich clusters formed at, e.g., through a monolithic collapse of a gas cloud (e.g., Kodama & Arimoto 1997). In this monolithic formation, a radial variation of stellar population in the sense that stellar metallicity is higher on average towards the galaxy centre (metallicity gradient hereafter) is expected to form as a result of initial starburst and subsequent blow of galactic wind; a more extended period of active star formation and thus more chemical enrichment is expected in the inner portions of a galaxy (e.g., Kawata 1999). Indeed, many elliptical galaxies are known to have radial gradients of colours and absorption line strengths: colours are redder and metal absorption lines are stronger in the inner regions (e.g., Peletier et al. 1990; Davies, Sadler, & Peletier 1993), and the evolution of the colour gradients investigated by looking at distant ellipticals suggests that these gradients originate from the metallicity gradients (Tamura et al. 2000; Tamura & Ohta 2000; Saglia et al. 2000; La Barbera et al. 2003).
On the other hand, a bottom-up structure formation based on the Cold Dark Matter (CDM) universe generally succeeds in reproducing many observational aspects of galaxies in the present day universe. In this scheme, an elliptical galaxy is considered to form via a major merger of galaxies. Accordingly, even if the progenitors of an elliptical galaxy have some radial variations of stellar population, the variations are more likely to be smeared out during the merger. It is also expected that the histories of mass assembly and star formation of an elliptical galaxy can be different from galaxy to galaxy, even if elliptical galaxies having similar masses at a given redshift are considered. Therefore, the radial gradient of stellar population in an elliptical galaxy would not be expected to correlate with the galaxy mass, although there is a possibility that the gradients in more massive ellipticals are less steep because they are likely to experience more merging events on average than less massive systems.
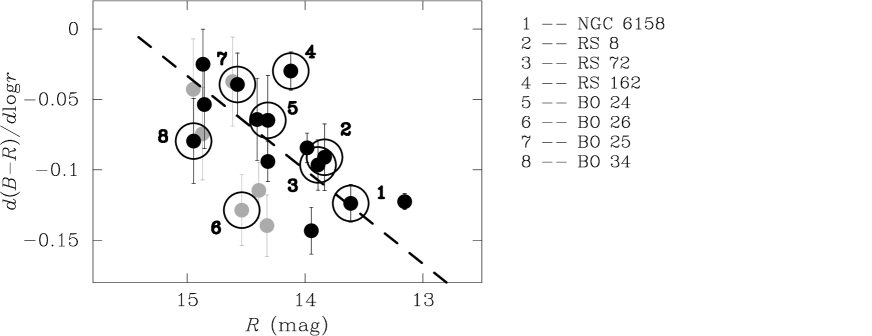
These considerations show that investigating colour or absorption line strength gradients in elliptical galaxies in a statistical manner is a potentially powerful probe of galaxy formation process (Kobayashi 2004). We recently performed and bands surface photometry for elliptical and S0 galaxies (E/S0s) in ABELL 2199, which is one of nearby rich clusters, to study their colour gradients (Tamura & Ohta 2003; hereafter Paper I). From these optical data, it is found that (1) the average metallicity gradient in the ellipticals estimated from their colour gradients on the assumption of no age gradient is in , which can be reproduced by a recent model of the monolithic-like galaxy formation (e.g., Kawata 1999), and (2) for the galaxies brighter than mag ( at the distance of ABELL 2199), more luminous ones tend to have steeper colour gradients (Figure 1). These results are consistent with the monolithic collapse scenario rather than the bottom-up scheme (Larson 1974; Carlberg 1984; Kawata & Gibson 2003). Considering that almost all the other previous studies have targeted ellipticals in environments less dense than ABELL 2199 and no such correlations have been found in the previous studies, our data may imply an environmental dependence of formation process of elliptical galaxy.
However, it is premature to conclude that the cluster E/S0s formed through the monolithic collapse scenario, and it needs to be confirmed that the galaxy luminosities correlate with the metallicity gradients. Although this requires to disentangle the age–metallicity degeneracy which is very hard in practice, one possible way to address this issue is to add another colour information including a near-infrared (NIR) band to the optical colour and see the radial variations of both of the two colours (e.g., Peletier, Valentijn, & Jameson 1990). It will allow us to see whether the colour variation is consistent with a pure metallicity gradient or a significant contribution of age gradient is essential to explain it. In this paper, we present results of band surface photometry for the E/S0 galaxies in ABELL 2199 to be combined with the optical surface photometry (Paper I). band is chosen to make a baseline of wavelength longer to break the degeneracy more clearly. Among the luminous ellipticals plotted in Figure 1, we observed 8 galaxies. We briefly summarise optical observation and then describe NIR observation and data reduction in the next section. Data analysis and results are presented in § 3. After discussing the results in § 4, we summarise this paper in § 5.
2 OBSERVATION AND DATA REDUCTION
2.1 Overall Description of Data Acquisition
We started studying colour gradients in the cluster ellipticals with optical data, which is described in Paper I in detail. We performed and bands surface photometry for 40 early-type (E, E/S0, and S0) galaxies in ABELL 2199 selected from the catalog by Lucey et al. (1997). The galaxy morphology listed by Lucey et al. (1997) is mostly taken from Butcher & Oemler (1985) and Rood & Sastry (1972). Although studying these morphologically selected early-type galaxies could be one option, it is known that there is a variety in spheroidal-to-total luminosity ratio among galaxies in each morphological type (Simien & de Vaucouleurs 1986) and some of them can be disk dominated galaxies. In order to securely sample galaxies dominated by spheroidal components, we made azimuthally averaged radial surface brightness profiles of the galaxies and performed decompositions of the profiles into bulge and disk components to estimate bulge-to-total luminosity ratios (s). We sampled galaxies with s in band larger than 0.6. This criterion isolates galaxies earlier than E/S0 or according to Simien & de Vaucouleurs (1986), where s of nearby galaxies are also derived in band. Eventually, 31 galaxies were sampled out of the 40 galaxies observed. The galaxies plotted in Figure 1 are those brighter than mag () and 8 of these galaxies were observed in band.
2.2 The optical observation
Since the details of the optical observation and data are described in Paper I, we briefly summarise them here. The imaging observations in and bands were performed on 20 and 21 June 2001 with Tektronix 2K2K CCD on the University of Hawaii 2.2m telescope. One pixel of the CCD subtends on sky and thus each frame covers a field of view of . A typical seeing size during the observing run was in FWHM. A total exposure time at each field is typically 1,800 sec in band and 750 sec in band, each of which was divided into three or four exposures with the telescope dithered.
The imaging data were reduced with IRAF111IRAF is distributed by the National Optical Astronomy Observatories, which is operated by the Association of Universities for Research in Astronomy, Inc. under cooperative agreement with the National Science Foundation in the standard procedure. After bias subtraction and flat-fielding by dome-flat frames, sky subtraction was carried out in each frame and the sky-subtracted frames at each field were registered by sub-pixel shifts. The FWHMs of the point spread functions (PSFs) were matched by convolutions of images with Gaussian kernels and these images were combined with the 3 clipping algorithm. Finally a PSF size of the stacked image in one band was matched to that in another band by smoothing with Gaussian kernels. A resulting PSF size is in FWHM.
| Galaxy | ||||||||||
| (mag) | (mag/dex) | (mag/dex) | (arcsec) | (mag) | (mag) | (mag) | (mag) | |||
| (1) | (2) | (3) | (4) | (5) | (6) | (7) | (8) | (9) | (10) | (11) |
| NGC 6158 | 13.6 | 10.4 | 0.1 | 1.6 | 1.72 | 2.78 | 0.01 | |||
| RS 8 | 13.8 | 5.8 | 0.3 | 2.5 | 1.56 | 2.79 | 0.15 | |||
| RS 72 | 13.9 | 5.5 | 0.3 | 2.5 | 1.71 | 2.81 | 0.01 | |||
| RS 162 | 14.1 | 5.9 | 0.3 | 1.9 | 1.66 | 2.81 | 0.04 | |||
| BO 24 | 14.3 | 3.6 | 0.4 | 2.9 | 1.72 | 3.00 | 0.04 | 0.24 | ||
| BO 26 | 14.6 | 3.0 | 0.5 | 2.8 | 1.70 | 2.70 | 0.02 | |||
| BO 25 | 14.6 | 5.3 | 0.3 | 1.8 | 1.55 | 2.78 | 0.12 | |||
| BO 34 | 15.0 | 6.4 | 0.2 | 1.3 | 1.53 | 2.69 | 0.12 |
2.3 The band observation
The band imaging observation was performed on 20 and 21 June 2003 with UFTI on UKIRT 3.8m. UFTI has a 1K1K array and one pixel of the detector subtends on sky, yielding a field of view of . A typical seeing size during the observing run was in FWHM. An exposure time of each frame was 40 sec or 60 sec and a total on-source integration time is typically 1,200 sec with the dither pattern of 9 telescope pointings. Since the apparent size of a target is too extended to make flat-field frames from object frames themselves, the on-source exposures were interlaced by exposures of adjacent blank sky regions with the same exposure time as that of the object frames.
These band imaging data were reduced with IRAF. After dark subtraction, we carried out flat-fielding using sky-flat frames. To make a sky-flat frame, we stacked 5 blank sky frames and normalised the stacked image by its modal pixel value. An object frame was flat-fielded by the sky-flat frame constructed with the blank sky frames which were taken close in observation time to the object frame. This method allows us to correct for the complex pattern seen in the flat-field frame whose contrast slightly varies with time. The flat-fielded blank sky frames have very uniform distribution of brightness across the field of view (global variation is 0.1 % or even smaller and pixel-to-pixel variation is 1 %), which is reasonable for an image looking at such a small area on the sky.
Sky subtraction was performed by estimating a single background value in each object frame, where the following two steps were employed. Firstly, a sky background in each frame was estimated by calculating the modal pixel value after bright objects were masked and was subtracted. The images taken with the telescope dithered around each target were registered by sub-pixel shifts and these registered images were stacked with the 3 clipping algorithm. Secondly, since objects which are too faint to be found in the individual exposure but may cause a wrong estimation of sky background are detectable in this stacked image, they were picked out using SExtractor version 2.2.2 (Bertin & Arnout 1996). The coordinates of these objects were de-registered to those in the unregistered frames and the pixels where the objects should be were masked. The sizes and shapes of the masks were defined based on those measured in the stacked image. Then, a sky background was re-estimated in each of the masked images and it was subtracted.
These sky-subtracted images were registered by sub-pixel shifts and, after the FWHMs of stellar objects in the sky-subtracted and registered frames were matched by convolutions of images with Gaussian kernels, they were stacked with the 3 clipping algorithm. Finally, the band stacked image was aligned with the optical data by using stars in the field of view and a Gaussian convolution was employed to match the FWHMs of stellar objects with those in the optical images.
2.4 Calibration
For the optical data, the photometric calibration was performed using the standard stars in Landolt (1992). Several standard star fields were observed at the beginning and end of each night. Since the weather was slightly non-photometric, an external check of the accuracy of the calibration was performed using aperture photometry data and growth curves for several galaxies, which were taken from HYPERCAT222http://www-obs.univ-lyon1.fr/hypercat. There seem to be zero-point offsets between our growth curves and those from HYPERCAT; the amounts of the offsets are mag in each band. We will come back to the treatment of these offsets later.
For the band data, the photometric calibration was carried out using UKIRT Faint Standard stars (Hawarden et al. 2001). About 10 standard stars were observed at the beginning and end of each night. The weather was clear and stable during the two nights and the photometric zero-point can be determined with an accuracy of 0.02 mag from the data of standard stars.
It is found that some of the galaxies have colours slightly inconsistent ( mag) with those of typical luminous ellipticals in the local universe and this can be due to the calibration error in and bands. We correct for these offsets using the CM relation. We assume that the CM relation in the Coma cluster also exists in ABELL 2199, and their “true” colours are estimated using stellar populations modelled by Kodama et al. (1998) using a population synthesis model so that the CM relations in and colours obtained in the Coma cluster by Bower et al. (1992) are well reproduced. We estimated and colours of the sample galaxies within an aperture of 12′′ (5 kpc) in diameter (Table 1), which is equivalent to that in Bower et al. (1992), and estimated the deviations of the colours from the CM relations at their luminosities and adopted the values as zero-point offsets of the colours. The amount of the offset applied to each object is listed in Table 1. These are corrected for in the following presentations of the colours. We note that the colour of BO 24 is 0.2 mag redder than the others. Since its colour is not unusual, we also attribute this shift to an observational error and corrected for it using the CM relation in the same method as above. It should be stressed that these corrections are performed by shifting zero points of colours and do not affect any spatial variations of colour in galaxies, which are focused on in this paper. We performed these corrections only for clarity in comparing the data with variations of colours predicted by population synthesis models as described in the next section.
3 DATA ANALYSES AND RESULTS
3.1 Radial Profiles of Surface Brightness and Colours in Galaxies
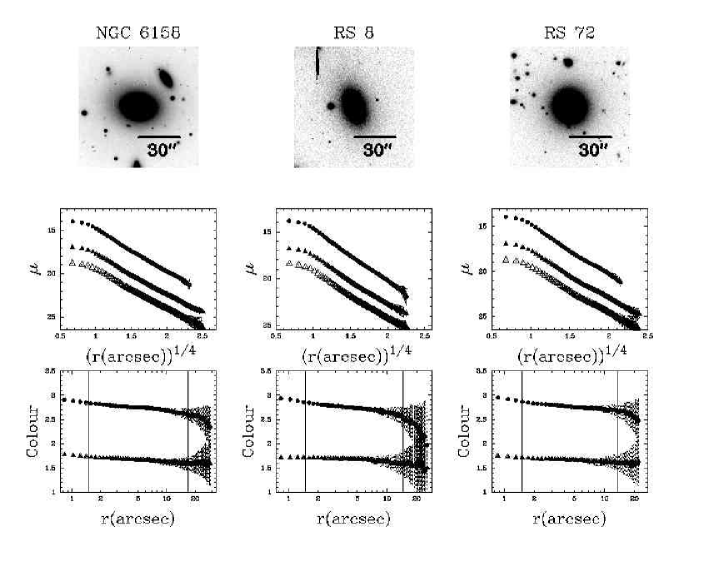
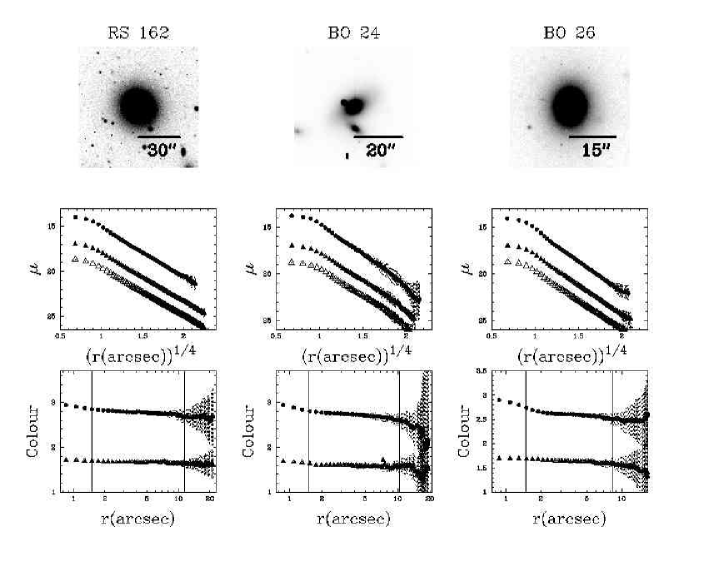
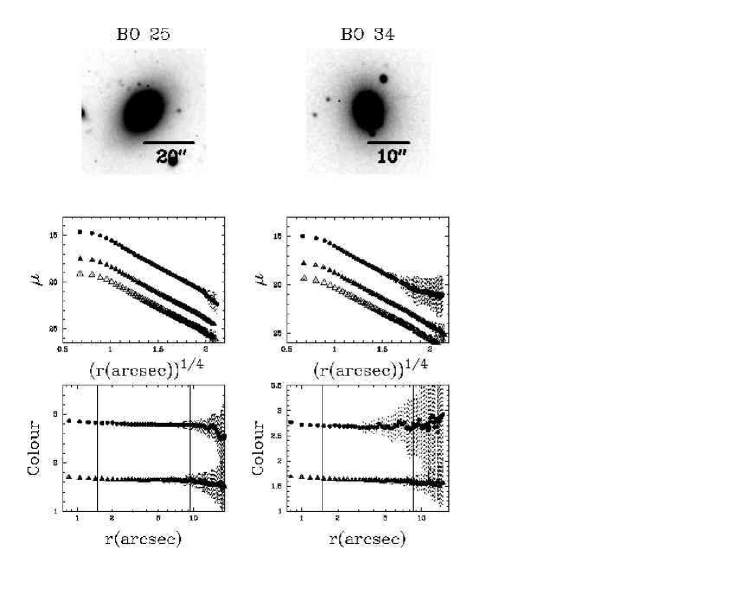
The radial surface brightness profiles of the galaxies in , , and bands are indicated in Figure 2. These profiles were obtained along ellipses fitted to the isophotes with the ELLIPSE task in the STSDAS package with a radial sampling of 022 (1 pix) along major axis. Since bright objects in the neighbor of a target galaxy may have serious effects on the fitted ellipses, the neighbors are masked out beforehand. In fitting an ellipse to an isophote, ellipticity is set to be a free parameter. Galaxy centre is fixed to a centroid of a galaxy in the band image and position angle is also fixed to that of an ellipse within which half of the galaxy light is included. In the following analyses, all of the radial profiles and the parameters related to radius are expressed in terms of the equivalent radius of an ellipse: , where and are the semi-major and semi-minor axes of the ellipse.
Before obtaining radial colour profiles in the sample galaxies, we made the colour maps of the galaxies after the seeing sizes in both of and bands were matched (Paper I). They demonstrate that almost all the galaxies show axisymmetric colour distributions independent of morphology and luminosity and that their radial colour profiles and the colour gradients well represent the two dimensional colour distributions. We also made the colour maps of the galaxies observed in the band and found that their trends are the same as those in .
The radial profiles of and colour of a sample galaxy are constructed by subtracting the surface brightness profile in the band from those in and bands, both of which were made along the same ellipses fitted to isophotes in the band image. The results are shown in the bottom panels of Figure 2. An error bar attached to each data point in the colour profile includes a local sky subtraction error and a standard deviation of colours along each elliptical isophote. To estimate the sky subtraction error, we construct a histogram of pixel values in blank regions of a fully reduced image where surface photometry of a galaxy is performed. Then we adopt the standard deviation around the modal value as an error of background estimation. In the optical data, the pixel values in an annulus around each target whose inner radius and width are and (50 pix), respectively, were used to make the histogram. In the band data, pixels which remained after objects were masked were investigated in each object frame. In the following, we focus on the portions of the galaxies between the inner and outer cutoff radii, which were defined to avoid the regions where colour distributions are seriously affected by seeing effects and those where colours are rather poorly determined.
The outer cutoff radius is defined to be a radius where the band surface brightness of a galaxy is 22.5 mag/arcsec2 (Paper I). At this radius, the typical error of colour amounts to 0.1 mag. Since the typical error of colour is also 0.1 mag at this radius, it is reasonable to adopt the same cutoff as that applied to the optical data in investigating the radial profiles of colour and estimating the gradients. The colour profile of BO 34 (Figure 2) starts becoming noisy at a smaller radius than in the other galaxies due to the 40 % shorter integration time in the band.
The inner cutoff radius is necessary to mitigate seeing effects on colour gradients. In order to define this, we performed simulations using artificial elliptical galaxies added on the real images to investigate deviations of measured colour gradients from the intrinsic values caused by seeing effects. We also investigated their dependences on size, luminosity, ellipticity, and intrinsic colour gradient of model elliptical galaxy (see Paper I for details). Based on the simulations, we defined the inner cutoff radius to be , which can reduce the deviation of a measured colour gradient from the intrinsic value down to the level comparable to a fitting error of the regression line. It should be mentioned that since the FWHMs of stellar objects in the band images are smaller than those in the and band images and the band data were smoothed to match the FWHMs with those in the optical data, this inner cutoff is not required to be modified.
To summarise, the same inner and outer cutoffs defined in colour can be adopted to the radial colour profiles in . In Table 1, the cutoff radii for each galaxy scaled by the effective radius are tabulated. The and colour gradients calculated by fitting regression lines to the colour profiles between the inner and outer cutoff radii are also listed.
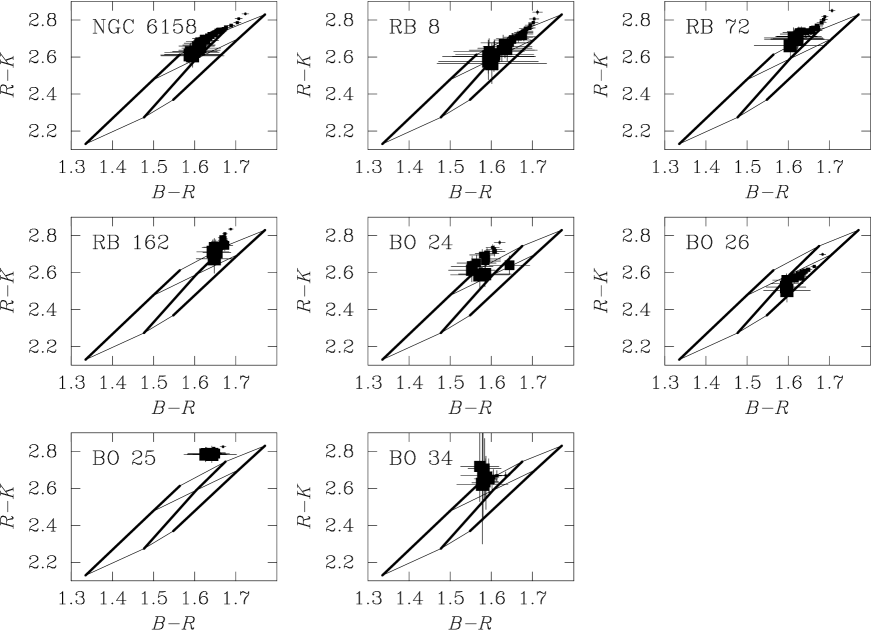
3.2 Spatially Resolved and Diagrams
In Figure 3, the and colours of each target galaxy within the region between the inner and outer cutoff radii are shown. The colours at outer radii are indicated with larger symbols and the radial sampling is the same as that in the radial colour profiles in Figure 2 (022). The two colour diagrams are ordered in decreasing luminosity from left to right and top to bottom (NGC 6158 is the most luminous and BO 34 is the least luminous). The data points in each panel show a basic trend of radial colour variation that colours are redder in both of and at smaller radii. It is interesting to note that although the sample is small, there seems to be a variety in distribution of the colours on the diagram from galaxy to galaxy.
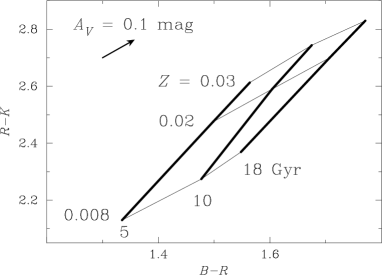
Although it is hard to disentangle the age-metallicity degeneracy, it is still possible to obtain some insight into how stellar age and metallicity vary across a galaxy by comparing the and colour variations with predictions from a simple stellar population (SSP) model. The grid superposed on the two colour diagrams indicates variations of and colours of an SSP model along with its age and metallicity. This is constructed using the SSP models by PEGASE Ver 2.0 (Fioc & Rocca-Volmerange 1997) with the Salpeter Initial Mass Function (IMF). The details of the SSP models for the grid are indicated in Figure 4. We sample the ages of 5, 10, and 18 Gyr and the metallicities of 0.008 (0.4 ), 0.02 (), and 0.03 (1.5 ). It is stressed that only relative values of age and metallicity from a model are discussed here and determining their absolute values in a galaxy is beyond the scope of this paper.
Comparing the data points with the grid in Figure 3, it is suggested that the colour distributions tend to be in parallel with the prediction for a constant age and it seems to be dominated by a metallicity gradient in the sense that stars are more metal rich in the inner regions. In most of the ellipticals, the data do not seem to support that the primary origin of the colour gradients is an age gradient.
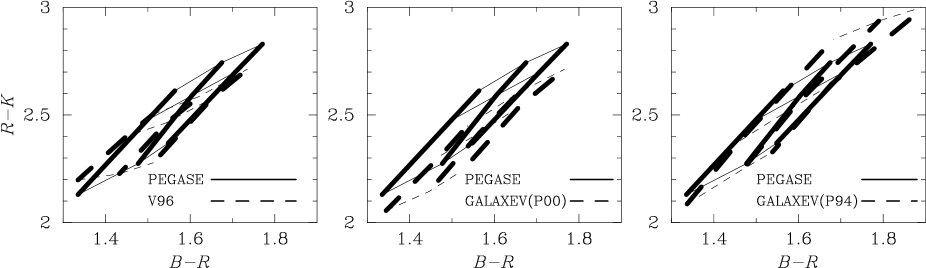
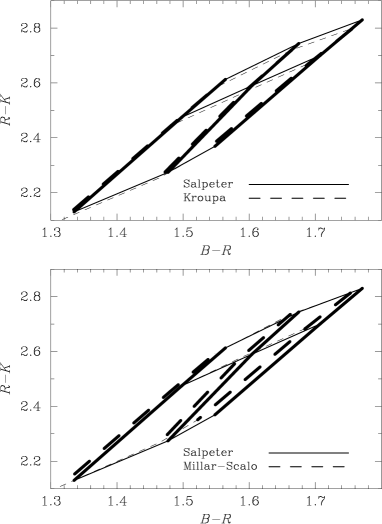
It is worth investigating how much the grid on the two colour diagram can vary from model to model. We compare the grid by PEGASE with that by Vazdekis et al. (1996; hereafter V96) and those by GALAXEV (Bruzual & Charlot 2003) with the Padova 1994 (P94) or Padova 2000 (P00) evolutionary tracks in Figure 5 where the Salpeter IMF is adopted for all the models. The lower and upper mass cutoffs are 0.1 and 100 in PEGASE, 0.0992 and 72 in V96, and 0.1 and 120 in GALAXEV. Note that for the GALAXEV model with the P94 evolutionary tracks, the metallicity of the most metal rich SSPs is 2.5 times larger than the solar value, while it is 1.5 times larger than the solar value for all the other models. By using PEGASE, variation of the grid due to choice of IMF is also investigated. The grids for three representative IMFs are indicated in Figure 6; the Salpeter IMF, the Kroupa IMF (Kroupa, Tout & Gilmore 1993), and the Millar-Scalo IMF (Miller & Scalo 1979). As shown in Figure 5, there is some discrepancy in the shape of the grid as well as its location on the two colour diagram among the models. On the other hand, Figure 6 suggests that both of the shape and location of the grid are rather insensitive to choice of IMF.
Considering contributions of both age and metallicity gradients, a colour gradient can be described as follows:
| (1) |
where
| (2) |
and
| (3) |
Given the sensitivities of and colours to age and metallicity (i.e., and ) which can be estimated with an SSP model, the age and metallicity gradients can be worked out simultaneously using the and colour gradients derived with the data. A similar method has been applied to absorption line strength gradients (Kobayashi & Arimoto 1999; Mehlert et al. 2003; see also Henry & Worthey 1999). The coefficient of is determined within a range of metallicity () by using colours predicted with SSPs having a single age (10 Gyr). The coefficient of is calculated within a range of age between 5 Gyr and 18 Gyr by using SSPs having the solar metallicity. We calculated these coefficients for each of the SSP models (PEGASE, V96, and GALAXEV with P94333For GALAXEV with P94, the coefficient is determined for . and P00) with the Salpeter IMF assumed (Table 2) and derived age and metallicity gradients of a galaxy. The results from our data are shown in Table 3, indicating that negative metallicity gradients (stellar metallicity is higher towards the galaxy centre) are detected in all the cluster ellipticals but BO 34, while an age gradient is significantly detected only in NGC 6158. This suggests that the cluster ellipticals have metallicity gradients while their age gradients are consistent with zero; using PEGASE, the typical metallicity gradient is estimated to be in , while the age gradient is estimated to be in . It is mentioned that although estimated values of age and metallicity gradients depend on model, the qualitative trend that the cluster ellipticals have negative metallicity gradients but age gradients are not detected significantly can be seen in all the models.
| Model | ||||
|---|---|---|---|---|
| (1) | (2) | (3) | (4) | (5) |
| PEGASE | 0.34 | 0.38 | 0.82 | 0.40 |
| V96 | 0.33 | 0.37 | 0.63 | 0.32 |
| GALAXEV (P94) | 0.56 | 0.39 | 1.20 | 0.47 |
| GALAXEV (P00) | 0.27 | 0.33 | 0.58 | 0.41 |
4 DISCUSSION
| Galaxy | Model | ||
|---|---|---|---|
| (dex-1) | (dex-1) | ||
| (1) | (2) | (3) | (4) |
| PEGASE | |||
| NGC 6158 | V96 | ||
| GALAXEV (P94) | |||
| GALAXEV (P00) | |||
| PEGASE | |||
| RS 8 | V96 | ||
| GALAXEV (P94) | |||
| GALAXEV (P00) | |||
| PEGASE | |||
| RS 72 | V96 | ||
| GALAXEV (P94) | |||
| GALAXEV (P00) | |||
| PEGASE | |||
| RS 162 | V96 | ||
| GALAXEV (P94) | |||
| GALAXEV (P00) | |||
| PEGASE | |||
| BO 24 | V96 | ||
| GALAXEV (P94) | |||
| GALAXEV (P00) | |||
| PEGASE | |||
| BO 26 | V96 | ||
| GALAXEV (P94) | |||
| GALAXEV (P00) | |||
| PEGASE | |||
| BO 25 | V96 | ||
| GALAXEV (P94) | |||
| GALAXEV (P00) | |||
| PEGASE | |||
| BO 34 | V96 | ||
| GALAXEV (P94) | |||
| GALAXEV (P00) |
It has also been suggested from the other recent studies that nearby ellipticals have negative metallicity gradients while their age gradients are consistent with zero (Mehlert et al. 2003; Wu et al. 2004). The presence of a metallicity gradient and the absence of an age gradient are consistent with the monolithic collapse scenario. The typical metallicity gradient estimated from gradients of colours and metal absorption line strengths in nearby ellipticals could be reproduced in a recent model of galaxy formation through a monolithic-like process (e.g., Kawata 1999). Since all stars are presumed to form nearly coevally at high redshift in this scenario, no significant variation in stellar age across a galaxy would be expected. On the other hand, it is less clear what kind of radial variations of stellar populations can be formed in elliptical galaxies in the framework of hierarchical galaxy formation, while it has recently been suggested by numerical simulations that metallicity gradients estimated in nearby ellipticals assuming no age gradients can be reproduced including its variety (Kobayashi 2004). It is intriguing to mention that unlike the monolithic collapse scenario, an age gradient can be acquired due to star formation associated with mergers and/or accretions. Exploring what kind of age gradients elliptical galaxies could possess in the hierarchical galaxy formation may provide clues to understanding their formation processes and evolutionary histories (Benson, Ellis & Menanteau 2002).
Our data also suggest that colour distributions on the two colour diagram tend to be less scattered in less luminous cluster ellipticals. In other words, stellar populations may be spatially more uniform in less luminous cluster ellipticals. This is not because in less luminous ellipticals colours are investigated within the smaller portions of galaxies; the outer cutoff radii scaled by effective radii are similar in all the galaxies (Table 1). If the colour gradients originate from pure metallicity gradients, this trend would indicate that the metallicity gradients correlate with the galaxy luminosities and could support the monolithic collapse scenario (Larson 1974; Carlberg 1984; Kawata & Gibson 2003). However, the metallicity gradients estimated using both of the and colour gradients do not seem to well correlate with the luminosities. This may simply be due to the poor statistics and/or the individual measurements of the metallicity gradients may be too coarse. More precise estimations of age and metallicity gradients for a larger sample of galaxies will be necessary for detailed studies of the relationship between radial variation of stellar population and galaxy luminosity in the cluster ellipticals.
Age and metallicity gradients in nearby ellipticals have recently been investigated in a range of galaxy environment. In Mehlert et al. (2003), the age and metallicity gradients in 35 elliptical and S0 galaxies in the Coma cluster were estimated from the gradients of absorption line indices (H, Mg and Fe). In Wu et al. (2004), the gradients in 36 elliptical and S0 galaxies in the Sloan Digital Sky Survey Early Data Release which are sampled not from a specific cluster but from various environments were estimated with multi band surface photometry from optical to NIR. Including our study of the luminous early-type galaxies in a rich cluster ABELL 2199, the presence of a metallicity gradient and the absence of an age gradient have been suggested in all of these studies. This may imply that there is no strong dependence on galaxy environment in radial gradient of stellar population in elliptical galaxy.
Finally, it should be mentioned that dust extinction may have some effects on a colour gradient in an elliptical galaxy (e.g., Goudfrooij & de Jong 1995). As a matter of fact, even if an elliptical galaxy consists of a mixture of stars without any radial gradients of stellar population and diffusely distributed dust, a calculation of the radiative transfer in the galaxy suggests that the colour gradients could be reproduced only by the dust effects (Witt, Thronson, & Capuano 1992; Wise & Silva 1996). However, many elliptical galaxies show not only colour gradients but also metal absorption line strength gradients, which are unlikely to be created by effects of dust extinction. It has also been suggested that on average, metallicity gradients in elliptical galaxies as estimated by a population synthesis model from colour gradients are consistent with those estimated from absorption line index gradients (e.g., Peletier et al. 1990; Davies et al. 1993). Nevertheless there are some exceptions and it is hard to isolate the effect of dust extinction on an individual galaxy basis. Future observation in the far-infrared with high spatial resolution may be able to give constraints on such a spatial variation of effects of dust extinction.
5 SUMMARY
We performed band surface photometry for luminous early-type galaxies in a nearby rich cluster ABELL 2199. Combining it with and band surface photometry, radial variations of and colours in the galaxies were investigated. It is found that the inner regions of the galaxies are redder in both of and colours. Comparing the radial variations of both of the colours with predictions of SSP models for a range of ages and metallicities, it is suggested that cluster ellipticals have metallicity gradients but their age gradients are consistent with zero, although the sample is small; the typical metallicity gradient is estimated to be in , while the age gradient is estimated to be in . Since similar results have also been obtained in the other recent studies by investigating ellipticals in the Coma cluster and less dense environments, it seems that radial gradients of stellar populations in elliptical galaxies and thus their evolutionary histories are rather insensitive to galaxy environment.
Considering the trend found in our optical study that less luminous ellipticals have less steep colour gradients, it is suggested that they have spatially more uniform distributions of both and colours and thus probably stellar population. However the metallicity gradients estimated using both of the and colours do not seem to well correlate with the galaxy luminosities. This may simply be due to the poor statistics and/or the individual measurements of the metallicity gradients may be too coarse. More precise estimations of age and metallicity gradients for a larger sample of galaxies will be necessary for detailed studies of the relationship between radial variation of stellar population and galaxy luminosity in the cluster ellipticals.
Acknowledgments
We are grateful to the staff of the Joint Astronomy Centre for its support of the UKIRT observation. We appreciate the support from the members of the University of Hawaii observatory. We also thank the referee, Dr. Francesco La Barbera, for helpful comments and advice. This research made use of the NASA/IPAC Extragalactic Database (NED), which is operated by the Jet Propulsion Laboratory, California Institute of Technology, under a contract with the National Aeronautics and Space Administration.
References
- Benson, Ellis & Menanteau (2002) Benson, A. J., Ellis, R. S., & Menanteau, F. 2002, MNRAS, 336, 564
- Bertin & Arnouts (1996) Bertin, E., & Arnouts, S. 1996, A&AS, 117, 393
- Bower, Lucey & Ellis (1992) Bower, R. G., Lucey, J. R., & Ellis, R. S. 1992, MNRAS, 254, 601
- Bruzual & Charlot (2003) Bruzual, G., & Charlot, S., 2003, MNRAS, 344, 1000
- Butcher & Oemler (1985) Butcher, H. R., & Oemler, A. Jr., 1985, ApJS, 57, 665
- Carlberg (1984) Carlberg, R. G. 1984, ApJ, 286, 403
- Davies, Sadler & Peletier (1993) Davies, R. L., Sadler, E. M., & Peletier, R. F. 1993, MNRAS, 262, 650
- Fioc & Rocca-Volmerange (1997) Fioc, M., & Rocca-Volmerange, B. 1997, A&A, 326, 950
- Goudfrooij & de Jong (1995) Goudfrooij, P. & de Jong, T. 1995, A&A, 298, 784
- Hawarden et al. (2001) Hawarden, T. G., Leggett, S. K., Letawsky, M. B., Ballantyne, D. R., & Casali, M. M. 2001, MNRAS, 325, 563
- Henry & Worthey (1999) Henry, R. B. C., & Worthey, G. 1999, PASP, 111, 919
- Kawata (1999) Kawata, D. 1999, PASJ, 51, 931
- Kawata & Gibson (2003) Kawata, D., & Gibson, B. K. 2003, MNRAS, 340, 908
- Kobayashi (2004) Kobayashi, C. 2004, MNRAS, 347, 740
- Kobayashi & Arimoto (1999) Kobayashi, C., & Arimoto, N. 1999, ApJ, 527, 573
- Kodama & Arimoto (1997) Kodama, T., & Arimoto, N. 1997, A&A, 320, 41
- Kodama et al. (1998) Kodama, T., Arimoto, N., Barger, A. J., & Aragón-Salamanca, A. 1998, A&A, 334, 99
- Kroupa, Tout & Gilmore (1993) Kroupa, P., Tout, C. A., & Gilmore, G. 1993, MNRAS, 262, 545
- La Barbera et al. (2003) La Barbera, F., Busarello, G., Massarotti, M., Merluzzi, P., & Mercurio, A. 2003, A&A, 409, 21
- Landolt (1992) Landolt, A. U. 1992, AJ, 104, 340
- Larson (1974) Larson, R. B. 1974, MNRAS, 169, 229
- Lucey et al. (1997) Lucey, J. R., Guzmán, R., Steel, J., & Carter, D. 1997, MNRAS, 287, 899
- Mehlert et al. (2003) Mehlert, D., Thomas, D., Saglia, R. P., Bender, R., & Wegner, G. 2003, A&A, 407, 423
- Miller & Scalo (1979) Miller, G. E., & Scalo, J. M. 1979, ApJS, 41, 513
- Peletier et al. (1990) Peletier, R. F., Davies, R. L., Illingworth, G. D., Davis, L. E., & Cawson ,M. 1990, AJ, 100, 1091
- Peletier, Valentijn & Jameson (1990) Peletier, R. F., Valentijn, E. A., & Jameson, R. F. 1990, A&A, 233, 62
- Rood & Sastry (1972) Rood, H. J., & Sastry, G. N. 1972, AJ, 77, 451
- Saglia et al. (2000) Saglia, R. P., Maraston, C., Greggio, L., Bender, R., & Ziegler, B. 2000, A&A, 360, 911
- Simien & de Vaucouleurs (1986) Simien, F., & de Vaucouleurs, G. 1986, ApJ, 302, 564
- Stanford, Eisenhardt & Dickinson (1998) Stanford, S. A., Eisenhardt, P. R., & Dickinson, M. 1998, ApJ, 492, 461
- Tamura et al. (2000) Tamura, N., Kobayashi, C., Arimoto, N., Kodama, T., & Ohta, K. 2000, AJ, 119, 2134
- Tamura & Ohta (2000) Tamura, N., & Ohta, K. 2000, AJ, 120, 533
- Tamura & Ohta (2003) Tamura, N., & Ohta, K. 2003, AJ, 126, 596 (Paper I)
- Vazdekis et al. (1996) Vazdekis, A., Casuso, E., Peletier, R. F., & Beckman, J. E. 1996, ApJS, 106, 307 (V96)
- Wise & Silva (1996) Wise, M. W., & Silva, D. R. 1996, ApJ, 461, 155
- Witt, Thronson & Capuano (1992) Witt, A. N., Thronson, H. A. Jr., & Capuano, J. M. Jr. 1992, ApJ, 393, 611
- Wu et al. (2004) Wu, H., Shao, Z., Mo, H. J., Xia, X., & Deng, Z. 2004, ApJ, submitted (astro-ph/0404226)