Circumnuclear Structure and Black Hole Fueling: HST/NICMOS Imaging of 250 Active and Normal Galaxies
Abstract
Why are the nuclei of some galaxies more active than others? If most galaxies harbor a central massive black hole, the main difference is probably in how well it is fueled by its surroundings. We investigate the hypothesis that such a difference can be seen in the detailed circumnuclear morphologies of galaxies using several quantitatively defined features, including bars, isophotal twists, boxy and disky isophotes, and strong non-axisymmetric features in unsharp masked images. These diagnostics are applied to 250 high-resolution images of galaxy centers obtained in the near-infrared with NICMOS on HST. To guard against the influence of possible biases and selection effects, we have carefully matched samples of Seyfert 1, Seyfert 2, LINER, starburst and normal galaxies in their basic properties, taking particular care to ensure that each was observed with a similar average scale ( parsecs per pixel). Several morphological differences among our five different spectroscopic classifications emerge from the analysis. The HII/starburst galaxies show the strongest deviations from smooth elliptical isophotes, while the normal galaxies and LINERS have the least disturbed morphology. The Seyfert 2 galaxies have significantly more twisted isophotes than any other category, and the early-type Seyfert 2s are significantly more disturbed than the early-type Seyfert 1s. The morphological differences between Seyfert 1s and 2s suggest that more is at work than simply the viewing angle of the central engine. They may correspond to different evolutionary stages.
1 Introduction
The established theoretical explanation for Seyfert activity requires that all active galactic nuclei (AGNs) must have formed central massive black holes (BHs) and are now fueling them, presumably with gas from the host galaxy that has lost most of its orbital angular momentum. However, BHs are not exclusive to AGNs, since quiescent ones are now found in most, if not all, galaxies with massive spheroids. The BH mass seems to depend on certain properties of the bulge in which it resides (Ferrarese & Merritt, 2000; Gebhardt et al., 2000; Tremaine et al., 2002; Marconi & Hunt, 2003). But only a fraction of galaxies (Ho, Filippenko, & Sargent, 1997a; Miller et al., 2003) host AGN, and it is not understood why some galaxies contain AGNs, while the majority do not.
The prevailing explanation implicates the efficiency of nuclear fueling. Although the gas available for fueling the AGN may play an important role, there is as yet only weak evidence for larger gas fractions in Seyfert galaxies (e.g., Hunt et al. 1999a). Most research has instead concentrated on the mechanism by which disk gas loses its angular momentum, thereby becoming available to feed the BH. The main focus has been on galactic bars, which are efficient at transporting gas on kpc scales, but are unable to funnel gas inward to strictly nuclear scales (pc–tens of pcs); to overcome this, nested bars were proposed as a possible mechanism (Shlosman, Frank, & Begelman, 1989). Nevertheless, Seyfert galaxies have not shown an excess of of large-scale bars (Moles, Marquez, & Perez, 1995; McLeod & Rieke, 1995; Ho, Filippenko, & Sargent, 1997b; Mulchaey & Regan, 1997; Regan & Mulchaey, 1999; Hunt & Malkan, 1999; Regan & Mulchaey, 1999; Márquez et al., 2000), although Seyferts may host bars on smaller spatial scales (Knapen, Shlosman, & Peletier, 2000; Laine et al., 2002). It has also been suggested that only type 2 Seyferts show an excess of bars (Maiolino et al., 1997).
Another focus has been on tidal interactions, since these are also theoretically viable mechanisms for inward gas transport (Hernquist, 1989; Barnes & Hernquist, 1991). However, Seyferts are found neither preferentially in interacting systems nor with an excess of companions (Fuentes-Williams & Stocke, 1988; de Robertis, Yee, & Hayhoe, 1998), although this too is still a point of debate (Dultzin-Hacyan et al., 1999; Krongold, Dultzin-Hacyan, & Marziani, 2002).
Hence, it appears that large-scale galactic structure in Seyfert host galaxies (with the possible exception of their disks, see Hunt et al. 1999a), has little bearing on the creation and fueling of the AGN. It is possible however that the causes (or effects) of the AGN can be found on small spatial scales, such as those available to HST. Indeed, using a sample of HST/NICMOS images, Martini & Pogge (1999) and Regan & Mulchaey (1999) suggested that nuclear spirals are responsible for fueling AGNs, but later work did not confirm this (Martini et al., 2003b). With much of the same imaging data, Laine et al. (2002) found a significant excess of bars in Seyferts on all spatial scales, including circumnuclear bars as revealed by HST. Again there is no consensus about AGN fueling mechanisms even with careful analyses of virtually the same high-resolution images.
In this paper, we readdress the issue of AGN fueling on small spatial scales with the largest sample of active and non-active galaxies ever compiled in this context. We start with virtually all galaxies imaged with HST/NICMOS in the F160W (H band, 1.6 m) filter, but carefully construct subsamples separated according to activity type so as to eliminate potential biases. Our study differs from previous ones in several important ways: (i) to maximize sample size, we incorporate data from all three NICMOS cameras, taking care to ensure that the images have similar spatial scales; (ii) LINERs and HII/starburst galaxies are included in the analysis in order to investigate possible evolutionary trends and the importance of star formation; (iii) active and non-active samples are constructed to have comparable medians and ranges in parsec-to-pixel spatial scale, B-band luminosity, distance, inclination, and Hubble type; (iv) objective techniques are used to detect isophotal twists, bars, boxy/disky isophotes, banana or heart-shaped isophotes, and non-axisymmetric structure in unsharp masked images. Except for bars and visually identified non-axisymmetric structure, none of these features has been analyzed previously.
Morphology studies such as this one are best conducted in the near-infrared (NIR) bands in general, and the F160W filter in particular. The NIR effectively traces the bulk of the stellar mass because of its sensitivity to the cooler stars which dominate evolved stellar populations. This means that the massive stars associated with recent star formation are less apt to disturb morphology, allowing us to use the NIR images as a rough proxy for mass distributions. NIR wavelengths are also much less affected by dust extinction than optical bands, and suffer very little gas contamination.
Our initial sample of 250 galaxies includes all nuclear activity classes, from “normal” (non-active) and HII/starburst, to LINER, and Seyfert galaxies of both types, so that we can perform a comparative analysis, and investigate how nuclear morphology of the galaxy influences, if at all, the creation and fueling of an AGN.
2 The Images
We have acquired HST/NICMOS F160W images of 30 Seyfert galaxies in a GO Snapshot Program (ID 5479, Malkan PI). Our GO snapshots have been augmented with other F160W snapshot images from the HST archive acquired with all three NICMOS cameras (Pogge-ID 7867, Mulchaey -ID 7330, Sparks-ID 7919, Stiavelli-ID 7331, Peletier-ID 7450).
2.1 Target Selection
Our Snapshot targets were a subset of Seyfert galaxies with z0.015 listed in the 1993 Veron-Cetty and Veron AGN catalog (Veron-Cetty & Veron, 1993), imaged in a WFPC2 Snapshot program (ID 5479, Malkan PI). Many were selected because of their unusual properties. For example, several galaxies classified as Seyfert 1s had no detectable point source in our WFPC2 images, while several galaxies classified as Seyfert 2s showed strong point sources. About half of the targets –particularly those with strong point-like nuclei– were observed with the highest resolution camera, NIC-1 (0.043 arcsec pixels; 11 arcsec field-of-view: FOV). The remainder were observed with the medium resolution camera, NIC-2 (0.075 arcsec pixels; 19.2 arcsec FOV).
The other observed sets of Seyfert galaxies were based on similar criteria. Using NIC-1, Pogge imaged 23 of the CfA Seyfert 2s (Huchra & Burg, 1992) known from WFPC2 imaging to have dusty centers. With NIC-2, Mulchaey observed 104 Seyfert and comparison normal galaxies, selected from the Revised Shapley-Ames (RSA) catalog, excluding those with km s-1 and axial ratios .
Normal spiral samples were more diversified, but comprise mainly early Hubble types. A large sample of nearby, mostly normal galaxies was imaged in F160W snapshots with the NIC-3 camera by Sparks, randomly selected from the RSA according to HST scheduling convenience. An atlas of these images has been published by Böker et al. (1999). Normal Sa to Sbc galaxies were observed by Stiavelli with NIC-2. This sample was selected from the UGC (Nilson, 1973) and the ESOLV (Lauberts & Valentijn, 1989) catalogs, and excluded galaxies with km s-1, inclinations , and systems with known bars. Additional spirals imaged with NIC-2 by Peletier were selected from a -magnitude limited sample (Balcells & Peletier, 1994), with inclinations , and of early Hubble type (S0-Sbc).
2.2 Image Processing
We re-reduced all images using the STSDAS/calnica111STSDAS is the Space Telescope Science Data Analysis System. routine using the “best available” calibration frames for bias subtraction, dark subtraction, flatfielding and bad pixel identification, rather than the frames that were originally used. The images were then corrected, quadrant-by-quadrant, for the unpredictable drifts in the bias level which produces the well-known “pedestal”–a positive or negative ghost of the flatfield which remains in the reduced image. The four bias level corrections (one for each quadrant) that must be made are determined by an iterative process in the pedestal removal algorithm of van der Marel (see http://www.stsci.edu/$_{~{ }}$marel/software/pedestal.html).
Excepting program 7919, the observations were made with two, three, or four equal exposures shifted in a small dither pattern (an “L” shape for the triple exposures, and a square for the quadruple exposures). We determined the exact shifts with the IRAF222IRAF is the Image Analysis and Reduction Facility made available to the astronomical community by the National Optical Astronomy Observatory, which is operated by AURA, Inc., under contract with the U.S. National Science Foundation. task xregister, and then summed the dithered images using the imshift and combine tasks in IRAF. Bad pixel masks were generated from the Data Quality flags, and augmented by hand when necessary after visual inspection of the final combined image. Representative galaxy images are shown in Figures 2, 3, 4, 5, and 6 (see 3).
2.3 Photometric Calibration
A key advantage of infrared imaging over almost all optical imaging obtained with HST is the large dynamic range over which flux measurements remain linear. Particularly for Seyfert 1s with bright nuclei, even in relatively short exposures most WFPC2 images suffer saturation which cannot be corrected. Photometry from the 500-second exposures in Malkan, Gorjian, & Tam (1998) (hereafter MGT) is suspect for point sources brighter than V=19 (see http://www.astro.ucla.edu/$_{~{ }}$malkan/mgt.txt).
Fortunately, all of our NICMOS images have linear flux scales even into the centers of bright Sy1 nuclei. This allows us to obtain accurate photometry, perform image deconvolution, and model fitting to the central brightness distributions, none of which are practical for most WFPC2 images. We used the F160W zeropoints of 21.667, 21.826, and 21.566 respectively, for the NICMOS Cameras 1, 2 and 3, which puts our magnitudes on the H (Vega) scale (see http://www.stsci.edu/hst/nicmos/performance/photometry/keywords.html).
We made a detailed comparison shown in Figure 1 of the F160W photometric scale using our own ground-based H-band images of 8 of the sample galaxies (Hunt et al., 1999b). The growth curves of magnitude versus aperture diameter agree to within 5% based on the transformations for NIC-2. This good agreement was obtained assuming a zero sky level, hence this assumption was maintained for all cameras. In general, the comparison of our NICMOS photometry to our ground-based measurements shows little evidence for any time-variability of the nucleus at 1.6m, roughly consistent with the findings of Quillen et al. (2001). The NIC-1 H magnitudes are about 0.1 fainter at all radii, but we have not corrected the data for this systematic offset, since we are interested in morphology rather than absolute calibration.
3 The Matched Samples
Given the variety of selection preferences that led to the observation of these 250 objects, they cannot be considered fair samples of local active or normal galaxies. We therefore have carefully selected the five activity-type subsamples so as to mitigate potential biases.
The galaxies were classified according to their optical spectra, following NED, as normal (non-active galaxies), HII-region/starbursts (HII), LINERs, Seyfert 2s (Sy2s), or Seyfert 1s (Sy1s). The physical foundation of some of these categories is not absolutely clear. For example, galaxies having “low ionization” line emission (“LINERs”) may be a heterogeneous class which includes some galaxies with recent star formation and possible associated wind outflows with shocked gas, as well as some genuine low-power active galaxies, with relatively weak central nonstellar engines. If a galaxy was classified as having both an AGN and HII-region-like spectra, we placed it in the more “active” category (LINER or Seyfert).
A small fraction of the images from the comprehensive target set was discarded a priori because of bad pointing, which shifted the center of the galaxy partly or entirely off the detector. About two dozen galaxy images were rejected from further analysis because they are too irregular or do not contain any clear nucleus.
3.1 Parameter Control and Sample Construction
The next step in the sample construction process was to constrain several physical parameters. Galaxies are complex objects which span very wide ranges in virtually every observable, and our aim is the mitigation of selection biases which could distort the results by producing spurious “differences” among samples. Nevertheless, there are intrinsic differences between galaxies which host Seyfert nuclei and their normal non-active counterparts. Seyfert galaxies tend to be of early Hubble type (Moles, Marquez, & Perez, 1995), and more luminous (Huchra & Burg, 1992). Optically selected Seyferts also tend to avoid edge-on systems (Keel, 1980), although infrared-selected Seyferts are less affected by this bias (Hunt & Malkan, 1999). Our approach here is to maximize the size of the sample to optimize statistical significance, while at the same time, minimize the sample differences which could result in biases. The distributions of a given parameter in each activity sample were examined, and the extrema eliminated. Sample medians and ranges were then recomputed, and this process was repeated until extrema and medians are similar for all activity classes.
This approach provides several advantages over previous studies. First, instead of creating paired samples (e.g., Martini et al. 2003b), we retain as many galaxies as possible since we require statistical similarity of the samples rather than individual matching among galaxies. Second, rather than modifying binning intervals to match distributions (e.g., Laine et al. 2002), we constrain the ranges and medians of the samples, so their statistical properties should be more robust. Third, the resulting Seyfert samples maintain the principal characteristics of Seyfert galaxies, namely slightly higher luminosity and earlier Hubble type than normal galaxies. We however ensure that these differences are as small as possible, and analyze subsamples where necessary to verify that they are not the cause of any differences (e.g., 5.1, 5.4, 5.5).
Our highest priority is to study samples of galaxies with various categories of nuclear activity with equivalent physical spatial resolution, as measured by parsecs per pixel. This consideration is especially important given our use of all three NICMOS cameras which differ by more than a factor of four in pixel size. Because of the HST diffraction limit at 1.6m of 0.17″, it is also necessary to constrain distance. Blue luminosity constraints were applied in order to eliminate possible Malmquist biases and trends of structure with luminosity, independently of activity type. Hubble type is also checked so as to ensure that potential differences are not simply a function of galaxy morphology. Finally, we checked large-scale galaxy inclination, so as to exclude highly-inclined systems in which circumnuclear morphology may not be easy to measure. Bar class as given in RC3 was also checked, but not constrained.
We started with 250 galaxies, and ended by eliminating 85 of them, so that the final sample consists of 165 galaxies, 47 of which are non-active; this set of samples will be designated hereafter as MS (Matched Samples). From this, we also constructed two additional sets. In the first, distance is further constrained to be 80 Mpc (denoted as DMS, Distance-Matched Samples), and in the second, we require inclination to be 70∘ (denoted as IMS, Inclination-Matched Samples). Details of the sample matching are given in the Appendix, together with a list of the 85 galaxies eliminated. The medians and ranges of the parameters for each of the matched sample sets is reported in Table 1. For each activity class, the first line reports medians and standard deviations, and the second line the range. Col. 8. is an exception to this where only percentages of bar class are given. The values in parentheses are quartiles, not standard deviations. The final samples of galaxies separated by activity type are listed in Table 2, with NED designations, redshifts, RC3 classifications, and optical major and minor axes and magnitudes.
| Activity | NumberaaNo superscript on the number corresponds to “matched samples” (MS), ∗ to the set with distance 80 Mpc (DMS), and † to the set with inclination 70∘ (IMS). | Distance | Resolution | Absolute | RC3 Type | % SB | |
|---|---|---|---|---|---|---|---|
| Class | [Mpc] | [Pc/pixel] | Magnitude | % SAB | |||
| (1) | (2) | (3) | (4) | (5) | (6) | (7) | (8) |
| Normal | 47 | 27.8 (4.8) | 10.4 (2.6) | (1.0) | 3.0 (3.0) | 0.45 (0.25) | 32% |
| 11.467.4 | 5.224.5 | 0.130.90 | 32% | ||||
| 47∗ | 27.8 (4.8) | 10.4 (2.6) | (1.0) | 3.0 (3.0) | 0.45 (0.25) | ||
| 11.467.4 | 5.224.5 | 0.130.90 | |||||
| 32† | 25.0 (5.2) | 10.1 (1.8) | (0.6) | 3.0 (1.5) | 0.59 (0.18) | ||
| 11.438.6 | 5.215.6 | 0.350.90 | |||||
| HII/starburst | 14 | 27.0 (12.2) | 12.6 (3.2) | (0.5) | 4.0 (1.5) | 0.66 (0.19) | 42% |
| 10.975.3 | 4.015.7 | 0.370.93 | 42% | ||||
| 14∗ | 27.0 (12.2) | 12.6 (3.2) | (0.5) | 4.0 (1.5) | 0.66 (0.19) | ||
| 10.975.3 | 4.015.7 | 0.370.93 | |||||
| 14† | 27.0 (12.2) | 12.6 (3.2) | (0.5) | 4.0 (1.5) | 0.66 (0.19) | ||
| 10.975.3 | 4.015.7 | 0.370.93 | |||||
| LINER | 22 | 18.5 (5.0) | 7.5 (2.7) | (0.7) | 2.0 (1.5) | 0.64 (0.18) | 10% |
| 10.655.1 | 3.920.0 | 0.311.00 | 38% | ||||
| 22∗ | 18.5 (5.0) | 7.5 (2.7) | (0.7) | 2.0 (1.5) | 0.64 (0.18) | ||
| 10.655.1 | 3.920.0 | 0.311.00 | |||||
| 20† | 18.5 (4.7) | 7.5 (3.8) | (0.6) | 2.0 (1.5) | 0.65 (0.18) | ||
| 10.655.1 | 3.920.0 | 0.361.00 | |||||
| Sy 2 | 55 | 37.4 (17.9) | 12.9 (5.1) | (0.7) | 2.0 (2.0) | 0.73 (0.17) | 37% |
| 11.8117.4 | 4.925.9 | 0.181.00 | 37% | ||||
| 51∗ | 36.0 (14.8) | 12.5 (4.5) | (0.7) | 2.0 (2.0) | 0.73 (0.16) | ||
| 11.871.3 | 4.925.9 | 0.181.00 | |||||
| 51† | 38.3 (19.9) | 13.2 (5.2) | (0.7) | 2.0 (3.0) | 0.74 (0.15) | ||
| 11.8117.4 | 4.925.9 | 0.371.00 | |||||
| Sy 1 | 27 | 48.5 (38.2) | 15.2 (6.1) | (0.5) | 3.0 (3.0) | 0.67 (0.22) | 32% |
| 11.4119.4 | 3.324.9 | 0.121.00 | 26% | ||||
| 18∗ | 37.5 (14.9) | 13.2 (4.0) | (0.8) | 1.0 (2.5) | 0.60 (0.20) | ||
| 11.479.2 | 3.321.1 | 0.120.93 | |||||
| 23† | 54.5 (38.9) | 16.5 (6.8) | (0.5) | 3.0 (3.0) | 0.74 (0.16) | ||
| 11.4119.4 | 3.324.9 | 0.361.00 |
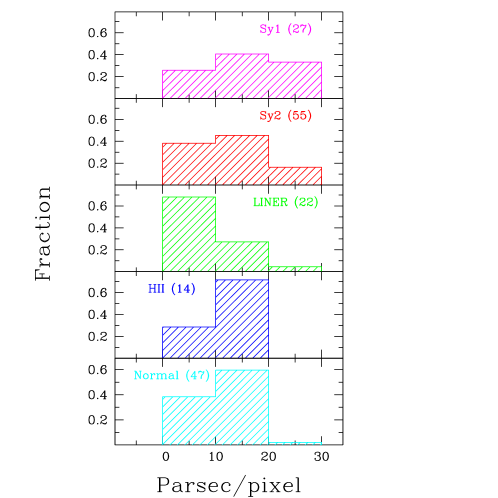
The most important parameter of relative spatial resolution, parsec-to-pixel scale, is very similar for each of the final matched samples. As seen in Table 1, the median resolutions are 10.4, 12.6, 7.5, 12.9, 15.2 pc/pixel for the normal, HII, LINER, Sy2, and Sy1 galaxies, respectively. The worst discrepancy is a factor of two between LINERs and Sy1s, but as will be seen, this discrepancy only strengthens our results.
Distance is also another obviously important parameter, because of the inability to resolve features in far-away objects. In the MS, the median distance of the Sy1s is 2.6 times larger than the LINERs (the closest sample), and 30% larger than the Sy2s. This effect is mitigated in the DMS, as the Sy1s are (in the median) only twice as far as the LINERs, and at the same distance as the Sy2s (see Table 1).
| Nameaa ∗ Eliminated in the DMS because distance 80 Mpc. † Eliminated in the IMS because inclination 70∘. | Dist. | RC3 Type | a | b | Mag. | Abs. Mag. | Pc/pixel | Bar | Twist | 3 | cos(4) | USM | |
|---|---|---|---|---|---|---|---|---|---|---|---|---|---|
| (1) | (2) | (3) | (4) | (5) | (6) | (7) | (8) | (9) | (10) | (11) | (12) | (13) | (14) |
| Non-active | |||||||||||||
| NGC0289 | 0.005 | 18.5 | SAB(rs)bc | 5.1 | 3.6 | 11.7 | 6.7 | Y? | Y? | ||||
| NGC0488 | 0.008 | 27.5 | SA(r)b | 5.2 | 3.9 | 11.2 | 10.0 | ||||||
| NGC0772 | 0.008 | 30.8 | SA(s)b | 7.2 | 4.3 | 11.1 | 11.2 | ||||||
| NGC2196 | 0.008 | 31.7 | (R’:)SA(rs)ab | 2.8 | 2.2 | 11.8 | 11.5 | ||||||
| NGC2339 | 0.007 | 31.6 | SAB(rs)bc | 2.7 | 2.0 | 12.5 | 11.5 | Y? | D? | ||||
| NGC2460 | 0.005 | 21.5 | SA(s)a | 2.5 | 1.9 | 12.7 | 7.8 | Y? | |||||
| NGC2566 | 0.005 | 24.2 | (R’)SB(r)ab | 4.0 | 2.9 | 11.8 | 8.8 | Y? | Y? | ||||
| NGC2748 | 0.005 | 21.9 | SAbc | 3.0 | 1.1 | 12.4 | 8.0 | B? | |||||
| ESO498-G005 | 0.008 | 35.9 | SAB(s)c | 1.3 | 1.1 | 14.0 | 13.1 | ||||||
| NGC3067 | 0.005 | 23.8 | SAB(s)ab? | 2.5 | 0.9 | 12.8 | 8.7 | Y? | D? | ||||
| NGC3115 | 0.002 | 13.4 | S0- | 7.2 | 2.5 | 9.9 | 13.0 | D | |||||
| NGC3259 | 0.006 | 25.7 | SAB(rs)bc: | 2.2 | 1.2 | 12.9 | 9.3 | Y? | Y? | D? | |||
| NGC3277 | 0.005 | 23.3 | SA(r)ab | 1.9 | 1.7 | 12.5 | 8.5 | ||||||
| NGC3455 | 0.004 | 19.3 | (R’)SAB(rs)b | 2.5 | 1.5 | 12.8 | 7.0 | D? | |||||
| NGC3900 | 0.006 | 29.1 | SA(r)0+ | 3.2 | 1.7 | 12.2 | 10.6 | ||||||
| NGC3949 | 0.003 | 14.7 | SA(s)bc: | 2.9 | 1.7 | 11.5 | 5.3 | Y | |||||
| NGC4026† | 0.003 | 16.2 | S0 | 5.2 | 1.3 | 11.7 | 15.7 | D | |||||
| NGC4219† | 0.007 | 30.2 | SA(s)bc | 4.3 | 1.3 | 12.7 | 11.0 | Y? | |||||
| NGC4417 | 0.003 | 16.1 | SB0:sp | 3.4 | 1.3 | 12.0 | 15.6 | BD | |||||
| NGC4806 | 0.008 | 37.1 | SB(s)c? | 1.2 | 1.0 | 13.4 | 13.5 | Y? | |||||
| ESO443-G080 | 0.007 | 32.7 | SB(s)m | 1.4 | 0.9 | 14.1 | 11.9 | ||||||
| NGC5326 | 0.008 | 38.6 | SAa: | 2.2 | 1.1 | 12.9 | 14.0 | ||||||
| NGC5389† | 0.006 | 28.3 | SAB(r)0/a:? | 3.5 | 1.0 | 12.9 | 10.3 | Y? | B? | ||||
| NGC5377 | 0.006 | 28.2 | (R)SB(s)a | 3.7 | 2.1 | 12.2 | 10.3 | Y? | |||||
| NGC5422† | 0.006 | 27.7 | S0 | 3.9 | 0.7 | 12.8 | 10.1 | B?D? | |||||
| NGC5443 | 0.006 | 27.9 | SB(s)b? | 2.7 | 1.0 | 13.1 | 10.1 | Y? | D? | ||||
| NGC5448 | 0.007 | 31.3 | (R)SAB(r)a | 4.0 | 1.8 | 11.9 | 11.4 | Y? | |||||
| NGC5475† | 0.005 | 25.7 | Sa?sp | 2.0 | 0.5 | 13.5 | 9.3 | B? | |||||
| IC4390† | 0.007 | 31.3 | SA(s)b | 1.8 | 0.6 | 13.8 | 11.4 | Y? | Y | ||||
| NGC5587† | 0.008 | 35.9 | S0/a | 2.6 | 0.8 | 13.5 | 13.1 | B?D? | |||||
| NGC5689† | 0.007 | 33.0 | SB(s)0/a: | 3.5 | 1.0 | 12.8 | 12.0 | Y? | Y? | D? | |||
| NGC5707† | 0.007 | 33.6 | Sab:sp | 2.6 | 0.4 | 13.3 | 12.2 | Y? | B?D? | ||||
| NGC5719 | 0.006 | 27.8 | SAB(s)abpec | 3.2 | 1.2 | 13.3 | 10.1 | ||||||
| NGC5746† | 0.006 | 27.5 | SAB(rs)b?sp | 7.4 | 1.3 | 11.3 | 10.0 | Y? | D? | ||||
| NGC5806 | 0.005 | 22.3 | SAB(s)b | 3.1 | 1.6 | 12.4 | 8.1 | Y? | |||||
| NGC5854† | 0.006 | 27.5 | SB(s)0+ | 2.8 | 0.8 | 12.7 | 10.0 | B | |||||
| NGC5965† | 0.011 | 49.7 | Sb | 6.2 | 0.8 | 12.6 | 18.1 | Y? | B?D? | ||||
| NGC6010† | 0.006 | 28.9 | S0/a:sp | 1.9 | 0.5 | 13.6 | 10.5 | D? | |||||
| NGC6504† | 0.016 | 67.4 | S | 2.2 | 0.5 | 13.5 | 24.5 | Y? | |||||
| NGC6684 | 0.003 | 11.4 | (L)SB(r)0+ | 4.0 | 2.6 | 11.3 | 11.1 | Y | D | ||||
| ESO404-G003 | 0.008 | 29.8 | SB(r)bc | 1.5 | 0.7 | 13.9 | 10.8 | ||||||
| NGC7162 | 0.008 | 28.7 | (R’)SA(r)bc | 2.8 | 1.0 | 13.3 | 10.4 | Y? | |||||
| NGC7280 | 0.006 | 22.3 | SAB(r)0+ | 2.2 | 1.5 | 13.0 | 8.1 | Y? | D? | ||||
| NGC7421 | 0.006 | 21.8 | SB(r)bc | 2.0 | 1.8 | 13.0 | 7.9 | Y? | D? | ||||
| IC5271 | 0.006 | 20.4 | Sb? | 2.6 | 0.9 | 12.9 | 7.4 | Y? | |||||
| IC5273 | 0.004 | 14.4 | SB(rs)cd | 2.7 | 1.8 | 12.2 | 5.2 | ||||||
| NGC7537† | 0.009 | 33.1 | SAbc: | 2.2 | 0.6 | 13.9 | 12.0 | D? | |||||
| HII | |||||||||||||
| UGC01385 | 0.019 | 75.3 | (R)SB0/a | 0.7 | 0.6 | 13.9 | 15.7 | ||||||
| NGC0986 | 0.007 | 24.5 | (R’1)SB(rs)b | 3.9 | 3.0 | 12.0 | 8.9 | ||||||
| NGC0972 | 0.005 | 18.6 | Sab | 3.3 | 1.7 | 12.3 | 6.8 | Y? | Y? | ||||
| NGC2903 | 0.002 | 10.9 | SB(s)d | 12.6 | 6.0 | 9.7 | 4.0 | ||||||
| NGC2964 | 0.004 | 21.6 | SAB(r)bc | 2.9 | 1.6 | 12.0 | 7.9 | Y? | Y? | ||||
| NGC3184 | 0.002 | 11.5 | SAB(rs)cd | 7.4 | 6.9 | 10.4 | 11.2 | Y | |||||
| NGC4062 | 0.003 | 14.7 | SA(s)c | 4.1 | 1.7 | 11.9 | 14.3 | Y | |||||
| NGC4384 | 0.008 | 38.1 | Sa | 1.3 | 1.0 | 13.5 | 13.9 | Y? | B? | ||||
| NGC4536 | 0.006 | 29.5 | SAB(rs)bc | 7.6 | 3.2 | 11.2 | 10.7 | Y? | Y | ||||
| NGC5188 | 0.008 | 36.6 | (R’:)SAB(rs)b | 3.0 | 1.1 | 13.0 | 13.3 | Y? | Y? | D? | |||
| NGC5597 | 0.009 | 40.6 | SAB(s)cd | 2.1 | 1.7 | 12.6 | 14.8 | Y? | B | ||||
| NGC5757 | 0.009 | 39.6 | (R’)SB(r)b | 2.0 | 1.6 | 13.5 | 14.4 | ||||||
| NGC6000 | 0.007 | 32.5 | SB(s)bc: | 1.9 | 1.6 | 13.0 | 11.8 | ||||||
| NGC6207 | 0.003 | 13.8 | SA(s)c | 3.0 | 1.3 | 12.2 | 13.4 | Y | |||||
| LINER | |||||||||||||
| NGC1961 | 0.013 | 55.1 | SAB(rs)c | 4.6 | 3.0 | 11.7 | 20.0 | Y | D | ||||
| NGC2985 | 0.004 | 20.1 | (R’)SA(rs)ab | 4.6 | 3.6 | 11.2 | 7.3 | ||||||
| NGC3169 | 0.004 | 20.8 | SA(s)apec | 4.4 | 2.8 | 11.1 | 7.6 | ||||||
| MESSIER105 | 0.003 | 16.6 | E1 | 5.4 | 4.8 | 10.2 | 16.1 | ||||||
| NGC3675 | 0.003 | 14.3 | SA(s)b | 5.9 | 3.1 | 11.0 | 13.9 | Y? | |||||
| NGC3898 | 0.004 | 19.4 | SA(s)ab | 4.4 | 2.6 | 11.6 | 7.1 | ||||||
| NGC4102 | 0.003 | 14.9 | SAB(s)b? | 3.0 | 1.7 | 12.0 | 5.4 | ||||||
| NGC4143 | 0.003 | 17.4 | SAB(s)00 | 2.3 | 1.4 | 11.7 | 6.3 | Y? | |||||
| NGC4293 | 0.003 | 16.7 | (R)SB(s)0/a | 5.6 | 2.6 | 11.3 | 16.2 | Y? | Y | B | |||
| NGC4314 | 0.003 | 17.5 | SB(rs)a | 4.2 | 3.7 | 11.4 | 6.4 | Y | D | ||||
| NGC4527† | 0.006 | 28.5 | SAB(s)bc/ | 6.2 | 2.1 | 11.4 | 10.4 | Y | Y | ||||
| NGC4750 | 0.005 | 24.6 | (R)SA(rs)ab | 2.0 | 1.9 | 12.1 | 8.9 | Y? | Y? | D? | |||
| NGC5064 | 0.010 | 43.6 | (R’:)SA(s)ab | 2.5 | 1.1 | 12.9 | 15.9 | Y | |||||
| NGC5678 | 0.006 | 29.3 | SAB(rs)b | 3.3 | 1.6 | 12.1 | 10.7 | Y? | B?D? | ||||
| NGC5838 | 0.005 | 22.3 | SA0- | 4.2 | 1.5 | 11.9 | 8.1 | Y? | D? | ||||
| NGC5879† | 0.003 | 13.2 | SA(rs)bc:? | 4.2 | 1.3 | 12.2 | 4.8 | B? | |||||
| NGC6340 | 0.004 | 17.8 | SA(s)0/a | 3.2 | 3.0 | 11.9 | 6.5 | ||||||
| NGC6384 | 0.006 | 24.2 | SAB(r)bc | 6.2 | 4.1 | 11.1 | 8.8 | Y? | |||||
| NGC6744 | 0.003 | 10.6 | SAB(r)bc | 20.0 | 12.9 | 9.1 | 3.9 | ||||||
| NGC7177 | 0.004 | 12.9 | SAB(r)b | 3.1 | 2.0 | 12.0 | 4.7 | Y | Y? | D? | |||
| NGC7217 | 0.003 | 10.6 | (R)SA(r)ab | 3.9 | 3.2 | 11.0 | 3.9 | ||||||
| NGC7742 | 0.006 | 19.1 | SA(r)b | 1.7 | 1.7 | 12.3 | 6.9 | Y? | |||||
| Seyfert 2 | |||||||||||||
| NGC0449 | 0.016 | 63.3 | (R’)S? | 0.8 | 0.5 | 15.0 | 13.2 | Y? | Y | D | |||
| UGC01214 | 0.017 | 67.8 | (R)SAB(rs)0+: | 1.3 | 1.3 | 13.7 | 24.7 | Y | Y | ||||
| NGC0788 | 0.014 | 52.6 | SA(s)0/a: | 1.9 | 1.4 | 13.0 | 19.1 | Y | |||||
| UGC02456 | 0.012 | 47.8 | (R)SB(s)0+ | 1.7 | 1.0 | 13.6 | 17.4 | Y? | Y | Y | |||
| NGC1241 | 0.014 | 52.9 | SB(rs)b | 2.8 | 1.7 | 12.0 | 19.2 | Y | B | ||||
| NGC1275 | 0.018 | 71.3 | cDpecNLRG | 2.2 | 1.7 | 12.6 | 25.9 | Y | B? | ||||
| NGC1320† | 0.009 | 34.6 | Sa:sp | 1.9 | 0.6 | 13.3 | 12.6 | D | |||||
| NGC1398 | 0.005 | 16.6 | (R1R’2)SB(rs)ab | 7.1 | 5.4 | 10.6 | 6.0 | Y? | |||||
| NGC1672 | 0.005 | 17.1 | (R’1:)SB(r)bc | 6.6 | 5.5 | 10.3 | 6.2 | Y | |||||
| NGC1667 | 0.015 | 61.3 | SAB(r)c | 1.8 | 1.4 | 12.8 | 22.3 | Y | |||||
| ESO362-G008 | 0.016 | 64.8 | Sa | 1.2 | 0.6 | 13.6 | 13.5 | Y? | B | ||||
| UGC04203 | 0.013 | 58.0 | Sa | 0.8 | 0.8 | 14.3 | 21.1 | Y | Y? | ||||
| NGC2681 | 0.002 | 11.8 | (R’)SAB(rs)0/a | 3.6 | 3.3 | 11.1 | 11.4 | Y? | Y | D? | |||
| NGC2685 | 0.003 | 14.3 | (R)SB0+pec | 4.5 | 2.3 | 12.1 | 13.9 | D | |||||
| NGC3081 | 0.008 | 36.0 | (R1)SAB(r)0/a | 2.1 | 1.6 | 12.8 | 13.1 | Y | Y | ||||
| NGC3079† | 0.004 | 18.2 | SB(s)c | 7.9 | 1.4 | 11.5 | 6.6 | Y | |||||
| IC2560 | 0.010 | 43.2 | (R’:)SB(r)bc | 3.2 | 2.0 | 12.5 | 15.7 | B | |||||
| MESSIER096 | 0.003 | 16.4 | SAB(rs)ab | 7.6 | 5.2 | 10.1 | 6.0 | Y | |||||
| NGC3486 | 0.002 | 13.4 | SAB(r)c | 7.1 | 5.2 | 11.1 | 4.9 | ||||||
| NGC3593 | 0.002 | 12.9 | SA(s)0/a | 5.2 | 1.9 | 11.9 | 12.5 | Y | |||||
| MESSIER066 | 0.002 | 14.3 | SAB(s)b | 9.1 | 4.2 | 9.7 | 5.2 | ||||||
| NGC3982 | 0.004 | 18.5 | SAB(r)b: | 2.3 | 2.0 | 11.8 | 6.7 | Y | |||||
| NGC4388† | 0.008 | 39.4 | SA(s)b:sp | 5.6 | 1.3 | 11.8 | 8.2 | Y | |||||
| MESSIER090 | -0.001 | 16.8 | SAB(rs)ab | 9.5 | 4.4 | 10.3 | 6.1 | Y? | |||||
| NGC4785 | 0.012 | 54.1 | (R’)SAB(r)ab | 1.9 | 1.0 | 13.2 | 19.7 | Y? | |||||
| NGC4941 | 0.004 | 19.6 | (R)SAB(r)ab: | 3.6 | 1.9 | 12.4 | 7.1 | Y | Y | ||||
| NGC4939 | 0.010 | 47.3 | SA(s)bc | 5.5 | 2.8 | 11.9 | 17.2 | B | |||||
| NGC4968 | 0.010 | 44.6 | (R’)SAB00 | 1.9 | 0.9 | 13.9 | 16.2 | Y | B | ||||
| NGC5005 | 0.003 | 17.0 | SAB(rs)bc | 5.8 | 2.8 | 10.6 | 6.2 | Y? | |||||
| NGC5135 | 0.014 | 60.3 | SB(l)ab | 2.6 | 1.8 | 12.9 | 21.9 | ||||||
| NGC5256∗ | 0.027 | 117.4 | Compactpec | 0.4 | 0.3 | 14.1 | 24.5 | Y? | Y | Y | |||
| NGC5283 | 0.010 | 45.6 | S0? | 1.1 | 1.0 | 14.2 | 9.5 | Y? | Y | D? | |||
| UGC08718 | 0.016 | 71.3 | S | 0.7 | 0.5 | 14.6 | 14.9 | Y | B | ||||
| NGC5347 | 0.008 | 36.2 | (R’)SB(rs)ab | 1.7 | 1.3 | 13.4 | 13.2 | Y | Y | ||||
| NGC5427 | 0.009 | 40.2 | SA(s)cpec | 2.8 | 2.4 | 11.9 | 14.6 | Y | D? | ||||
| NGC5643 | 0.004 | 18.7 | SAB(rs)c | 4.6 | 4.0 | 10.7 | 6.8 | Y | |||||
| NGC5695 | 0.014 | 62.1 | SBb | 1.5 | 1.1 | 13.6 | 12.9 | Y | |||||
| NGC5929 | 0.008 | 37.4 | Sab:pec | 1.0 | 0.9 | 14.1 | 7.8 | Y | D | ||||
| NGC5953 | 0.007 | 30.4 | SAa:pec | 1.6 | 1.3 | 13.3 | 11.1 | Y | |||||
| NGC6217 | 0.005 | 20.1 | (R)SB(rs)bc | 3.0 | 2.5 | 11.8 | 7.3 | Y? | Y? | ||||
| ESO137-G034 | 0.009 | 38.5 | SAB(s)0/a? | 1.4 | 1.1 | 12.2 | 14.0 | Y | |||||
| ESO138-G001 | 0.009 | 38.3 | E-S0 | 1.0 | 0.5 | 14.3 | 13.9 | Y? | Y | ||||
| NGC6300 | 0.004 | 15.3 | SB(rs)b | 4.5 | 3.0 | 11.0 | 5.6 | ||||||
| FAIRALL0049†∗ | 0.020 | 83.5 | Sa | 0.0 | 0.0 | 13.2 | 17.4 | D | |||||
| NGC6810† | 0.007 | 26.8 | SA(s)ab:sp | 3.2 | 0.9 | 12.4 | 9.7 | Y? | Y? | D? | |||
| NGC6890 | 0.008 | 31.6 | (R’)SA(r:)ab | 1.5 | 1.2 | 13.0 | 11.5 | Y | Y | ||||
| NGC6951 | 0.005 | 19.6 | SAB(rs)bc | 3.9 | 3.2 | 11.6 | 7.1 | Y | |||||
| IC5063 | 0.011 | 45.2 | SA(s)0+: | 2.1 | 1.4 | 12.9 | 16.4 | Y | |||||
| NGC7130 | 0.016 | 64.1 | Sapec | 1.5 | 1.4 | 13.0 | 23.3 | Y | Y | ||||
| ESO075-G041∗ | 0.028 | 115.8 | SA0-Radiogal | 1.6 | 0.8 | 14.3 | 24.1 | ||||||
| NGC7479 | 0.008 | 29.3 | SB(s)c | 4.1 | 3.1 | 11.6 | 10.7 | Y? | |||||
| NGC7496 | 0.006 | 19.4 | (R’:)SB(rs)bc | 3.3 | 3.0 | 11.9 | 7.1 | Y? | Y | B | |||
| NGC7582 | 0.005 | 18.3 | (R’1)SB(s)ab | 5.0 | 2.1 | 11.4 | 6.7 | ||||||
| NGC7674∗ | 0.029 | 116.4 | SA(r)bcpec | 1.1 | 1.0 | 13.9 | 24.3 | Y? | D | ||||
| NGC7743 | 0.006 | 19.7 | (R)SB(s)0+ | 3.0 | 2.6 | 12.4 | 7.2 | Y | |||||
| Seyfert 1 | |||||||||||||
| UGC00006∗ | 0.022 | 87.7 | Pec | 1.0 | 0.7 | 14.4 | 18.3 | Y | |||||
| UGC01395 | 0.017 | 68.4 | SA(rs)b | 1.3 | 1.0 | 14.2 | 14.3 | ||||||
| NGC1019∗ | 0.024 | 97.1 | SB(rs)bc | 1.0 | 0.9 | 14.3 | 20.2 | ||||||
| NGC1365 | 0.005 | 19.8 | (R’)SBb(s)b | 11.2 | 6.2 | 10.3 | 7.2 | ||||||
| IC0450 | 0.019 | 79.2 | SAB0+: | 0.8 | 0.5 | 15.0 | 16.5 | ||||||
| NGC2639 | 0.011 | 48.5 | (R)SA(r)a:? | 1.8 | 1.1 | 12.6 | 17.6 | ||||||
| NGC2841 | 0.002 | 11.4 | SA(r)b: | 8.1 | 3.5 | 10.1 | 4.1 | B? | |||||
| UGC05849∗ | 0.026 | 112.3 | Sc/d | 0.9 | 0.6 | 14.7 | 23.4 | Y | Y | ||||
| NGC3516 | 0.009 | 38.8 | (R)SB(s)00: | 1.7 | 1.3 | 12.5 | 14.1 | Y | D | ||||
| NGC3786 | 0.009 | 41.2 | SAB(rs)apec | 2.2 | 1.3 | 13.5 | 8.6 | Y | |||||
| NGC4235† | 0.008 | 37.8 | SA(s)a | 4.2 | 0.9 | 12.6 | 13.7 | BD | |||||
| NGC4253 | 0.013 | 58.0 | (R’)SB(s)a: | 1.0 | 0.8 | 13.7 | 21.1 | D | |||||
| NGC4278 | 0.002 | 13.2 | E1-2 | 4.1 | 3.8 | 11.2 | 12.8 | ||||||
| NGC4565† | 0.004 | 22.0 | SA(s)b?sp3 | 15.9 | 1.9 | 10.4 | 8.0 | ||||||
| NGC4593 | 0.009 | 41.7 | (R)SB(rs)b | 3.9 | 2.9 | 11.7 | 15.2 | ||||||
| NGC5033 | 0.003 | 16.0 | SA(s)c | 10.7 | 5.0 | 10.8 | 3.3 | Y | Y | B | |||
| NGC5252∗ | 0.023 | 100.2 | S0 | 1.4 | 0.9 | 14.0 | 20.9 | D? | |||||
| NGC5273 | 0.004 | 18.8 | SA(s)00 | 2.8 | 2.5 | 12.4 | 3.9 | Y | |||||
| NGC5506† | 0.006 | 29.6 | Sapecsp | 2.8 | 0.9 | 13.4 | 10.8 | B | |||||
| NGC5674∗ | 0.025 | 107.5 | SABc | 1.1 | 1.0 | 13.7 | 22.4 | Y? | Y | D | |||
| NGC5985 | 0.008 | 37.1 | SAB(r)b | 5.5 | 3.0 | 11.9 | 13.5 | Y? | D? | ||||
| NGC6104∗ | 0.028 | 119.4 | S(R)pec/Pec | 0.8 | 0.7 | 14.2 | 24.9 | Y | |||||
| ESO103-G035 | 0.013 | 54.5 | SA00 | 1.1 | 0.4 | 14.7 | 19.8 | ||||||
| NGC6814 | 0.005 | 20.2 | SAB(rs)bc | 3.0 | 2.8 | 12.1 | 7.3 | Y? | D? | ||||
| MRK0516∗ | 0.028 | 115.0 | Sc | 0.5 | 0.5 | 15.3 | 24.0 | Y | D | ||||
| MRK0915†∗ | 0.024 | 96.5 | Sb | 1.0 | 0.3 | 14.8 | 20.1 | B | |||||
| UGC12138∗ | 0.025 | 100.3 | SBa | 0.8 | 0.7 | 14.2 | 20.9 | D | |||||
The images (2.2), surface brightness profiles with ellipse parameters (4.1), and unsharp-masked images (4.2) are shown in Figures 2, 3, 4, 5, and 6, for the normal, HII, LINER, Sy2, and Sy1 samples, respectively. Only a representative page of each activity sample is shown; the remainder are available electronically (www.arcetri.astro.it/$_{~{ }}$hunt/nicmos.html).
4 The Analysis
We have studied the circumnuclear morphology of these galaxies with several methods. First, elliptically-averaged profiles were generated. Then, the elliptical surface brightness distribution was subtracted from and divided by the original image to create unsharp masks (USMs); with these, we are better able to examine residual asymmetric structures not well fitted with ellipses. Finally, objective quantitative procedures were applied to identify all morphological peculiarities discussed here, with subsequent visual inspection to verify the objective diagnostic. The morphological peculiarities we examined are outlined below, together with their operational definition and what kinds of physical processes they probe.
4.1 Elliptical Isophote Fitting
We fitted an axisymmetric Gaussian to the nuclear region of each galaxy to determine the centers. Then, we used the IRAF/STSDAS task isophote/ellipse333STSDAS is distributed by the Space Telescope Science Institute, which is operated by the Association of Universities for Research in Astronomy (AURA), Inc., under NASA contract NAS 5–26555. to fit the major and minor axes, position angle and brightness level of a series of elliptical isophotes, logarithmically spaced in galactocentric distance. Coefficients to the cos 3 and cos 4 residual terms were also determined (Jedrzejewski, 1987). Except for the ellipse center, which was kept fixed, all the coefficients were allowed to vary over the full radial range. We also generated a set of profiles with linear spacing. Both types of profiles were analyzed as described in 4.4.
The elliptically-averaged surface-brightness profiles together with the higher-order residuals are plotted as a function of radius in the central panels of Figures 2–6. Only the logarithmically spaced profiles are shown in the Figures. Plots for all the galaxies in the sample are available electronically from www.arcetri.astro.it/$_{~{ }}$hunt/nicmos.html.
A few profiles show an apparent small inflection in the surface brightness at a radius of 0.5″ (e.g., NGC 5443, NGC 5475, NGC 5587, NGC 5854, NGC 4293, NGC 5838). This is an artifact due to the ellipse fitting algorithm which we set to start at a 0.5″ radius with an initial value of 0 for the ellipticity. In these galaxies, the algorithm was able to fit the central region within 0.5″ only with circular isophotes; beyond this, the best fit was obtained with elliptical isophotes.
4.2 Unsharp Masking from Ellipse Fitting
Using the STSDAS task bmodel, we converted the fitted elliptical isophotes into a smooth model of the galaxy surface brightness distribution, and subtracted it from the original image, out to a typical radius of typically 100 pixels. The resulting residual images are then normalized by the original image. Examples are shown in the right panels of Figures 2–6, which present the fractional deviations of the brightness distributions from the purely elliptical fitted isophotes. These images, very much like unsharp masks, filter out the low spatial frequencies, and show the fine-structure residual structures that cannot be fitted by any smooth symmetric model. Since we kept the center of the concentric ellipses fixed, any central structure is due to non-axisymmetric structure on small spatial scales. A comparison of our unsharp mask images with those in common with Ravindranath et al. (2001) shows that they are virtually identical. Although our methods differ, the results are similar because no model with only axisymmetric components, even if fully two-dimensional, can fit these fine structures.
4.3 Reliability Checks
11 galaxies in our sample were observed more than once, by different NICMOS cameras or different observers (e.g., UM 146, NGC 5033, NGC 5252, and NGC 5273 with NIC-1 and NIC-2; NGC 1241, NGC 2639, NGC 2841, and NGC 3627, NGC 4102, and NGC 6744 with NIC-2 and NIC-3; NGC 2985 by different observers with NIC-2). Although these frames were reduced independently, we find that the resulting photometry, isophotes and visual appearances are virtually identical, as shown in Figure 7.
The only disagreement larger than a few hundredths of a magnitude is for the nuclear region of NGC 5033; however the two profiles are identical beyond a radius of 0.15″. The position angles () may disagree because of the different orientations of the observations, since the profile extraction and analysis was performed on the original (unrotated to canonical North up, East left) images. The generally excellent agreement gives us confidence that the images, photometry and surface brightness profiles analyzed below are accurate and reproducible. This also means that -band nuclear variability above 10-20% is not very common, as already mentioned in 2.3. In all cases, we have incorporated only the higher resolution images in the analysis.
A number of the galaxy images presented in this study have already been reduced and analyzed independently by Ravindranath et al. (2001) and Laine et al. (2002). We have 14 galaxies in common with Ravindranath et al. (2001). By comparing their brightness profiles and unsharp masks with ours, we find generally very good agreement. Only in four cases do our masks not reveal the structure that they find with two-dimensional bulge/disk decomposition models. In all these, theirs show very faint axisymmetric features, while our USMs are featureless. This shows that our USMs are as efficient as more sophisticated ones in revealing the small-scale non-axisymmetric structure that we are interested in. The profile parameters ( and ) of the 67 galaxies in common with Laine et al. (2002) also agree well. However, the agreement is worse when the galaxy is more inclined; this is probably because Laine et al. (2002) deproject their profiles in order to analyze bar properties on all scales while we do not. When the galaxies are face-on or almost, our profiles are identical to theirs.
4.4 Central Fine Structure
A “profile analyzer” was applied to the linearly-spaced profiles. This objective algorithm follows each profile and calculates the extrema and radial variations of the fitted ellipticities, position angles, , and coefficients. Probable morphological features are identified automatically in each profile, but the profiles were subsequently inspected visually by both authors independently to ensure against spurious features. The logarithmically-spaced profiles were also subjected to the analyzer, then checked visually as before. When a feature was clear in the linearly-spaced profiles, but less so in the log ones, a “?” was assigned to it. These relatively more uncertain features are given half-weight in the subsequent statistical comparison (see also 5). All 250 profiles were analyzed before the galaxy samples were compiled; in principle no bias was introduced because of preconceived knowledge of activity type. For each galaxy, our findings of bars, isophotal twists, large coefficients, boxy/disky isophotes, and high-amplitude non-axisymmetric structure as identified in the unsharp masks are reported in Table 2.
4.4.1 Bars
Bars are defined in the profile analyzer (and visually) according to McLeod & Rieke (1995) and Wozniak et al. (1995); the requirement is that the fitted position angle (PA or ) remains constant to within , while the ellipticity monotonically rises to a maximum, then falls to some value, which on larger scales is usually determined by the galaxy inclination (). This is a slightly different definition of a bar than that of Laine et al. (2002), who require that the PA remains constant to within . Indeed, some of the features that we call isophotal twists (see below) may be identified as bars in Laine et al. (2002), a point which will be discussed in more detail in 5.
Imaging in the NIR is particularly sensitive to stellar bars. Bars imply non-axisymmetric radial streaming motions (e.g., Binney & Tremaine 1987) which may be relevant to nuclear fueling or a massive compact central object.
4.4.2 Isophotal Twists
Following Wozniak et al. (1995), Elmegreen et al. (1996), and Jungwiert, Combes, & Axon (1997), isophotal twists are defined as systematic rotations in fitted PA over a region with monotonically varying ellipticity . When twists occurred over the same radial range as the effects of a strong nuclear point-spread function (PSF), they were not considered significant.
Isophotal twists may be related to stellar orbits and resonances or triaxial structure (Shaw et al., 1993), although the presence of a resonance does not guarantee a twist (Elmegreen et al., 1996). Twists may also be related to nested bars (e.g., Shlosman, Frank, & Begelman 1989), either through gas viscosity and dissipation (Shaw et al., 1993) or through two misaligned bars at different pattern speeds (Friedli & Martinet, 1993).
4.4.3 and Coefficients
The higher-order ( and ) residuals to best-fit ellipses can be the diagnostic of dynamical instabilities in the stellar component. Significant boxy or disky isophotes are identified in those profiles where the cos4 coefficient, A4, is non-zero over a substantial range in radius; in the case of disky profiles, A40, and for boxy ones, A40 (Carter, 1978; Jedrzejewski, 1987). For a profile to obtain boxy or disky status, the A4 coefficient must be (these are normalized, see documentation of the IRAF/STSDAS ellipse task) over a range of radius well outside the nuclear PSF. This is because the NICMOS PSF tends to be boxy, and strong nuclei generally showed negative A4 terms close to the nucleus.
We defined significant cos3 or sin3 residuals in profiles where the coefficients of these terms, A3 or B3, are non-zero over some range in radius, and larger than the cos4 residuals over the same range. Given the fitting procedure followed in ellipse, it is unlikely that the same galaxy image can show both strong A3/B3 coefficients as well as strong A4 coefficients (“boxiness”) over the same radii. We confirmed that these two classifications are virtually mutually exclusive in our study: the presence of strongly detectable boxiness eliminates the possibility of detecting strong A3/B3 asymmetry, and vice-versa.
Boxy/disky isophotes in the central regions of elliptical galaxies have been investigated with numerical simulations, which suggest that they may originate in mergers of disk galaxies (Naab, Burkert, & Hernquist, 1999). It is unclear whether this phenomenon could explain such isophotes in the galaxies observed here, because they have retained their stellar disk. Nevertheless, it may have bearing on the merger origin of Seyfert activity as proposed by Dultzin-Hacyan et al. (1999); Krongold, Dultzin-Hacyan, & Marziani (2002). Boxy isophotes and excesses in disk galaxies may also be related to internal dynamical instabilities and vertical resonances (Merritt & Hernquist, 1991; Pfenniger & Friedli, 1991; Patsis et al., 2002). However, strong A3/B3 coefficients primarily measure distortions from dust filaments (Peletier et al., 1990), although they can show up as morphological disturbances produced by close gravitational encounters with nearby companion galaxies (Kenney et al., 1996).
4.4.4 Unsharp-Masked Images
Each residual image was searched automatically for regions of particularly large positive or negative deviations from the model fit. A grid of squares was superposed onto each galaxy, with a length set to the integral number of pixels closest to a physical distance of 180 parsecs. (These squares were on average about 12 x 12 pixels in size). This search was repeated with the grid of squares shifted by half a box in both coordinates. For each search and each box, the median, mean, and mode of the residual image was calculated, and the boxes with the highest and lowest median values were identified. The nuclear region was avoided in the searches because of possible contamination by a strong nuclear PSF. We defined a “significant” deviation in the unsharp-masked images (normalized residuals from the smooth ellipse fit, hereafter USM) as one with an absolute value of the median in one or boxes of 0.27 or greater. This somewhat arbitrary cut-off was established by visual inspection of all the USMs, and the consequent evaluation of what was a real feature. Bad pixels had been previously removed by the reduction algorithm, but we checked to make sure that none of the significant USMs was defined so because of bad pixel contamination. The last column (14) of Table 2 lists all USMs which have any 180-parsec boxes which deviate from the smooth model fit by more than +/- 27%; those with positive deviations are designated with , and negative ones with .
Negative USM residuals are typically associated with dust (e.g., Sparks et al. 1985), while positive features may indicate star clusters or compact HII regions, similar to color images (Pogge & Martini, 2002). The unsharp mask structure with this technique is usually very similar to emission-line images when these last are available (e.g., Böker et al. 1999), and in most cases also to color images (Martini & Pogge, 1999; Martini et al., 2003a). Good examples of this agreement are NGC 3786, UGC 12138, NGC 5033, NGC 5252, NGC 5273 (Sy1s), and NGC 5347, NGC 5929, and NGC 7674 (Sy2s). Because negative USM residuals tend to indicate the presence of dust, it is important to compare the diagnostic with the USM one.
5 Results: Comparison of Seyfert, LINER, HII and Normal Galaxies
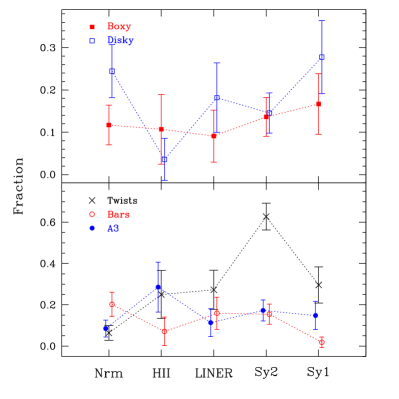
The fractions of each morphological diagnostic as a function of activity class (normal, HII/starburst, LINER, Sy2, Sy1) are reported in Table 3, and shown graphically in Figures 8 and 9. Fractions are calculated by assigning unit weight to “certain” identifications (when the features were evident in both the linear- and logarithmically-spaced profiles), and half weight to less certain ones. Figure 8 shows the frequencies of small-scale bars, isophotal twists, boxy/disky isophotes, and the cos and sin residual (denoted as A3/B3). Figure 9 shows these frequencies for the indicators of strong nuclear asymmetry, namely the positive/negative residuals measured in the unsharp masks, and the cos and sin residuals (repeated from Fig. 8).
| Activity | SamplebbFirst line: matched samples; second line: matched samples with additional distance constraint; third line: matched samples with inclination constraint. | Number | Isophotal | Bars | Boxy | Disky | USM | USM | |
|---|---|---|---|---|---|---|---|---|---|
| Class | Twists | A3/B3 | A40 | A40 | 0 | 0 | |||
| (1) | (2) | (3) | (4) | (5) | (6) | (7) | (8) | (9) | (10) |
| Normal | Matched (MS) | 47 | 0.06 0.04 | 0.20 0.06 | 0.09 0.04 | 0.12 0.05 | 0.24 0.06 | 0.09 0.04 | 0.17 0.05 |
| D80 Mpc (DMS) | 47 | 0.06 0.04 | 0.20 0.06 | 0.09 0.04 | 0.12 0.05 | 0.24 0.06 | 0.09 0.04 | 0.17 0.05 | |
| (IMS) | 32 | 0.09 0.05 | 0.17 0.07 | 0.08 0.05 | 0.05 0.04 | 0.20 0.07 | 0.03 0.03 | 0.13 0.06 | |
| HII/ | Matched (MS) | 14 | 0.25 0.12 | 0.07 0.07 | 0.29 0.12 | 0.11 0.08 | 0.04 0.05 | 0.50 0.13 | 0.50 0.13 |
| D80 Mpc (DMS) | 14 | 0.25 0.12 | 0.07 0.07 | 0.29 0.12 | 0.11 0.08 | 0.04 0.05 | 0.50 0.13 | 0.50 0.13 | |
| starburst | (IMS) | 14 | 0.25 0.12 | 0.07 0.07 | 0.29 0.12 | 0.11 0.08 | 0.04 0.05 | 0.50 0.13 | 0.50 0.13 |
| LINER | Matched (MS) | 22 | 0.27 0.09 | 0.16 0.08 | 0.11 0.07 | 0.09 0.06 | 0.18 0.08 | 0.09 0.06 | 0.00 0.00 |
| D80 Mpc (DMS) | 22 | 0.27 0.09 | 0.16 0.08 | 0.11 0.07 | 0.09 0.06 | 0.18 0.08 | 0.09 0.06 | 0.00 0.00 | |
| (IMS) | 20 | 0.30 0.10 | 0.12 0.07 | 0.07 0.06 | 0.07 0.06 | 0.20 0.09 | 0.05 0.05 | 0.00 0.00 | |
| Sy 2 | Matched (MS) | 55 | 0.63 0.07 | 0.15 0.05 | 0.17 0.05 | 0.14 0.05 | 0.15 0.05 | 0.15 0.05 | 0.11 0.04 |
| D80 Mpc (DMS) | 51 | 0.65 0.07 | 0.16 0.05 | 0.17 0.05 | 0.15 0.05 | 0.12 0.05 | 0.16 0.05 | 0.08 0.04 | |
| (IMS) | 50 | 0.65 0.07 | 0.16 0.05 | 0.18 0.05 | 0.15 0.05 | 0.11 0.04 | 0.10 0.04 | 0.06 0.03 | |
| Sy 1 | Matched (MS) | 27 | 0.30 0.09 | 0.02 0.03 | 0.15 0.07 | 0.17 0.07 | 0.28 0.09 | 0.11 0.06 | 0.26 0.08 |
| D80 Mpc (DMS) | 18 | 0.25 0.10 | 0.03 0.04 | 0.06 0.05 | 0.19 0.09 | 0.22 0.10 | 0.17 0.09 | 0.22 0.10 | |
| (IMS) | 23 | 0.35 0.10 | 0.02 0.03 | 0.17 0.08 | 0.07 0.05 | 0.28 0.09 | 0.09 0.06 | 0.30 0.10 |
To determine statistical significance, we compared the structural properties among the various activity sub-samples using the z-test (Moore & McCabe, 1989)444This test requires a z score of greater than 1.65 for differences which have a 5% or lower probability of being due to chance (95% significance).. Uncertainties in the fractions are given as , where is the number of features in activity class act, and is the total number in the class. We list in the following only those trends which are 95% significant in all three sample sets (MS, DMS, IMS):
-
•
There are more isophotal twists in Sy2s, and fewer of them in non-active galaxies than in any other class. 637% of the Sy2s possess twisted isophotes, in contrast with only 64% the normal galaxies. The significance levels of these differences range from 2.2 (Sy2, non-active vs. HII, LINER, Sy1) to 5.8 (Sy2 vs. non-active).
-
•
Bars are less frequent in Sy1s relative to normal galaxies; 23%555This corresponds to 0.5 galaxies, because of the half weighting used for uncertain determinations. of the Sy1s and 206% non-active galaxies have nuclear bars according to our definition. This difference is a 2 effect (98% confidence level).
-
•
2912% of the HII galaxies have strong residuals compared to 94% of non-active galaxies. This is a significant excess at a confidence level of 98% (2).
-
•
Only 45% of HII/starbursts contain disky isophotes, a deficiency significant at a 2 level relative to the the 246% fraction of non-active galaxies . There is no difference among the samples for boxy isophotes.
-
•
5013% of the HII galaxies contain either positive or negative USM residuals. Negative USM residuals occur more often in HII/starbursts than in any other activity class, differences significant at . Positive USM residuals are also more frequent in HII’s than in non-active galaxies (2.5), LINERs (3.7), and Sy2s (3.3), and also more frequent in Sy1s relative to Sy2s (1.8) and LINERs (2.6). They are less frequent (0 objects) in LINERs than in any other class.
In addition to the three main sets of samples (MS, DMS, IMS), we also divided the samples into high- and low-luminosity groups, and recalculated the statistics. The significantly greater frequencies of isophotal twists in Sy2s, A3 and USM positive residuals in HII/starbursts, and fewer bars in Sy1s emerge as before. For particular features (see 5.1, 5.4, 5.5), we also derived statistics on subsets of early and late Hubble types. The significance of the trends was usually enhanced. We therefore conclude that these results are robust to possible sample biases, and in what follows, each feature is discussed in detail.
5.1 Isophotal Twists
More than 60% of Sy2 galaxies show twisted isophotes, while the frequency of twists in all of the remaining active samples is roughly 2030%. Only the non-active galaxies show a very low fraction of 6%. It is difficult to attribute this result to different sensitivity to structure on a given spatial scale, because the median resolution of the Sy2 sample is very similar to the non-active and HII samples (Table 1).
We have examined the possibility that the isophotal twists are related to primary large-scale bars (e.g., Shaw et al. 1993; Friedli et al. 1996; Jungwiert, Combes, & Axon 1997). By considering the bar classes from RC3, and then tallying the twisted isophotes which occur in barred galaxies, we find that the majority of them are found in the SAB and SB galaxies, with the exception of the Sy1s. However, while 3 of 3 twists (100%) in the non-active sample are associated with SB or SAB morphology, and 75% in LINERs, the percentage decreases considerably for the remaining activity types. Only 57% of the twisted isophotes in HII (2 of 3.5 twists) and Sy2 galaxies (19.5 of 34.5) are found in barred galaxies, and 38% (3 of 8) of the twists in Sy1s. Although these numbers suffer to some degree from small-number statistics, they indicate that a substantial fraction of circumnuclear twists in Seyferts are not found in previously known barred galaxies.
We also investigated the possibility that the differences in frequency of twisted isophotes among the samples are related to Hubble type, since they tend to be found primarily among early spirals (Friedli et al., 1996; Elmegreen et al., 1996). If we divide the samples into late () and early () types and redo the analysis, we find that the same statistical differences are shown by both the early and late sub-samples. Indeed, the isophotal twists in our sample are not confined to strictly early-type morphologies, as they are seen in Hubble types as late as Sc (e.g., NGC 5643). The early Hubble types taken alone show significantly more twists in Sy2s relative to non-active galaxies, LINERs, and Type 1 Seyferts as before666The small number of early types in the HII sample are not not sufficient to make the differences significant, although the same trend is present.. We conclude that the greater frequency of isophotal twists in Sy2s, and their lesser frequency in non-active galaxies, are not caused by differences in Hubble types among the samples.
5.2 Bars
Even though A.6 shows that 84% of the HII sample contains large-scale bars and more than half the galaxies in the remaining samples are barred, there are very few bars on the scales probed by our NICMOS images. The largest bar fraction we find is % in the non-active sample; the active galaxies have fewer bars, %, and the Sy1s show no bars at all (at best we have an uncertain determination, which we have given 0.5 weighting in the analysis). It is likely that the low bar fraction in Sy1s and starbursts is related to the excess of positive USM residuals (see 5.5); both have significantly high fractions of these, together with anomalously low fractions of bars. Such irregular structure would make it difficult for the profile analyzer to pick out a bar. Also a strong nuclear point source would make bar detection more difficult.
Our result agrees with Regan & Mulchaey (1999), Martini & Pogge (1999), and Martini et al. (2001), who found a low fraction of nuclear bars in Seyfert galaxies. However, it contrasts with that of Laine et al. (2002) who find an “excess of bars among Seyfert galaxies at practically all length scales”. Much of the difference may lie in our slightly more conservative definition of bars; they use a maximum of 20∘ for the PA variation in a bar, while we use to define isophotal twists. A detailed comparison of our bar classes with those in Laine et al. (2002) supports this explanation. Of the 34 Seyferts in common with them, our bar classifications agree in 24 objects777We both find nuclear bars or none, or we find no bars, and they find only large-scale bars.. Of the ten remaining objects, 7 of their nuclear-scale bars are defined here as twists. Also, Laine et al. (2002) combine the high-resolution NICMOS images with large-scale NIR and optical images, while with our data, we are really only looking at nuclear bars. Indeed, virtually all of the single bars, and a large fraction of the secondary bars detected by Laine et al. (2002) would not be detected in our images because of their small field-of-view.
5.3 Boxy and Disky Isophotes
The frequency of boxy isophotes (A4 0) is not significantly different in any of the samples. Boxiness in the inner kpc is rare, being found in 10% of all galaxies (see Table 3).
Disky profiles (A4 0) are slightly more frequent than boxy ones. Significantly disky isophotes are found in 20% of all galaxies except for HII/starbursts (Table 3). Only 45% of the HII/starbursts have disky profiles, a significant deficit relative to the other activity samples, but which rests on small-number statistics. This absence of deviations in the starbursts’ isophotes may be partly explained by their unusually high frequency of distortions, discussed next.
5.4 3 Distortions and Dust Absorption
Large coefficients, A3/B3, occur most often in HII/starbursts (29%). They are least frequent in the non-active galaxies and LINERs (%), and intermediate in the Seyferts with %.
The presence of strong deviations from elliptical isophotes, and in particular large coefficients, are usually indicators of strong dust absorption (Peletier et al., 1990). Such features are most frequent in the HII galaxies, suggesting morphological disturbances traced by dust. The Seyfert galaxies also show these disturbances, but only half as often as HII/starbursts, although large A3/B3 are more frequent in Seyferts than in LINERs and non-active galaxies.
The A3/B3 residuals are the only fine structures that become significantly more likely in later galaxy morphologies. Indeed, our results show that, with the exception of the Sy2s, by far the majority of A3/B3 residuals occur in spirals with . To better assess whether our result depends on different Hubble type distributions among samples, we have divided each subsample into early () and late () as in 5.1, and performed again the statistical comparison. We find that among the late-type samples only, there is no significant difference in A3/B3 residuals; any activity class of late Hubble type is equally likely to show deviations to smooth ellipses. Among the early types however, in addition to the excess of A3/B3 residuals in HII galaxies (25%), 20% of the Sy2s but none of the Sy1s and only 4% of the non-active galaxies show deviations; the high fraction in Sy2s is a significant difference at 2.4. Hence, in starbursts and Sy2s, the excess of the A3/B3 features emerges among the early Hubble types, where such morphologies are usually more rare.
MGT also found dust absorption more often in Sy2s than in Sy1s. There is some correlation between our finding of residuals and their reporting dust, but it is far from perfect. One reason for this may be because the shorter wavelength of the F606W filter made the WFPC2 images analyzed by MGT more sensitive to dust lanes. Another reason for the difference may be that dust lanes are not necessarily distributed in “banana-” or “heart-shaped” isophotes; our diagnostic would miss these.
5.5 Unsharp-Mask Residuals
Half the HII/starbursts show negative USM residuals, followed by the type 2 Seyferts with 15%, 11% of the Sy1s, and 9% of the non-active galaxies and LINERs. The excess of negative USM residuals in the HII galaxies is highly significant. A similar frequency (50%) of positive USM residuals is found for the HII/starbursts, followed by the Sy1s with 26%, 17% of the non-active galaxies, 11% of the Sy2s, and no LINERs. Again the excess of positive USM residuals in the HII galaxies is significant. The LINERs have the lowest frequency of features in the USM images–they have the smoothest isophotes.
The statistics for the negative USM residuals are similar to the ones (see Fig. 9), lending support to the idea that both diagnostics are revealing irregular dust morphology. We repeated the statistical analysis for USMs by dividing each subsample into early and late types as in the previous section. Like the A3/B3 residuals, the negative USM ones are more than 3 times as common in late-type spirals as in early-type ones independently of activity type, except for the HII/starbursts where they are equally as common. Among the early-type spirals the only three classes that show negative USM residuals are HII’s (67%), Sy2s (9%), and non-active galaxies (4%); no early-type LINERs nor Sy1s have these features. In terms of these diagnostics, the HII/starbursts are the galaxies most affected by dust. Sy2s are the next most affected class, particularly among the early Hubble types.
We checked that the excess of positive USM residuals in Sy1s is not due to strong point-source contamination. Visual inspection shows that the positive residuals are more extended and irregular than a strong nuclear PSF. Also most of the US mask structures are not aligned with the diffraction spikes of the central point source (see e.g., Fig. 6) We therefore conclude that the positive USM residuals are real, and not an artifact of the strong nuclear unresolved sources generally seen in type 1 Seyferts. It is noteworthy that a similar excess of positive USM residuals is found in HII/starburst galaxies; both Sy1s and starbursts have significantly greater fractions of positive USM residuals than any other class. However, we hesitate to ascribe them to the same cause (localized bursts of star formation?) because of the other differences in morphology between the two classes.
6 Non-axisymmetric Structure and AGN Fueling
The most robust result which emerges from our analysis is the excess of isophotal twists in type 2 Seyferts. Such features must be implicated in the fueling of BHs in Sy2s, but not in Sy1s. Isophotal twists in spiral galaxies can have several possible causes. Projection effects on triaxial ellipsoids (bars, bulges) can cause the isophotes to appear twisted when viewed from an oblique angle (Wozniak et al., 1995; Friedli et al., 1996; Jungwiert, Combes, & Axon, 1997). Independently of projection angle, triaxial bulges embedded within a primary bar or nested misaligned secondary bars within primary bars can also result in twisted isophotes (Friedli & Martinet, 1993; Shaw et al., 1995; Elmegreen et al., 1996). The presence of gas accumulated within orbital resonances in a barred galaxy could also give rise to twists, because of the misalignment of the central stellar component with respect to the primary bar (Shaw et al., 1993; Combes, 1994; Friedli et al., 1996; Jungwiert, Combes, & Axon, 1997). The models by Knapen et al. (1995), Heller & Shlosman (1996), and Regan & Teuben (2003) show how this could happen, although perhaps not all Sy2s have a sufficiently high gas fraction for nuclear gaseous disks to be a universally viable explanation. On the other hand, the isophotal twists could be related to the deficiency of thin stellar bars in Seyferts found by Shlosman, Peletier, & Knapen (2000); bars tend to be weaker (thinner) in the presence of a cold and clumpy gas component which could be causing the twists.
Our analysis is generally not able to distinguish among these alternatives, although we argue that projection effects at these spatial scales are difficult to correct for. While some authors have deprojected ground-based images (e.g., Friedli et al. 1996; Jungwiert, Combes, & Axon 1997; Laine et al. 2002), we have not done so because there is no a priori reason to suppose that the circumnuclear structures probed by our images are coplanar with the outer disk.
Star formation patterns, spiral arms, or absorption by dust could produce distorted central isophotes, although this is much less probable in the NIR than in the optical. However, a substantial number of the twisted isophotes in Sy2s may be due to genuine nuclear triaxial structures. Some of them are clearly associated with dust features, and morphological disturbances signified by the coefficient (e.g., UGC 2456=Mrk 1066) or dust lanes (e.g., NGC 3079), but others are found in otherwise unremarkable morphologies, even in the USM image (e.g., NGC 3982). All of the structures that could give rise to isophotal twists in our images triaxial bulges, nested misaligned bars, nuclear gas disks would disrupt kinematics at small spatial scales. Nuclear disks and bars are associated with inward gas flow, but the connection between triaxiality and inflow is not so clear. Either way twists appear to be a signature of Seyfert activity, but only in type 2s. Possible reasons why isophotal twists are not found as frequently in Sy1s are discussed below.
What we identify as isophotal twists could also be a manifestation of the nested-bar scenario of Shlosman, Frank, & Begelman (1989) and Laine et al. (2002). Nevertheless, since only a fraction of the twists in our sample are found in barred galaxies, our observations may not be entirely consistent with it.
We find significant differences in the dust content of Sy1s and Sy2s among the early Hubble types, in agreement with Storchi-Bergmann et al. (2001). Among late types, there is no difference in A3 or negative USM residuals, where they are more frequent in all activity classes. However, among early types the differences between Sy2s and Sy1s are significant. Seyferts are also found primarily in early morphological types (Moles, Marquez, & Perez, 1995), which suggests that Hubble type may be related to nuclear activity. However, type alone does not seem to be enough. Seyfert activity, at least in Sy2s, seems to be distinguished also by a greater morphological irregularity, as shown by the excess of twists and A3s.
7 Testing Unification Schemes: Comparison of Seyfert 1 and 2 Host Galaxies
Unified Schemes assert that Seyfert 1 and 2 nuclei are intrinsically the same. Their apparent differences are due to additional dust absorption of much of the Seyfert 1 emission (UV to soft-Xray continuum and broad emission lines). In the torus model, this absorption occurs very close to the central engine and is co-aligned with its axis. Since this axis is in general uncorrelated with the major axis of the host galaxy (Keel, 1980; Schmitt et al., 2001), no systematic differences are expected between Seyfert 1 and Seyfert 2 host galaxy properties.
In apparent disagreement with the torus model, we find some significant differences between our samples of Seyfert 1 and 2 host galaxies.
-
•
Isophotal twists are twice as common in Sy2s as in Sy1s (637% vs. 309%). This significant difference (see 5.1) is not readily explained by the Unified Scheme.
-
•
Bars are present in 15% of our Sy2 galaxies, but in 2% of the Sy1s. Even if we loosened our definition of a “bar”, so that it would include the cases we call “isophotal twists”, the Sy 1 vs. 2 difference would still remain: Sy2s have a significantly higher fraction of bars or twists than do Sy1s.
-
•
Among the early-type Seyferts (), 20% of the Sy2s have residuals, but no Sy1s, a formally significant difference (see 5.4). Nevertheless, our other dust indicator, strong negative residuals in the USMs, confirms only weakly the suggestion of excess dust in the centers of Sy2s. Our result is weaker than that of MGT who claimed that the centers of Sy2 galaxies had systematically more, or more widely distributed dust absorption than those of Sy1 galaxies. The reason may be due to the lack of sensitivity to dust of our infrared images, although sample effects may also be important; we find no differences among late Hubble types but significant ones among early types.
If the Seyfert 1 and 2 galaxies differ in more ways than just the orientation of a central torus, then perhaps they represent nuclear activity from black hole accretion in different evolutionary stages, which we will now explore.
7.1 Evolutionary Scenario?
Our sample of “normal” (non-active) galaxies defines a morphological baseline against which various samples of active galaxies can be compared. We find that the central isophotes of normal galaxies are usually well described by ellipses at a relatively constant (to within 10∘) position angle. Thus they show very few significant or deviations, or other large excesses or deficiencies of light that would appear in unsharp masking. The other extreme of our non-AGN baseline is defined by the HII/starburst galaxies which contain relatively large amounts of interstellar matter and young stars. These differ mainly from the normal galaxies in having strong positive and negative light excesses in their USMs, and strong deviations from elliptical isophotes.
Among our AGN (“active”) galaxy sub-samples, the LINERs show the least non-axisymmetric structure, and the closest morphological similarity to the normal galaxies. They have the smallest fraction of significant A3 residuals, and the USMs show that they are in fact even more featureless than the normal galaxies. That the LINER sample is the closest most well-resolved one only strengthens this result. This would be consistent with the view that LINERs are early-type galaxies with little indications of any recent disturbance. The Seyferts lie between the HII/starbursts and the LINERs. But we are unable to identify any particular morphological peculiarities that equally distinguish both Seyfert 1s and Seyfert 2s from the other kinds of less active galaxies. Thus one standard morphological “explanation” for all Seyfert activity may not exist.
We speculate that these patterns of small-scale non-axisymmetric structure are the footprints of an evolutionary scenario, which we hypothesize starts with a HII/starburst, and ends with (or returns to) a normal galaxy. HII/starburst galaxies are morphologically “younger”, viewed soonest after the onset of a dynamical instability, either intrinsic or extrinsic induced by a merger, interaction, or accretion event. Large A3/B3 and USM residuals are the morphological signatures of the cataclysmic perturbation(s) which triggered the starburst. Nuclear bars on the 100s-pc scales studied here do not seem to be directly implicated for the starburst, since the bar fraction in the HII galaxies is not excessive, unlike their fraction of large-scale bars (Hunt & Malkan, 1999).
Our results would place Sy2s earlier or “younger” than Sy1s in the evolutionary sequence, but later or “older” morphologically than a HII/starburst. Of the two Seyfert types, Sy2s appear to be more morphologically disturbed in their central regions than Sy1s. More than 60% of the Sy2s show isophotal twists, and their A3/B3 fraction in the early-type subset (see 5.4) is second only to the HII galaxies. Sy2s are also intermediate between starbursts and Sy1s in other features such as disky isophotes and nuclear bars. The only exception to this generalization is the higher incidence of positive USM features in Sy1s and starbursts, for which we have no explanation.
Our hypothetical placement of Seyferts as intermediate evolutionary stages between “younger” starburst galaxies and “older” non-active galaxies and LINERs is consistent with our previous results from morphology on larger scales. HII/starbursts in the 12 m sample were found to have an excess of large-scale bars, and Seyferts unusually high rates of outer rings (Hunt & Malkan, 1999). Either of these features could be produced by some instability or interaction event, but outer rings cannot even form before yr and require a bar to do so (Buta & Combes, 1996). This would suggest that Seyfert activity is prompted by a disturbance, but with a significant time delay relative to the relatively rapid burst of star formation that preceded it. The structures that could be responsible for twists (nuclear disks, nested or misaligned bars) have evolution times of a few yr, but the process requires a bar to have already formed (at least in the simulations, see Shaw et al. 1993; Knapen et al. 1995; Heller & Shlosman 1996; Friedli et al. 1996). Hence, isophotal twists are apparently younger than outer rings, but older than the relatively prompt results of a galaxy interaction, such as a violent star-formation episode. Twists may be a subsequent phase of what originally began as a bar-induced starburst.
Taken together, these results could be a confirmation of the HII-Sy2 evolutionary scenario proposed by (Storchi-Bergmann et al., 2001; Kauffmann et al., 2003), and the HII-Sy2-Sy1 scenario proposed by us and other groups (Hunt & Malkan, 1999; Krongold, Dultzin-Hacyan, & Marziani, 2002; Levenson et al., 2001). Relatively young (1 Gyr) stellar populations are found in more than half of type 2 Seyferts (Schmitt, Storchi-Bergmann, & Cid Fernandes, 1999; González Delgado, Heckman, & Leitherer, 2001; Cid Fernandes et al., 2001; Raimann et al., 2003). High-luminosity broadlined AGN in general host similarly young populations, and there is evidence for bursts of star formation in AGNs which occurred up to a few Gyr ago (Kauffmann et al., 2003). These timescales agree roughly with what we have deduced from the non-axisymmetric morphology. First, a dynamical instability turns a galaxy into a starburst with disturbed and dusty morphology, on a timescale corresponding to the large-scale bar formation time of yr. Given a sufficient gas supply, a starburst could evolve toward a Sy2, after the time necessary (few times yr) to set up sufficiently efficient gas inflow as manifested by nuclear disks, misaligned bars, or triaxial structures, to which we attribute the observed twists. After another Gyr or two, a Sy2 could “settle down” to a Sy1 with an outer ring which is a signature of the previous inflow and consequent outflow of material and angular momentum. Such an evolutionary trend could be episodic, depending on the environment and the disk kinematics, since a new instability or external perturbation could start the process all over again.
LINERS are the most morphologically “settled down”, viewed perhaps much after the event which triggered a starburst, and, in our picture, the onset of nuclear activity. This would imply that LINERs are either unrelated to Seyferts, or are “exhausted” Seyferts at the end of their fuel supply. The latter scenario seems more plausible in the light of the significant excess of inner rings in LINERs (Hunt & Malkan, 1999). In inner or nuclear rings, gas tends to pile up in the resonances rather than funneling inward to the nucleus (Regan & Teuben, 2003). Thus inner rings slow down or halt completely the gas supply available for feeding an accreting BH (e.g., Combes et al. 2004). LINERs, with their high fraction of inner rings, could be “starving AGNs”.
8 Conclusions
NICMOS imaging of the centers of large numbers of normal and active galaxies has revealed some systematic morphological differences. The normal galaxies and LINERs tend to have the most regular images, while HII/starbursts are the most disturbed. The Seyfert galaxy morphologies tend to be intermediate between these two extremes.
Sy2s appear to be more structurally relaxed than HII/starbursts, but are more disturbed than Sy1s and LINERs. In terms of circumnuclear peculiarities, Sy2s appear to be intermediate between HII/starbursts and Sy1s; they show substantially more inner isophotal twists than any other class, and, in the early-type subset, are between the HII galaxies and the Sy1s in terms of and USM residuals.
If we hypothesize that the non-axisymmetric structure in the central part of the galaxy can influence the active nucleus by enhancing its gas fueling rate, then our morphological data can fit into the evolutionary scenario advanced by us (Hunt & Malkan, 1999) and other groups (Krongold, Dultzin-Hacyan, & Marziani, 2002; Levenson et al., 2001). The first result of a dynamical instability, perhaps caused by an interaction/close encounter, is to transform a “normal” galaxy into a “starburst”; then for a few hundred million years its spectrum may be characterized as an “HII region”. Later, as the bar evolves, perhaps forming nuclear disks or nested bars, the galaxy is more likely to appear as a Seyfert 2 because of increased gas inflow to the nuclear BH. Finally, after another billion years or so, when the central structure has evolved and “relaxed” into a greater degree of axisymmetry, but still able to feed the BH, the galaxy would appear as a Seyfert 1. LINERs, because of their smooth appearance, could be “starved” AGNs, having exhausted the available fuel supply, at least temporarily.
Appendix A Distributions of Parameters for Matched Samples
We have analyzed the full sample of 250 galaxies in terms of distance, physical spatial scale, luminosity, Hubble type, and inclination in order to minimize possible selection biases among the activity samples. The properties of the galaxies which we have eliminated in order to construct the matched samples described below are given in Table 4.
A.1 Distance
To ensure sufficiently high spatial resolution, we eliminated from further consideration all NIC-3 galaxies with recession velocities 5000 km s-1. Pixel size in parsecs (pc/pixel) was then obtained from the camera pixel scales, with distances determined by assuming a Hubble constant of km s-1 Mpc-1 (Sakai et al., 1997), and a Virgocentric infall model with an infall velocity of -300 km s-1 (Geller & Huchra, 1983). The distances of four nearby galaxies (NGC 404, NGC 4395, NGC 4569, NGC 5055) were taken from the Nearby Galaxies Catalogue (Tully, 1994), and other galaxies with negative velocities were assigned a distance of 5 Mpc.
All objects with distances 10 Mpc were eliminated a priori. Moreover, to match the distance medians of the subsamples to within 20 Mpc, we had to eliminate several distant Seyfert galaxies. The resulting set of samples (to which all the constraints described in the following sections also apply) contains 165 galaxies, and we denote it as MS (Matched Samples). The worst mismatch is that between the LINERs and Sy1s; the Sy1 sample is roughly 27 Mpc (55%) more distant than the LINERs. The distance medians of the remaining samples relative to the Seyferts are within 20 Mpc of one another. Both Seyfert samples are, at median distances of 49 (Sy1s) and 37 (Sy2s) Mpc, substantially closer than either the 12 m sample (Hunt & Malkan, 1999), or the CfA Seyferts (Huchra & Burg, 1992).
We also created a second more rigorous set of samples (DMS, Distance Matched Samples) consisting of 152 galaxies, in which all objects with distances 80 Mpc were thrown out. 4 Sy2s and 9 Sy1s were eliminated by this constraint. The median distances of the DMS are much more closely matched, with 38 Mpc for the Sy1s and 36 Mpc for the Sy2s (see Table 1).
A.2 Parsec-per-pixel Scale
It is even more important to match our images to comparable resolution scales. Because the NIC-3 pixels are so large compared to the other two cameras (0.20″ vs. 0.075″ and 0.0475″), we truncated the samples so that no activity sample contained galaxies with pc/pixel 30. This cutoff, while arbitrary, defines roughly the physical scales of the morphological features we are interested in, since 3 pixels would correspond to 100 pc in the worst case. The majority of the galaxies excluded with this criterion were non-active ones, given that many of them were imaged with NIC-3. Constraining the parsec-to-pixel scale eliminated 28 galaxies, 23 of which are non-active. Both the MS and the DMS mentioned above and the third sample described below include this constraint.
The median physical pixel scales range from 7.5 (LINERs) to 15.2 (Sy1s) pc/pixel. In the DMS, the median Sy1 scale is 13.2 pc/pixel. The remaining samples have similar medians with 10.4, 12.6, and 12.9 pc/pixel, for the non-active, HII, and Sy2 samples, respectively. The maximum pixel scale is 25.9 pc/pixel for the Sy2 sample, closely followed by the Sy1s with 24.9 and the non-active sample with 24.5 pc/pixel. Figure 10 shows the relative parsec-to-pixel spatial scales for the MS.
A.3 Blue Luminosity
It was necessary to remove the lower luminosity galaxies from the normal and HII subsamples, because of the presence of (25) dwarf galaxies. The final minimum in blue absolute magnitude is , which resulted in a worst discrepancy of 1 mag between the normal sample and the more luminous Seyfert ones. The high-luminosity Seyfert galaxies were eliminated from the sample with the distance and pc/pixel criteria described previously. The low- and high-luminosity ends of all samples turn out to be similar ( and ) with the most and least luminous galaxies both being LINERs (NGC 1961: and NGC 5879: ). These ranges are virtually identical to the CfA Seyfert sample (Huchra & Burg, 1992), and we conclude that our samples should be a fair representation of Seyfert galaxies in terms of luminosity.
A.4 Hubble Type
The earliest types present have T=, one exemplar of which is present in the LINER (NGC 3379 = M 105) and Seyfert (NGC 1275, NGC 4278) samples. The latest types in the samples are one exemplar of T=9 (normal), and one of T=7 (HII). The remaining galaxies range from T= to T=6. Two Seyfert galaxies were classified as “S” (spiral) in RC3, and we assigned T=5 to these (see the LEDA database). The sample medians for Hubble type are Sab (LINER and Sy2), Sb (normal and Sy1), and Sbc (HII). These are very similar to the type distributions found in the 12 m sample (Hunt & Malkan, 1999), except for the later types here of Sy1s (12 m Sy1s have median Sa) and earlier types here of LINERs (12 m LINERs have median Sbc). The normal galaxies have the same median Hubble type as the Sy1 sample, and lie between the remaining active subsamples; thus they should be a “fair” comparison.
A.5 Galaxy Inclination
Because the inclination of a galaxy may affect our ability to distinguish morphology, we also checked for the apparent axial ratio distributions. The normal galaxies have a median inclination of 63∘, while the remaining samples . In particular the Sy2 sample has a median axial ratio of 0.73 (43∘), which may reflect the paucity of optically selected edge-on Seyferts (Keel, 1980).
In order to ensure that we are not missing peculiar morphology because of excesses in galaxy inclination, we created a third sample set of 139 galaxies, denoted as IMS (Inclination Matched Samples). Here all galaxies with inclination 70∘ were eliminated. This operation had the greatest impact on the non-active sample in which 15 galaxies were excluded.
A.6 Bar Types
Finally, we investigated the bar classifications based on the RC3 designations. With the exceptions of the HII sample which shows an excess of bars similar to the Markarian and 12 m starbursts (Hunt & Malkan, 1999) (84% strongly-SB or weakly-SAB barred) and the LINER sample with a deficit of bars (52% unbarred), the remaining three samples (non-active and Seyferts) show “normal” bar properties (Moles, Marquez, & Perez, 1995; Ho, Filippenko, & Sargent, 1997b) with % of the galaxies being either SB or SAB.
| Name | Dist. | RC3 Type | a | b | Mag. | Abs. Mag. | Pc/pixel | Bar | Twist | 3 | cos(4) | USM | |
|---|---|---|---|---|---|---|---|---|---|---|---|---|---|
| (1) | (2) | (3) | (4) | (5) | (6) | (7) | (8) | (9) | (10) | (11) | (12) | (13) | (14) |
| Non-active | |||||||||||||
| ESO205-G007 | 0.007 | 26.8 | SAB(rs)bc | 0.9 | 0.8 | 15.2 | 9.7 | Y? | D | ||||
| ESO240-G012 | 0.006 | 22.3 | S? | 1.3 | 0.5 | 14.3 | 8.1 | ||||||
| ESO548-G029 | 0.004 | 13.8 | SB? | 1.1 | 0.8 | 14.3 | 5.0 | ||||||
| ESO549-G018 | 0.005 | 19.2 | SAB(rs)c | 2.6 | 1.5 | 13.7 | 7.0 | ||||||
| ESO572-G022 | 0.006 | 30.4 | Sb | 1.3 | 0.4 | 14.8 | 11.1 | ||||||
| IC0749 | 0.003 | 14.6 | SAB(rs)cd | 2.3 | 1.9 | 12.9 | 14.2 | Y | Y? | ||||
| IC0750 | 0.002 | 13.4 | Sab:sp | 2.6 | 1.2 | 12.9 | 13.0 | Y | |||||
| MESSIER074 | 0.002 | 5.4 | SA(s)c | 10.5 | 9.5 | 9.9 | 5.2 | Y | |||||
| NGC0151 | 0.012 | 47.7 | SB(r)bc | 3.7 | 1.7 | 12.3 | 46.3 | Y | Y | ||||
| NGC0214 | 0.015 | 59.4 | SAB(r)c | 1.9 | 1.4 | 13.0 | 57.6 | Y | Y | ||||
| NGC0491 | 0.013 | 49.8 | SB(rs)b: | 1.4 | 1.0 | 13.2 | 48.3 | Y | Y | Y | |||
| NGC1345 | 0.005 | 18.1 | SB(s)cpec: | 1.5 | 1.1 | 14.3 | 6.6 | ||||||
| NGC1483 | 0.004 | 13.5 | SB(s)c | 1.6 | 1.3 | 13.1 | 4.9 | Y? | |||||
| NGC1688 | 0.004 | 15.5 | SB(rs)dm | 2.4 | 1.9 | 12.6 | 5.6 | ||||||
| NGC2082 | 0.004 | 14.2 | SAB(rs+)c | 1.8 | 1.7 | 12.6 | 5.2 | Y? | |||||
| NGC2104 | 0.004 | 15.0 | SAB(s)cd: | 2.0 | 0.9 | 13.2 | 5.5 | ||||||
| NGC2314 | 0.013 | 54.1 | E3 | 1.7 | 1.4 | 13.2 | 52.5 | Y? | |||||
| NGC2344 | 0.003 | 14.7 | SA(rs)c: | 1.7 | 1.7 | 12.8 | 5.3 | ||||||
| NGC2642 | 0.014 | 62.6 | SB(r)bc | 2.0 | 1.9 | 13.3 | 60.7 | Y? | Y | D? | |||
| NGC2672 | 0.014 | 62.9 | E1-2 | 3.0 | 2.8 | 12.7 | 61.0 | Y | |||||
| NGC2749 | 0.014 | 61.2 | E3 | 1.7 | 1.4 | 12.7 | 59.3 | B? | |||||
| NGC2758 | 0.007 | 29.6 | (R’)SBbcpec? | 1.9 | 0.5 | 14.0 | 10.8 | ||||||
| NGC2942 | 0.015 | 64.5 | SA(s)c: | 2.2 | 1.8 | 13.2 | 62.5 | Y | |||||
| NGC2998 | 0.016 | 69.4 | SAB(rs)c | 2.9 | 1.3 | 13.1 | 67.3 | Y | Y | ||||
| NGC3271 | 0.012 | 54.5 | SAB(s)00 | 3.1 | 1.8 | 12.9 | 52.8 | Y | |||||
| NGC3275 | 0.011 | 47.1 | SB(r)a | 2.8 | 2.1 | 11.8 | 45.7 | Y | Y | ||||
| NGC3544 | 0.012 | 53.8 | (R)SAB:(rs)a | 3.0 | 1.0 | 13.0 | 52.2 | ||||||
| NGC3769 | 0.002 | 13.6 | SB(r)b: | 3.1 | 1.0 | 12.6 | 13.2 | Y? | Y | ||||
| NGC3782 | 0.002 | 13.8 | SAB(s)cd: | 1.7 | 1.1 | 13.1 | 13.4 | ||||||
| NGC3928 | 0.003 | 17.1 | SA(s)b? | 1.5 | 1.5 | 13.2 | 6.2 | Y? | |||||
| NGC4085 | 0.003 | 13.8 | SAB(s)c:? | 2.8 | 0.8 | 12.9 | 13.4 | Y | |||||
| NGC4373 | 0.011 | 50.0 | SAB(rs)0-: | 3.4 | 2.5 | 11.9 | 48.5 | ||||||
| NGC4701 | 0.002 | 14.4 | SA(s)cd | 2.8 | 2.1 | 12.8 | 14.0 | Y | |||||
| NGC4786 | 0.016 | 68.7 | E+pec | 1.6 | 1.3 | 12.7 | 66.6 | ||||||
| NGC5444 | 0.013 | 59.2 | E+: | 2.4 | 2.1 | 12.8 | 57.4 | ||||||
| NGC5605 | 0.011 | 50.6 | (R’)SAB(rs)cpec: | 1.6 | 1.3 | 13.2 | 49.1 | Y | |||||
| NGC5641 | 0.014 | 64.0 | (R’)SAB(r)ab | 2.5 | 1.3 | 13.1 | 62.1 | Y? | Y | D | |||
| NGC5908 | 0.011 | 48.4 | SA(s)b:sp | 3.2 | 1.2 | 12.8 | 46.9 | B | |||||
| NGC6699 | 0.011 | 46.5 | SAB(s)bc | 1.5 | 1.5 | 12.6 | 45.1 | Y | Y | ||||
| NGC6754 | 0.011 | 44.1 | SAB(rs)bc | 1.9 | 0.9 | 12.9 | 42.8 | Y? | Y | D | |||
| NGC6808 | 0.012 | 47.0 | SA(r)abpec: | 1.5 | 0.8 | 12.5 | 45.6 | Y? | |||||
| NGC6876 | 0.013 | 54.3 | SB0- | 2.8 | 2.2 | 12.1 | 52.7 | ||||||
| NGC7188 | 0.006 | 20.9 | (R’2)SB(s)bc | 1.6 | 0.7 | 13.8 | 7.6 | ||||||
| NGC7259 | 0.006 | 20.2 | Sb | 1.1 | 0.9 | 13.9 | 7.3 | ||||||
| NGC7309 | 0.013 | 51.7 | SAB(rs)c | 1.9 | 1.8 | 13.0 | 50.1 | Y | Y | ||||
| NGC7457 | 0.003 | 8.2 | SA(rs)0-? | 4.3 | 2.3 | 12.1 | 3.0 | ||||||
| NGC7513 | 0.005 | 17.7 | (R’)SB(s)bpec | 3.2 | 2.1 | 13.1 | 6.4 | Y? | |||||
| NGC7690 | 0.005 | 17.9 | Sb | 2.2 | 0.9 | 13.0 | 6.5 | ||||||
| UGCA196 | 0.003 | 16.1 | (R’)SA(s)b | 3.2 | 1.3 | 13.3 | 5.9 | ||||||
| HII | |||||||||||||
| IC0745 | 0.004 | 20.2 | S0 | 0.7 | 0.6 | 14.2 | 7.3 | Y | Y | ||||
| IC4870 | 0.003 | 11.1 | IBm?pec | 1.6 | 0.9 | 13.9 | 4.0 | ||||||
| MRK0930 | 0.018 | 72.9 | Pair | 0.0 | 0.0 | 17.0 | 26.5 | ||||||
| NGC2989 | 0.014 | 60.4 | SAB(s)bc: | 1.7 | 0.9 | 13.6 | 58.6 | Y | Y | ||||
| NGC5653 | 0.012 | 53.1 | (R’)SA(rs)b | 1.7 | 1.3 | 12.9 | 51.5 | Y | |||||
| LINER | |||||||||||||
| MESSIER063 | 0.002 | 7.2 | SA(rs)bc/ | 12.6 | 7.2 | 9.3 | 7.0 | ||||||
| NGC0404 | -0.000 | 2.4 | SA(s)0-: | 3.5 | 3.5 | 11.2 | 0.9 | ||||||
| NGC7013 | 0.003 | 8.9 | SA(r)0/a | 4.0 | 1.4 | 12.4 | 3.2 | Y? | D? | ||||
| NGC7331 | 0.003 | 8.6 | SA(s)b | 10.5 | 3.7 | 10.3 | 3.1 | B?D? | |||||
| Seyfert 2 | |||||||||||||
| CGCG164-019 | 0.030 | 128.0 | Sa | 0.4 | 0.3 | 15.3 | 26.7 | Y? | Y | Y | D? | ||
| MESSIER061 | 0.005 | 26.1 | SAB(rs)bc | 6.5 | 5.8 | 10.2 | 9.5 | Y | Y | ||||
| MESSIER096 | 0.003 | 16.4 | SAB(rs)ab | 7.6 | 5.2 | 10.1 | 6.0 | Y? | D? | ||||
| MRK0078 | 0.037 | 156.2 | SB | 0.4 | 0.2 | 15.0 | 56.8 | D | |||||
| MRK0477 | 0.038 | 160.2 | S | 0.0 | 0.0 | 17.0 | 58.3 | Y | Y | D | |||
| NGC3362 | 0.028 | 119.1 | SABc | 1.4 | 1.1 | 13.5 | 24.8 | ||||||
| NGC4117 | 0.003 | 16.8 | S00 | 1.8 | 0.9 | 14.0 | 6.1 | ||||||
| NGC7319 | 0.023 | 91.0 | SB(s)bcpec | 1.7 | 1.3 | 14.1 | 33.1 | Y | Y | D | |||
| UGC06100 | 0.030 | 126.2 | Sa? | 0.8 | 0.5 | 14.3 | 26.3 | Y | |||||
| UGC06527 | 0.028 | 119.1 | SA(s)0/apec: | 0.4 | 0.3 | 17.0 | 43.3 | Y? | Y | D | |||
| UGC12348 | 0.025 | 102.0 | Sa | 1.0 | 0.3 | 15.3 | 37.1 | B | |||||
| UM625 | 0.025 | 108.0 | S0 | 0.3 | 0.2 | 17.4 | 22.5 | Y | |||||
| Seyfert 1 | |||||||||||||
| ARP151 | 0.021 | 90.9 | S0pec | 1.3 | 0.2 | 16.8 | 18.9 | Y? | D | ||||
| IC1854 | 0.031 | 126.1 | S0/a | 0.5 | 0.4 | 14.9 | 26.3 | Y | |||||
| MESSIER104 | 0.003 | 18.3 | SA(s)a | 8.7 | 3.5 | 9.0 | 6.7 | Y? | D? | ||||
| NGC0985 | 0.043 | 175.7 | SBbc?p(Ring) | 1.0 | 0.9 | 13.8 | 63.9 | Y | Y | ||||
| NGC4395 | 0.001 | 3.6 | SA(s)m: | 13.2 | 11.0 | 10.6 | 1.3 | ||||||
| NGC5940 | 0.034 | 144.2 | SBab | 0.8 | 0.8 | 14.3 | 30.1 | Y | |||||
| UGC09214 | 0.034 | 146.0 | SBa | 0.9 | 0.6 | 14.5 | 30.4 | Y | Y | ||||
| UGC10120 | 0.031 | 133.0 | SB(r)b | 1.1 | 1.1 | 14.6 | 27.7 | ||||||
References
- Balcells & Peletier (1994) Balcells, M. & Peletier, R. F. 1994, AJ, 107, 135
- Barnes & Hernquist (1991) Barnes, J. E. & Hernquist, L. E. 1991, ApJL, 370, L65
- Binney & Tremaine (1987) Binney, J. & Tremaine, S. 1987, Galactic Dynamics, Princeton, NJ: Princeton University Press
- Böker et al. (1999) Böker, T. et al. 1999, ApJS, 124, 95
- Buta & Combes (1996) Buta, R., & Combes, F. 1996, Fundamentals of Cosmic Physics, 17, 95
- Carter (1978) Carter, D. 1978, MNRAS, 182, 797
- Cid Fernandes et al. (2001) Cid Fernandes, R., Heckman, T., Schmitt, H., González Delgado, R., & Storchi-Bergmann T. 2001, ApJ, 558, 81
- Combes (1994) Combes, F. 1994, in Mass-Transfer Induced Activity in Galaxies, ed. I. Shlosman, Cambridge University Press, Cambridge, 170
- Combes et al. (1990) Combes, F., Debbasch, F., Friedli, D., & Pfenniger, D. 1990, A&A, 233, 82
- Combes & Elmegreen (1993) Combes, F., & Elmegreen, B.G. 1993, A&A, 271, 391
- Combes et al. (2004) Combes, F., et al. 2004, A&A, 414, 857
- de Robertis, Yee, & Hayhoe (1998) de Robertis, M. M., Yee, H. K. C., & Hayhoe, K. 1998, ApJ, 496, 93
- Dultzin-Hacyan et al. (1999) Dultzin-Hacyan, D., Krongold, Y., Fuentes-Guridi, I., & Marziani, P. 1999, ApJL, 513, L11
- Elmegreen et al. (1996) Elmegreen, D. M., Elmegreen, B. G., Chromey, F. R., Hasselbacher, D. A., & Bissell, B. A. 1996, AJ, 111, 1880
- Ferrarese & Merritt (2000) Ferrarese, L. & Merritt, D. 2000, ApJL, 539, L9
- Friedli (1996) Friedli, D. 1996, A&A, 312, 761
- Friedli & Martinet (1993) Friedli, D. & Martinet, L. 1993, A&A, 277, 27
- Friedli et al. (1996) Friedli, D., Wozniak, H., Rieke, M., Martinet, L., & Bratschi, P. 1996, A&AS, 118, 461
- Fuentes-Williams & Stocke (1988) Fuentes-Williams, T. & Stocke, J. T. 1988, AJ, 96, 1235
- Geller & Huchra (1983) Geller, M. J. & Huchra, J. P. 1983, ApJS, 52, 61
- Gebhardt et al. (2000) Gebhardt, K. et al. 2000, ApJL, 539, L13
- González Delgado, Heckman, & Leitherer (2001) González Delgado, R., Heckman, T., & Leitherer, C. 2001, ApJ, 546 845
- Heller & Schlosman (1994) Heller, C.H., & Shlosman, I. 1994, ApJ, 424, 84
- Heller & Shlosman (1996) Heller, C. H. & Shlosman, I. 1996, ApJ, 471, 143
- Hernquist (1989) Hernquist, L. 1989, Nature, 340, 687
- Ho, Filippenko, & Sargent (1997a) Ho, L. C., Filippenko, A. V., & Sargent, W. L. W. 1997, ApJS, 112, 315
- Ho, Filippenko, & Sargent (1997b) Ho, L. C., Filippenko, A. V., & Sargent, W. L. W. 1997, ApJ, 487, 591
- Huchra & Burg (1992) Huchra, J. & Burg, R. 1992, ApJ, 393, 90
- Hunt & Malkan (1999) Hunt, L. K. & Malkan, M. A. 1999, ApJ, 516, 660
- Hunt et al. (1999a) Hunt, L. K., Malkan, M. A., Moriondo, G., & Salvati, M. 1999, ApJ, 510, 637
- Hunt et al. (1999b) Hunt, L. K., Malkan, M. A., Rush, B., Bicay, M. D., Nelson, B. O., Stanga, R. M., & Webb, W. 1999, ApJS, 125, 349
- Jedrzejewski (1987) Jedrzejewski, R. I. 1987, MNRAS, 226, 747
- Jungwiert, Combes, & Axon (1997) Jungwiert, B., Combes, F., & Axon, D. J. 1997, A&AS, 125, 479
- Kauffmann et al. (2003) Kauffmann, G., Heckman, T.M., Tremonti, C. et al. 2003, MNRAS, 346, 1055
- Keel (1980) Keel, W. C. 1980, AJ, 85, 198
- Kenney et al. (1996) Kenney, J. D. P., Koopmann, R. A., Rubin, V. C., & Young, J. S. 1996, AJ, 111, 152
- Knapen et al. (1995) Knapen, J. H., Beckman, J. E., Heller, C. H., Shlosman, I., & de Jong, R. S. 1995, ApJ, 454, 623
- Knapen, Shlosman, & Peletier (2000) Knapen, J. H., Shlosman, I., & Peletier, R. F. 2000, ApJ, 529, 93
- Krongold, Dultzin-Hacyan, & Marziani (2002) Krongold, Y., Dultzin-Hacyan, D., & Marziani, P. 2002, ApJ, 572, 169
- Laine et al. (2002) Laine, S., Shlosman, I., Knapen, J. H., & Peletier, R. F. 2002, ApJ, 567, 97
- Lauberts & Valentijn (1989) Lauberts, A. & Valentijn, E. A. 1989, Garching: European Southern Observatory,
- Levenson et al. (2001) Levenson, N.A., Weaver, K.A., & Heckman, T.M. 2001, ApJ, 550, 230
- Maiolino et al. (1997) Maiolino, R., Ruiz, M., Rieke, G. H., & Papadopoulos, P. 1997, ApJ, 485, 552
- Malkan, Gorjian, & Tam (1998) Malkan, M. A., Gorjian, V., & Tam, R. 1998, ApJS, 117, 25 (MGT)
- Marconi & Hunt (2003) Marconi, A. & Hunt, L. K. 2003, ApJL, 589, L21
- Márquez et al. (2000) Márquez, I. et al. 2000, A&A, 360, 431
- Martini & Pogge (1999) Martini, P. & Pogge, R. W. 1999, AJ, 118, 2646
- Martini et al. (2001) Martini, P., Pogge, R. W., Ravindranath, S., & An, J. H. 2001, ApJ, 562, 139
- Martini et al. (2003a) Martini, P., Regan, M. W., Mulchaey, J. S., & Pogge, R. W. 2003a, ApJS, 146, 353
- Martini et al. (2003b) Martini, P., Regan, M. W., Mulchaey, J. S., & Pogge, R. W. 2003b, ApJ, 589, 774
- Moore & McCabe (1989) Moore, D. S. & McCabe, G. P. 1989, Introduction to the Practice of Statistics, New York: W. M. Freeman & Co.
- McLeod & Rieke (1995) McLeod, K. K. & Rieke, G. H. 1995, ApJ, 441, 96
- Merritt & Hernquist (1991) Merritt, D. & Hernquist, L. 1991, ApJ, 376, 439
- Miller et al. (2003) Miller, C. J., Nichol, R. C., Gómez, P. L., Hopkins, A. M., & Bernardi, M. 2003, ApJ, 597, 142
- Moles, Marquez, & Perez (1995) Moles, M., Marquez, I., & Perez, E. 1995, ApJ, 438, 604
- Mulchaey & Regan (1997) Mulchaey, J. S. & Regan, M. W. 1997, ApJl, 482, L135
- Naab, Burkert, & Hernquist (1999) Naab, T., Burkert, A., & Hernquist, L. 1999, ApJL, 523, L133
- Nilson (1973) Nilson, P. 1973, Acta Universitatis Upsaliensis. Nova Acta Regiae Societatis Scientiarum Upsaliensis - Uppsala Astronomiska Observatoriums Annaler, Uppsala:Astronomiska Observatorium
- Peletier et al. (1990) Peletier, R. F., Davies, R. L., Illingworth, G. D., Davis, L. E., & Cawson, M. 1990, AJ, 100, 1091
- Patsis et al. (2002) Patsis, P. A., Athanassoula, E., Grosbøl, P., & Skokos, C. 2002, MNRAS, 335, 1049
- Pfenniger & Friedli (1991) Pfenniger, D. & Friedli, D. 1991, A&A, 252, 75
- Pogge & Martini (2002) Pogge, R. W. & Martini, P. 2002, ApJ, 569, 624
- Quillen et al. (2001) Quillen, A. C., McDonald, C., Alonso-Herrero, A., Lee, A., Shaked, S., Rieke, M. J., & Rieke, G. H. 2001, ApJ, 547, 129
- Raimann et al. (2003) Raimann, D., Storchi-Bergmann, T., González Delgado, R. M., Cid Fernandes, R., Heckman, T., Leitherer, C., & Schmitt, H. 2003, MNRAS, 339, 772
- Ravindranath et al. (2001) Ravindranath, S., Ho, L. C., Peng, C. Y., Filippenko, A. V., & Sargent, W. L. W. 2001, AJ, 122, 653
- Regan & Elmegreen (1997) Regan, M. W. & Elmegreen, D. M. 1997, AJ, 114, 965
- Regan & Mulchaey (1999) Regan, M. W. & Mulchaey, J. S. 1999, AJ, 117, 2676
- Regan & Teuben (2003) Regan, M. W. & Teuben, P. 2003, ApJ, 582, 723
- Sakai et al. (1997) Sakai, S., Madore, B. F., Freedman, W. L., Lauer, T. R., Ajhar, E. A., & Baum, W. A. 1997, ApJ, 478, 49
- Schmitt et al. (2001) Schmitt, H. R., Antonucci, R. R. J., Ulvestad, J. S., Kinney, A. L., Clarke, C. J., & Pringle, J. E. 2001, ApJ, 555, 663
- Schmitt, Storchi-Bergmann, & Cid Fernandes (1999) Schmitt, H., Storchi-Bergmann, T., & Cid Fernandes, R. 1999, MNRAS, 303, 173
- Shaw et al. (1995) Shaw, M., Axon, D., Probst, R., & Gatley, I. 1995, MNRAS, 274, 369
- Shaw et al. (1993) Shaw, M. A., Combes, F., Axon, D. J., & Wright, G. S. 1993, A&A, 273, 31
- Shlosman, Frank, & Begelman (1989) Shlosman, I., Frank, J., & Begelman, M. C. 1989, Nature, 338, 45
- Shlosman, Peletier, & Knapen (2000) Shlosman, I., Peletier, R. F., & Knapen, J. H. 2000, ApJ, 535, L83
- Sparks et al. (1985) Sparks, W. B., Wall, J. V., Thorne, D. J., Jorden, P. R., van Breda, I. G., Rudd, P. J., & Jorgensen, H. E. 1985, MNRAS, 217, 87
- Storchi-Bergmann et al. (2001) Storchi-Bergmann, T., González Delgado, R.M., Schmitt, H.R., Cid Fernandes, R., Heckman, T. 2001, ApJ, 559, 147
- Tremaine et al. (2002) Tremaine, S. et al. 2002, ApJ, 574, 740
- Tully (1994) Tully, R. B. 1994, VizieR Online Data Catalog, VII/45 (originally published by Cambridge University Press, 1988)
- Veron-Cetty & Veron (1993) Veron-Cetty, M.-P. & Veron, P. 1993, A Catalogue of Quasars and Active Nuclei, ESO Scientific Report, Garching: European Southern Observatory (ESO), 6th ed.
- Wozniak et al. (1995) Wozniak, H., Friedli, D., Martinet, L., Martin, P., & Bratschi, P. 1995, A&AS, 111, 115