The Nature of LyBlobs: Supernova-Dominated Primordial Galaxies
Abstract
We consider a forming galaxy undergoing multitudinous supernova (SN) explosions, as a possible model of Lyblobs (LABs). For this purpose, an ultra–high resolution hydrodynamic simulation is performed using grid points, where SN remnants are resolved with sufficient accuracy. It is found that multiple SN explosions produce kpc–size expanding hot bubbles, which drive cool, dense shells by strong shock. The colliding high–density cooling shells radiate intensive Lyemission, resulting in a high Lyluminosity of erg s-1, comparable to the observed level in LABs. Also, recently discovered bubbly features in some LABs are quite similar to the structure predicted in the present simulation. Furthermore, the result demonstrates that LABs are representative of evolving primordial galaxies; they could hold direct information on the early chemical enrichment of galaxies, contrary to present–day galaxies which have undergone intense recycling of interstellar matter, thus erasing most of the early chemical history. It turns out that the metal mixing proceeds in a very inhomogeneous fashion, so that there appears a large spread of metallicity, that is, or . Hence, the early galactic chemical evolution may have proceeded in a different manner from that hitherto considered in one–zone models.
Accepted for publication in ApJL
1 Introduction
Lyblobs (LABs) are a new category of high redshift galaxies, which have been recently discovered. Steidel et al. (2000) found two bright Lyblobs (Blob 1 and Blob 2) in the SSA22 field, which have sizes of kpc and Lyluminosities of erg s-1 at . These LABs are associated with previously known Lyman–break galaxies (LBGs) at redshift . Compared to typical Lyemitters found at high redshifts (Dey et al. 1998; Weyman et al. 1998; Rhoads et al. 2000; Hu et al. 2002; Ajiki et al. 2002; Dawson et al. 2002; Fujita et al. 2003; Kodaira et al. 2003; Matsuda et al. 2004), LABs are more luminous and much more extended. LABs resemble the giant Lynebulae associated with high–redshift radio galaxies, although the associated radio continuum flux is less than 1%. Recently, Matsuda et al. (2004) have found 35 candidates for LABs in the SSA22 field. One third of them are apparently not associated with UV continuum sources that are bright enough to produce Lyemission. Therefore, the origin of LABs is mysterious.
So far, three possibilities have been proposed as models for LABs. The first is heavily–obscured UV sources like an active galactic nucleus (AGN) or starburst (Steidel et al. 2000; Chapman et al. 2004). Chapman et al. (2004) argue that the multiwavelength observations of Blob 1 is at least consistent with a dust–enshrouded AGN surrounded by a starburst. The second is a cooling radiation model (Haiman, Spaans, & Quataert 2000; Fardal et al. 2001). In a bottom–up scenario of galaxy formation, a large number of subgalactic halos are expected to collapse at high redshifts and they can emit significant Lyfluxes through collisional excitation of hydrogen. Thus, the cooling radiation from proto–galaxies have been advocated to be a possible mechanism for observed Lyemission of LABs. The last is a superwind model (Taniguchi & Shioya 2000; Ohyama et al. 2003). Taniguchi & Shioya (2000) have argued that a large–scale bipolar outflow driven by the starburst in a forming galaxy can be responsible for the intensive Lyemission of LABs.
The deep optical spectroscopy of LABs suggests that the kinematical properties of LABs favor supernova (SN) driven winds (Ohyama et al. 2003). Interestingly, Matsuda et al. (2004) have recently revealed bubbly features in Blobs 1 and 2, where the bubble size is typically kpc. The bubbly structures strongly suggest that SN events could be closely related to LABs. Therefore, complexes of various superbubbles, which can be driven by multiple SNe, are an attractive explanation for LABs. However, it has not been shown whether multiple SN explosions can actually produce the observed LAB emission. In this Letter, we attempt to build up a multiple SN explosion model for LABs. For the purpose, we perform an ultra–high resolution ( grids) simulation on the SN explosions in inhomogeneous and multiphase interstellar matter (ISM), where individual SN remnants are resolved. The results of this chemodynamical simulation, incorporating spectro–photometric modeling (see Mori et al. 1997 and Mori, Yoshii & Nomoto 1999), can be directly compared to the observations on Lyblobs. In §2, the numerical model is described. In §3, we present the numerical results and in §4 the early chemical evolution of the system is discussed.
2 Model
We define a fiducial model for a Lyblob at redshift , in which the total mass of gaseous matter is initially assumed to be , and the total mass including dark matter halo is . The baryonic matter to dark matter halo has been increased by a factor with respect to the cosmological value111Throughout this paper we assume a CDM cosmology with , , a Hubble constant of km s-1 Mpc and ., to account for possible bias effects in rapidly cooling regions. According to the general picture of bottom–up scenarios for galaxy formation, we model a protogalaxy as an assemblage of numerous subgalactic condensations building up the total mass of a galaxy. As for the surface density profiles of the Lyblobs, the galaxy as a whole is modelled as a pre–virialized system with a spherically–averaged density profile in a radius of 106 kpc, where is a NFW density profile, (Navarro, Frenk & White 1997). Subgalactic condensations having a zero velocity are then distributed to such a profile by Monte–Carlo realization. These are taken as already virialized systems with a NFW density profile encompassing a mass of in a virial radius kpc.
The star formation rate (SFR) is assumed to be proportional to the total gas mass. The SFR integrated over the whole system is with the time scale . Because of the short timescale of our simulation, the SFR is essentially constant which is inferred from observations of bright LBGs at (Shapley et al. 2001). Thus, the ambiguity of has little serious problem. The mass of individual stars and the formation epoch are determined by randomly sampling both and the initial mass function (IMF), which is assumed to be of Salpeter type with upper and lower mass cutoffs of and , respectively. The newly born stars are distributed in proportion to the gas density using a Monte-Carlo procedure. A star more massive than is assumed, after the main sequence lifetime, to undergo a Type II SN explosion, releasing a total energy of erg. A mass of of oxygen and of of iron are ejected from a Type II SN explosion (Tsujimoto et al. 1995). In the present simulation, a total of SN explosions occur in the whole galaxy; we focus on the first 50 Myr of the chemodynamical evolution of the system.
The gas dynamics is solved in three–dimensional space with Cartesian grids. Here, we employ the AUSM–DV scheme (Wada & Liou 1994), which is a TVD scheme that can resolve the shock accurately. The spatial resolution is 195 pc and the simulation box has a (physical) size of 212 kpc. The ejected energy and well-mixed metals by SN are supplied to 8 local cells surrounding SN region. Then, the hydrodynamic evolution of metals is followed by the same algorithm as the gas density. Since the time variation of dark matter halo potential is insignificant in the early stage of galaxy evolution, we assume the gravitational potential to be constant in time. Also, the gas is assumed to be optically thin and in collisional–ionization equilibrium. Radiative cooling is included self–consistently with matallicity, using the metallicity–dependent cooling curves by Sutherland & Dopita (1993). The set of basic equations are numerically solved by a parallel version of the Astrophysical Fluid Dynamics (AFD2) scheme (see Mori, Ferrara & Madau 2002).
3 Results
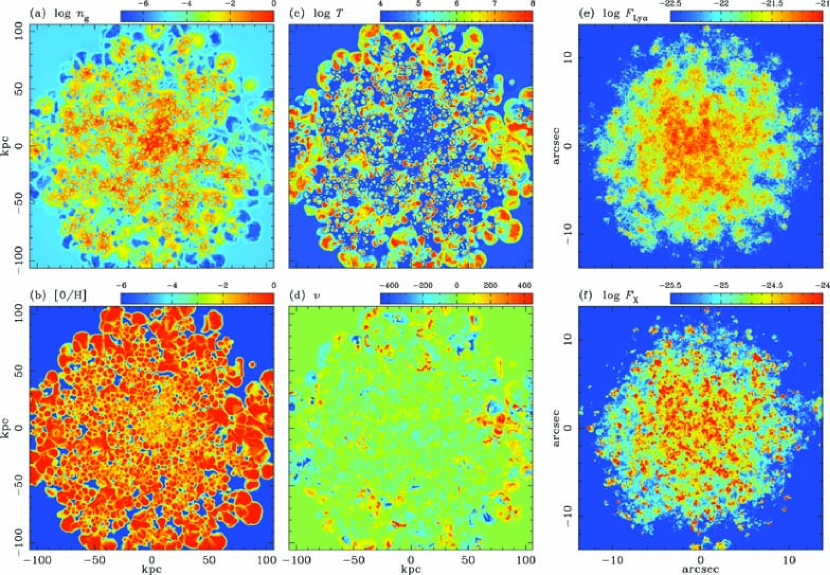
Figure 1 shows the numerical results at 50 Myr. Figures 1a and 1c show the density and temperature distributions in a slice along the plane, respectively. After the first massive stars explode, the gas temperature is raised up to about K locally, and expanding hot bubbles of kpc are produced. Then, the strong shock drives cooled, dense shells enclosing hot bubbles. Subsequent SN explosions further accelerate the expansion of hot bubbles and the ambient gas is continuously swept up by the dense shells; the gas density in shells increases further owing to the enhanced cooling. Since the density of ISM is low in outer regions, the bubble expansion is faster there and SN–driven shock waves quickly collide with each other to generate larger bubbles of 10kpc, which are surrounded by high–density ( cm-3), cool ( K) shells.
We compute the emission properties of the galaxy assuming an optically thin gas in collisional ionization equilibrium and using the MAPPINGS III code by Sutherland & Dopita (1993). Ly extinction due to dust seems negligible. For the average gas column density, cm-2, and metallicity in the simulation (shown below), we have . Then, using equation (20) of Pei (1992) and , we find . Figures 1e and 1f show the projected distribution of the resultant Lyemission and X–ray emission in the 0.2–2 keV band (0.8–8 keV at ), where one arcsec corresponds to 8kpc. It is worth noting that small bubbles with a few kpc are smeared out in the surface brightness of Lyemission and bubbly features of kpc are prominent in outer regions. Such features are quite similar to the bubbly structures observed in Blobs 1 and 2 (Matsuda et al 2004). The total flux of Lyemission is erg s-1 cm-2 and the corresponding luminosity is erg s-1, which comes mainly from high–density cooling shells. This Ly luminosity is also comparable to erg s-1 of Blobs 1 and 2. These results suggest that LABs could be an early phase of chemical evolution in a protogalaxy. The total flux of X–ray emission is erg s-1 cm-2 and the corresponding luminosity is erg s-1. This is within the constraint of the X–ray luminosity from Chandra X–ray observation for Blob 1, erg s-1 (Chapman et al. 2004).
The line–of–sight velocity distribution is also shown in Figure 1d. Since gas in outer regions has a velocity higher than 500 km s-1, which exceeds the escape velocity of this galaxy (472 km s-1), it may escape from the galaxy potential well, while in inner regions gas velocity is lower than the escape velocity, and therefore gas is confined within the gravitational potential. If the total mass of galaxy is lower, winds will be more effective (Mori, Yoshii & Nomoto 1999; Ferrara, Pettini & Shchekinov 2000), and provide an efficient mechanism to distribute heavy elements over cosmological volumes (Mori, Ferrara & Madau 2002). In the future, the more detailed bubbly structure seen in Figures 1e may be directly detected by high resolution observations ( arcsec), of redshifted Hα emission ( erg s-1), with the James Webb Space Telescope.
4 Discussion
As shown in the previous section, LABs could correspond to a quite early phase of galaxy chemical evolution. In this case, the observed bubbly features imply that the self–enrichment is on–going in a very inhomogeneous fashion in LABs. Actually, in the present simulation, the distribution of metallicity is very inhomogeneous as shown in Figure 1c, where the predicted oxygen abundance [O/H] is shown. The gas in the vicinity of SNe is polluted with newly synthesized heavy elements ejected from SNe, but a large amount of the gas still retains of low metallicity. The interactions of expanding hot bubbles give rise to a complex structure in the inner regions, where a metal–rich gas coexists with an almost primordial gas. They are separated from each other by cool shells. Interestingly, the outer regions tend to have higher metallicity compared with inner regions. This is because the metal enriched super–bubbles are less diluted with metal–deficient gas in the outer low–density regions.
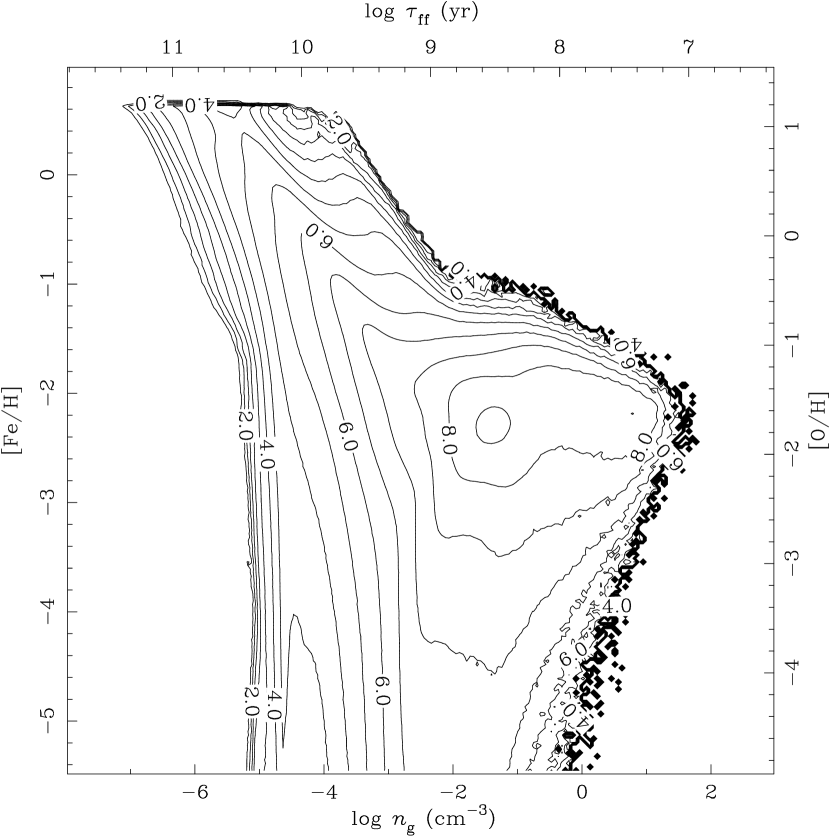
Figure 2 shows the relation between density and metallicity, where the abundance is represented by [Fe/H] as well as [O/H] and the contours denote the mass level. This figure clearly shows that the mixing of heavy elements proceeds incompletely in an very inhomogeneous manner. The gas with higher metallicity of () is distributed only in low density regions of , which corresponds to hot super–bubbles. On the other hand, a part of the SN ejecta mix with the dense regions with primordial abundance (either shells or overdensities around subgalactic condensations) and tend to be diluted to lower metallicity of (). Note that considerable dispersion of metallicity () is found in high density regions of . This spread of metallicity hardly depends upon the numerical resolution as long as hot bubbles are fully resolved in the simulation. Hence, the next generation of stars which are expected to form out of the high–density regions should exhibit a similar dispersion of metallicity.
So far, the theoretical models of galactic chemical evolution have often assumed the homogeneous ISM (one–zone model), with the instantaneous and perfect mixing of heavy elements synthesized in SNe. On the contrary, the present simulations show that the metal mixing proceeds in a very inhomogeneous fashion. This means that one should carefully treat the metal mixing for the study of chemical evolution of galaxies.
The volume–averaged metallicity of the gas in the present simulation is found to be , while the density–weighted metallicity is . On the other hand, if one derives the mean metallicity based on X–ray flux, is found, which is about forty times higher than the volume–averaged one. This is because X–ray is mainly emitted from the metal–rich gas in the hot bubbles. The density–weighted metallicity is well above a so–called critical metallicity, (Omukai 2000; Bromm et al. 2001; Schneider et al. 2002) marking the transition from a top–heavy IMF to a normal (i.e. Salpeter) IMF. Thus, the next stellar generation will form with an IMF similar to the present–day one, with the low–mass stars possibly forming the metal–poor halo population (McWilliam et al. 1995; Ryan, Norris & Beers 1996). In addition, it is worth noting the existence of very low metallicity (), high density ( cm-3) regions. Since the abundance of these regions can be below the critical metallicity, the IMF could be similar to that of Pop III stars (e.g. Nakamura & Umemura 2001). Recently, an extremely metal–poor star () is discovered by Christlieb et al. (2002) may be a relic of such stars. It should be kept in mind, however, that the model galaxy is constructed from primordial gas in this paper. At redshift , Lyabsorption lines in quasar spectra show that at least some fraction of the IGM is polluted to . If a galaxy forms from a well–mixed pre–enriched medium, the metallicity would be accordingly shifted to higher values, hence precluding the formation of extremely metal–poor stars.
5 Conclusions
We have suggested that LABs can be identified with primordial galaxies catched in a supernova-dominated phase. This conclusion is based on ultra–high resolution hydrodynamic calculations which resolve individual SN remnants. As a result, we found that the resultant Lyluminosity can account for the observed luminosity of LABs; in addition, the bubbly structures produced by multiple SN explosions are quite similar to the observed features in Lysurface brightness of LABs. Hence the emerging theoretical picture is fully consistent with experimental data. If this picture is correct, bubbly features may show that the metal mixing is highly inhomogeneous in LABs. The present simulation predicts a quite wide range of metallicity for the next generation of stars. This may affect the galaxy evolution significantly.
References
- (1) Ajiki, M. et al. 2002, ApJ, 576, L25
- (2) Bromm, V., Ferrara, A., Coppi, P. S., & Larson, R. B. 2001, MNRAS, 328, 969
- (3) Chapman, S. C., Scott, D., Windhorst, R. A., Frayer, D. T., Borys, C., Lewis, G. F., & Ivison, R. J. 2004, ApJ, 606, 85
- (4) Christlieb, N. et al. 2002, Nature, 419, 904
- (5) Dawson, S., Spinrad, H., Stern, D., Dey, A., van Breugel, W., de Vries, W., & Reuland, M. 2002, ApJ, 570, 92
- (6) Dey, A., Spinrad, H., Stern, D., Graham, J. R., & Chaffee, F. H. 1998, ApJ, 498, L93
- (7) Fardal, M. A., Katz, N., Gardner, J. P., Hernquist, L., Weinberg, D. H., & Davé, R. 2001, ApJ, 562, 605
- (8) Ferrara, A., Pettini, M., & Shchekinov, Y. 2000, MNRAS, 319, 539
- (9) Fujita, S. S. et al. 2003, AJ, 125, 13
- (10) Haiman, Z., Spaans, M., & Quataert, E. 2000, ApJ, 537, L5
- (11) Hu, E. M., Cowie, L. L., McMahon, R. G., Capak, P., Iwamuro, F., Kneib, J.–P., Maihara, T., & Motohara, K. 2002, ApJ, 568, L75
- (12) Kodaira, K. et al. 2003, PASJ, 55, L17
- (13) Matsuda, Y., et al. 2004, AJ, 128, 569
- (14) McWilliam, A., Preston, G. W., Sneden, C., & Searle, L. 1995, AJ, 109, 2757
- (15) Mori, M., Ferrara, A., & Madau, P. 2002, ApJ, 571, 40
- (16) Mori, M., Yoshii, Y., & Nomoto, K. 1999, ApJ, 511, 585
- (17) Mori, M., Yoshii, Y., Tsujimoto, T., & Nomoto, K. 1997, ApJ, 478, L21
- (18) Nakamura, F. & Umemura, M. 2001, ApJ, 548, 19
- (19) Navarro, J. F., Frenk, C. S., & White, S. D. M. 1997, ApJ, 490, 493
- (20) Ohyama et al. 2003, ApJ, 591, L90.
- (21) Omukai, K. 2000, ApJ, 534, 809
- (22) Pei, Y. C. 1992, ApJ, 395, 130
- (23) Rhoads, J. E., Malhotra, S., Dey, A., Stern, D., Spinrad, H., & Jannuzi, B. T. 2000, ApJ, 545, 85
- (24) Ryan, S. G., Norris, J. E., & Beers, T. C. 1996, ApJ, 471, 254
- (25) Schneider, R., Ferrara, A., Natarajan, P., & Omukai, K. 2002, ApJ, 571, 30
- (26) Shapley, A. E., Steidel, C. C., Adelberger, K. L., Dickinson, M., Giavalisco, M., & Pettini, M. 2001, ApJ, 562, 95
- (27) Steidel, C. C., Adelberger, K. L., Shapley, A. E., Pettini, M., Dickinson, M., & Giavalisco, M. 2000, ApJ, 532, 170
- (28) Sutherland, R. S. & Dopita, M. A. 1993, ApJS, 88, 253
- (29) Taniguchi, Y. & Shioya, Y. 2000, ApJ, 532, L13
- (30) Tsujimoto, T., Nomoto, K., Yoshii, Y., Hoshimoto, M., Yanagida, S., & Thielemann F.–K. 1995, MNRAS, 277, 945
- (31) Wada, Y. & Liou, M. S. 1994, AIAA Paper, 94–0083
- (32) Weymann, R. J., Stern, D., Bunker, A., Spinrad, H., Chaffee, F. H., Thompson, R. I., & Storrie–Lombardi, L. J. 1998, ApJ, 505, L95