Ultraviolet Extinction Properties in the Milky Way
Abstract
We have assembled a homogeneous database of 417 ultraviolet (UV) extinction curves for reddened sightlines having International Ultraviolet Explorer (IUE) spectra. We have combined these with optical and 2MASS photometry allowing estimates of the ratio of total-to-selective extinction, RV, for the entire sample. Fitzpatrick-Massa (FM) parameters have also been found for the entire sample. This is the largest study of parameterized UV extinction curves yet published and it covers a wide range of environments, from dense molecular clouds to the diffuse interstellar medium (ISM), with extinctions AV ranging from 0.50 to 4.80. It is the first to extend far beyond the solar neighborhood and into the Galaxy at large, with 30 sightlines having distances 5 kpc. Previously, the longest sightlines with FM parameters and RV extended 1 kpc. We find that (1.) the CCM extinction law applies for 93% of the sightlines, implying that dust processing in the Galaxy is efficient and systematic; (2.) the central wavelength of the 2175 Å bump is constant; (3.) the 2175 Å bump width is dependent on environment. Only four sightlines show systematic deviations from CCM, HD 29647, 62542, 204827, and 210121. These sightlines all sample dense, molecule-rich clouds. The new extinction curves and values of RV allow us to revise the CCM law.
1 Introduction
Astronomical ultraviolet studies were not possible before the advent of rocket-borne instruments and satellites due to atmospheric absorption and Rayleigh scattering. The first satellite capable of UV observations, OAO-2, was launched in 1968, and was followed by a host of other satellites (Cox 2000), including Thor Delta-1 (TD-1), Astronomy Netherlands Satellite (ANS), and IUE, among others. The data obtained by these instruments are responsible for the vast majority of contributions to studies of interstellar dust, as dust grains preferentially extinguish short-wavelength light. By comparing heavily extinguished stars against their intrinsic fluxes (the pair method), we can better understand grain properties and composition. This is important for two reasons. First, solid knowledge of grain properties will allow us to build more realistic grain models and correct for the effects of dust in stellar and galactic photometry and spectra more accurately. Second, dust grains are extremely sensitive to their environment, and can yield much information about local conditions and the physical and chemical processes which affect grains.
The pair method, first used by Bless & Savage 1970, has since been used by many others to make extinction curves and study the ISM in the Milky Way (e.g., York et al. 1973; Nandy et al. 1975, 1976; Koorneef 1978; Seaton 1979; Snow & Seab 1980; Kester 1981; Meyer & Savage 1981; Aiello et al. 1982; Massa, Savage & Fitzpatrick 1983; Massa & Savage 1984; Savage et al. 1985; Fitzpatrick & Massa 1986, 1988, 1990, hereafter FM86, FM88, FM90; Clayton & Fitzpatrick 1987; Aiello et al. 1988; Cardelli et al. 1988, 1989, hereafter CCM; Papaj, Krelowski, & Wegner 1991; Papaj & Krelowski 1992, and Jenniskens & Greenberg 1993, hereafter JG93) as well as in other galaxies (Borgman et al. 1975; Nandy et al. 1981; Koorneef & Code 1981; Clayton & Martin 1985; Fitzpatrick 1985, 1986; Clayton et al. 1996; Bianchi et al. 1996; Gordon & Clayton 1998; Misselt et al. 1999; Gordon et al. 2003).
There are significant differences between dust grain properties in the Galaxy and those found in the Small and Large Magellanic Clouds (SMC and LMC, respectively). The SMC Bar has very strong, linear FUV extinction, while the sightlines toward the LMC2 Supershell and the average LMC curve have a weaker bump and stronger FUV extinction than the average Galactic RV=3.1 curve. There are also significant differences in metallicities and the gas-to-dust ratios between the Galaxy, LMC, and SMC (Bohlin et al. 1978; Gordon et al. 2003; Luck & Lambert 1992).
A major leap forward in understanding interstellar extinction occurred in 1989, when CCM suggested a mean extinction relation that depended on one parameter, the ratio of total-to-selective extinction, RV (=AV/E(B-V)). With only very few exceptions, Galactic extinction curves tend to follow this law within the uncertainties of the calculated RV values and the extinction curves (Fitzpatrick 1999; Clayton et al. 2000). The Galactic diffuse ISM is well described by a curve where RV = 3.1. RV can also be thought of as a rough indicator of grain size, with low RV sightlines having more small grains than high RV sightlines. The CCM extinction relation generally does not apply outside the Galaxy, although recent work has shown that there are sightlines toward the LMC which may follow CCM (Gordon et al. 2003). This law essentially replaced the Galactic average extinction curve (Seaton 1979) with a family of RV-dependent extinction curves, with each curve representing a mean curve for sightlines of that particular value of RV. This also showed that many of the so-called “anomalous” sightlines (e.g. Clayton & Fitzpatrick 1987) were in fact normal. In addition to finding this relationship, CCM pointed out the usefulness of normalizing extinction curves to AV, rather than E(B-V), as was usually done. Compared to E(B-V), AV is a more basic quantity, and it is a direct measure of optical depth along a line of sight. Galactic extinction curves can be fit with six parameters (Fitzpatrick & Massa 1990) which allow for quantitative analysis of extinction characteristics.
Despite all the work with extinction curves that has been done, a homogeneous database of Milky Way extinction curves does not exist. The many previous studies, listed above, used data from different instruments, and variations of the pair method to construct extinction curves. So, the results of these studies cannot be compared easily. Also, these sightlines make up only about half of reddened sightlines available in the IUE Archive. To illustrate the disparateness of previous works, Table 1 compares various aspects of previous studies to the present work. Column (1) lists authorship, (2) lists the number of sightlines, (3) lists the instrument the data was from, (4) shows if FM parameters were found, (5) shows whether the extinction curves were constructed using the MK classification or UV stellar features, and (6) shows if IR photometry, specifically RV, was considered for the entire sample.
In order to solve this problem, we have built a homogeneous database of over four hundred extinction curves constructed in a uniform manner. Over 150 of these sightlines extend beyond 2 kpc, and 30 extend beyond 5 kpc, thus sampling a much larger volume of the Galaxy than ever before. This is a much larger and more complete database than any done previously. Until the recent release of the 2MASS database, JHK photometry was available for only a small fraction of the stars in the sample. Now, estimates of RV are available for the entire sample. Thus, it is now possible to draw a more coherent picture of extinction in the Galaxy. In the following sections, we describe our database of extinction properties, present the results of our analyses, and discuss the implications for dust grains.
2 UV Data and Extinction Curves
For the sake of homogeneity, Hiltner’s UBV photometry (Hiltner 1956; Hiltner & Johnson 1956) was preferred, when possible, and was obtained for 192 sightlines. In his massive compilation and assessment, Nicolet (1978) found that Hiltner’s photometry was consistently of high quality. Systematic errors were typically less than 0.01 mag (Hiltner 1956) and photometry agreed well with the works of others (Nicolet 1978). Photometry in the JHK bands was available for all the stars in the sample from the 2MASS database (Cutri et al. 2003).
Reddened stars, observed by IUE, having spectral types O3 to B5 were selected for the database. An exception is HD 29647, a B8 III star, included because it has been well studied in the past (e.g., Cardelli & Savage 1988). This range of spectral types was chosen to minimize the effects of spectral mismatch in their extinction curves (Massa et al. 1983). Thorough discussions of the uncertainties in the pair method can be found in Massa et al. (1983), Savage et al. (1985), Aiello et al. (1988), and Gordon & Clayton (1998). Only “normal” stars were included which had good unreddened UV comparison stars. The lower limit on E(B-V) was 0.20.
IUE spectra for all of the stars in the sample were obtained from the Multimission Archive at Space Telescope (MAST). The archive spectra were reduced using NEWSIPS and then recalibrated using the method developed by Massa & Fitzpatrick (2000). The signal-to-noise of the NEWSIPS IUE spectra have been improved by 10-50% over those of IUESIPS IUE spectra (Nichols & Linsky 1996). Low dispersion LWR/LWP and SWP spectra were selected, from either aperture. Multiple spectra from one camera were averaged and then the long and short-wavelength segments were merged at the shortest wavelength of the SWP. The wavelength coverage is 1200 – 3200 Å with a resolution of 5 Å.
The standard pair method, in which a reddened star is compared with an unreddened one of the same spectral type, was used to construct each sightline’s extinction curve (Massa et al. 1983). The comparison stars were selected from Cardelli, Sembach, & Mathis (1992) and dereddened. The spectral matches were made on the basis of comparing the UV spectra of pairs of stars rather than matching their visible spectral types. RV was estimated from the JHK colors as described in Fitzpatrick (1999). AV was found using RV and E(B-V). In general, our UV spectral classifications are in good agreement with those which have been published previously (e.g., Aiello et al. 1988; Clayton & Fitzpatrick 1987; Papaj et al. 1991). Photometry, sources, MK and UV spectral types, reddenings, and calculated RV values for all sightlines can be found in Tables 2, 3, and 4.
The resulting extinction curves were fit with the Fitzpatrick-Massa (FM) parameterization (Fitzpatrick & Massa 1990) and then normalized to AV. Setting , the FM fitting function is given by
| (1) |
where
| (2) |
and for m-1,
| (3) |
while for m-1.
Eqn. 1 results in 6 parameters, c1, c2, c3, c4, x0, and , each of which describe different attributes of the curves. The first two, c1 and c2, account for the intercept and slope of the linear background. They are not independent of each other and can be merged into one parameter (Carnochan 1986, FM88), though that is not done here. The quantities c3 and c4 correspond to the strength of the bump and the curvature of the FUV rise. The last two parameters, and , correspond to the central wavenumber and width of the bump, respectively; does not vary greatly from sightline to sightline, so it may be possible to reduce the number of parameters to four overall (Fitzpatrick 1999). As can be seen in Eqns. 2 and 3, the bump is fit by a Drude profile and the FUV extinction is fit by a nonlinear function. The parameters were found using the three-step method of Gordon et al. (2003), over the wavelength range 2700 – 1250 Å. The FM fit is not reliable longward of 2700 Å (E. Fitzpatrick 2002, private communication). The spectra are cut at the blue end at 1250 Å in order to exclude the Ly feature at 1215 Å. The normalization of the FM parameters was converted from E(B-V) to AV (JG93):
so that the FM parameters become
The resulting normalized FM parameters are listed in Table 5. The dust environment was assessed by considering the traditional density measure, ; JG93 found that sightlines passing through dense regions had 0.9 mag kpc-1, while more diffuse sightlines had 0.9 mag kpc-1. We have adopted this criterion for this study. This parameter can be inaccurate since the density is averaged over the entire sightline (JG93). Other groups have noted that trends in extinction characteristics, especially those associated with the bump, can be linked to environmental influences (FM86; Cardelli & Clayton 1991; JG93).
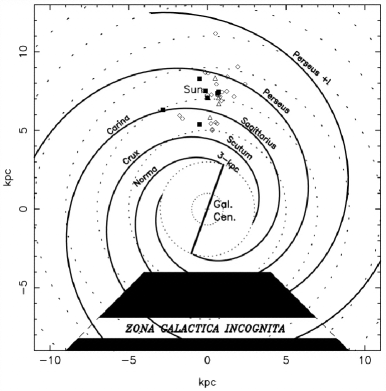
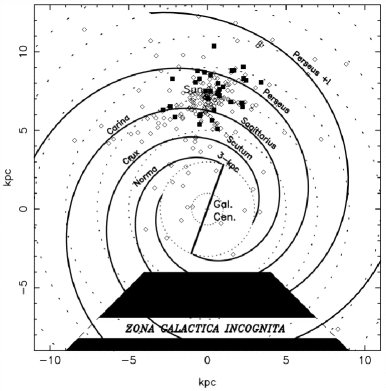
Figure 1 shows the distribution of previously published sightlines in the Galaxy with FM parameters normalized to E(B-V) and the sightlines in this new database. Because of our much larger sample, we have more complete coverage of nearby associations and more distant sightlines than previous works, pushing out further into the Galaxy, and sampling a wider variety of environments. As distances were estimated using spectroscopic parallaxes, the uncertainties for stars plotted in Fig. 1 are large, with an average uncertainty of 50%.
3 Discussion
3.1 Continuum Extinction
The relationship between the various FM parameters were investigated as well as their dependence on RV-1. These are shown in Figs. 2-8. For pairs of parameters with significant correlations, best-fit lines are plotted, using the least absolute deviation method as this is less affected by outliers than minimization.
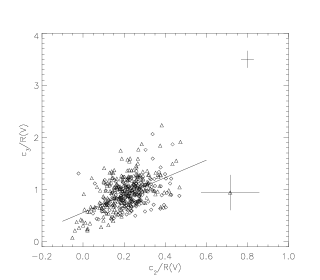
There is a clear correlation between c1/RV + 1.0 and c2/RV (see Table 6 and Fig. 2). This has been noted before (Carnochan 1986; FM86; JG93). According to FM88, c1 = -3.00 c2 + 2.04, while JG93 find that c1 = (-3.110.11) c2 + (2.140.07). This relation shows how tightly constrained the linear component of the extinction is with respect to (FM88). There is also a weak correlation between c2/RV and c3/RV. Neither JG93 nor FM88 found any apparent relationships between the parameters c2 and c3. Similarly, no correlation was found in our sample between these parameters. A comparison of the parameters found in this study and those of JG93 and FM88 are shown in Fig. 3. The values of c2 and c3 from the other groups have been divided by the values of RV found in this work, and the best-fit line in the lower panel was found by considering points from both studies. It was similar to that found here: c3/RV = 1.77 c2/RV + 0.67, versus c3/RV = 1.75 c2/RV + 0.54. As both c2/RV and c3/RV increase with RV-1, and thus are influenced by similar environmental effects, perhaps it is not surprising that they themselves are correlated with each other.
The parameters c4/RV and c2/RV do not show a correlation; neither do the parameters c2/RV and . These agree with the findings of FM88 and JG93. There is also no correlation (=0.13) between c4/RV and . This is in disagreement with the findings of Carnochan (1986), FM88 and JG93, the latter of whom found a correlation coefficient = 0.33 for these parameters. These groups suggested that wider bumps tended to be found along sightlines with steep FUV rises, though this correlation was weak. In the present sample, there was no correlation, regardless of whether the parameter c4 was normalized to E(B-V) or AV. This reinforces the idea that factors influencing the bump width are distinct from those influencing the carrier of the FUV rise (FM88).
Correlations between c2, c3, c4, and RV-1, noted by CCM, are confirmed here, as is the absence of a correlation between x0 and RV-1. Also, while shows real variation, it does not appear to be linked with RV-1. These can be seen in Fig. 4.
3.2 The 2175 Å Bump
As the 2175 Å bump is the only spectral feature yet known in the UV, parameters which describe it were carefully considered. In Fig. 5, a relationship between c3/RV and , very similar to the well-known relationship between c3 and , can be seen. The values of c3/RV are more confined at lower , but as increases, c3/RV widens its range, with a general trend to increase with . This was noted by both FM88 and JG93 in their studies of c3 and ; JG93 attributed it to the fitting procedure, but FM88 suggested that these two parameters are truly related in some way.
The width of the bump shows real variation and environmental dependence. Values for ranged from 0.630.03 m-1 (HD 24263) to 1.470.05 m-1 (HD 29647). This is a wider range than that reported by FM86 ( =0.770.09 - 1.250.07 m-1), perhaps reflecting the larger volume of the Galaxy and wider range of environments covered by this study. The average value in our sample is 0.920.12 m-1. HD 29647 and HD 62542 have the broadest bumps, with =1.4670.049 m-1 and m-1, respectively. The average for dense and diffuse sightlines as defined above do not differ significantly, as = 0.95 0.04 m-1 and = 0.87 0.03 m-1. This likely reflects the density parameter’s inability to sort out high versus low densities over long distances, as discussed previously. A z-test (i.e., Naiman, Rosenfeld, & Zirkel 1983) was done on the diffuse and dense subsets. A z-test is essentially the same as a t-test, as it is used to determine if two different datasets have significantly different mean values, but is used for large samples. As with the t-test, the resulting significance of such a test ranges from 0 (the samples have significantly different means) to 1 (the samples have essentially the same means). For example, a significance of a few hundredths indicates that two samples have significantly different means. For the dense and diffuse sightlines, the resulting significance was 10-6, which implies that there is a very significant difference between the mean values of the dense and diffuse subsets. Fig. 6 shows a plot of all of the sightlines and their environmental dependence, and a plot of sightlines which are more than 3 from the mean value of . It can be seen that there is a clear trend that the narrowest bumps tend to be found along sightlines with 0.9 mag/kpc, the “diffuse” subset. These results strengthen those of FM86 and Cardelli & Clayton (1991), who found that lines of sight that passed through bright nebulosities (“diffuse” sightlines) had narrower bumps than those that passed through dark clouds.
Fig. 7 compares c4/R(V) and c3/R(V), with respect to . It can be seen that as the bump height increases, the range of values of the FUV rise increases, and the sightlines with the widest bumps tend to have higher values of c3/R(V), all of which has been reported previously by FM88. This is likely a reflection of the dependence of c3/R(V) and on R. No similar trends can be seen between c4/R(V) and , as was discussed earlier.
Fig. 8 plots vs. x0, the bump central wavelength, for the sample. This figure shows that while varies significantly from one sightline to another, x0 does not. The extremely narrow range of x0 agrees with FM86, who found that the mean x0 = 4.60 m-1. They find extreme values of x0 are within 0.04 m-1 of the mean. Neither HD 62542 nor HD 29647 were included in the FM86 sample. JG93 found a similar value of x m-1 for the Aiello et al. (1988) sample. For the much larger sample studied here, x = 4.590.01 m-1, with values ranging from 4.500.04 m-1 (HD 145792) to 4.700.03 m-1 (HD 29647).
With the possible exception of HD 29647, it appears that x0 does not vary from sightline to sightline. Cardelli & Savage (1988) found that the 2175 Å bumps toward both HD 62542 and HD 29647 were significantly shifted to shorter wavelengths. However, we find x 0.03 m-1 for HD 62542. Cardelli & Savage (1988) found x0= 4.740.03 m-1, and in the extinction curve shown in their work, the bump is visibly shifted blueward. In an effort to reproduce their results, the same IUE spectra and UV comparison star were used to construct an extinction curve. This curve was then fit over three ranges; the original FM90 range (3.3 - 8.7 m-1), from 3.7 - 8.0 m-1, and from 3.7 - 8.7 m-1 excluding the region around Ly. None of these ranges produced a shifted bump. While the spectra used by Cardelli & Savage (1988) are the same as used here, their spectra were reduced and calibrated with a different software package than those in the final archive.
In our sample of 417 sightlines, only one was shifted as much as 3 beyond the mean. We find x0 = 4.700.03 m-1 for HD 29647, the same value found by Cardelli & Savage (1988). The other two fitting ranges that were considered when testing for HD 62542’s bump shift were applied to HD 29647. The values of x0 that were found were within 1 of the mean. Thus, it is quite possible that the shift in the HD 29647 bump also is fit dependent. Another sightline, lying close to that of HD 29647 has been studied (Clayton et al. 2003). Both sightlines pass through the Taurus Dark Cloud. The second sightline, toward HD 283809, shows no evidence of a shifted bump.
If the carrier is small graphite grains, then , where is the grain radius, while x0 is not a function of size (Bohren & Huffman 1983; Hecht 1986). Hecht concluded that some fraction of small (Å) carbonaceous grains are bare and these are responsible for the bump. In this scenario, the bump width is dependent on the temperature and size distribution of these grains. The remaining small carbon grains are hydrogenated, which would suppress the bump (Hecht 1986). One drawback to this model was that it required an overabundance of small grains in dense regions relative to diffuse regions (FM86; Sorrell 1990), since a large value of implies small grain size in this scenario. This conflicts with the observation that dense regions tend to have higher values of RV, indicating the prevalence of large grains. However, since x0 is not dependent on RV (or anything else), the grains which produce the bump may form a separate population from those which are responsible for variations in RV (CCM). On the other hand, it can be seen in Fig. 4 that there is a weak correlation between and RV-1. This agrees with the finding that is environment dependent. In 1990, Sorrell expanded upon Hecht’s (1986) work, suggesting that the accretion of hydrogen on larger graphite grains with 60 Å Å was responsible for the variations in . He suggested that hydrogenation of grains in dense regions broadens the bump, without affecting x0.
Mathis (1994) considered diamond, amorphous carbon (AMC), water ice, and PAH mantles on graphite cores. He found that the diamond coating tended to shift x0 to longer much wavelengths. A thin coating of amorphous carbon yields x0 =4.57 m-1 but produces a low = 0.84 m-1. Increasing the thickness of mantle does not increase to values that are observed; a thicker mantle only broadens the bump to =0.93 m-1. Hydrogenated amorphous carbon mantles are even less suitable, as they shift x0 to longer wavelengths while having even less of an impact on than AMC did. Water ice mantles may broaden , but only one sightline in our sample (HD 29647) has the telltale 3.07 m ice feature (Goebel 1983). Warren (1984) showed that ice mantles do not affect the bump because there is almost no absorption at wavelengths near 2175 Å. Neutral PAHs are also possible bump grain candidates, as they can produce both x0 and consistent with observations, with x 4.61 m-1 for = 1.0 m-1 (Mathis 1994). However, these values were found by assuming that the optical constants of isolated PAHs are similar to those comprising the mantle and by ignoring impurities which might alter the PAH optical properties. Another drawback is that neutral PAHs should have absorption features in the UV which are not seen (Clayton et al. 2003), though Joblin et al. (1992) showed that this could be masked by averaging over a distribution of PAHs of different sizes. Also, it is unlikely that many PAHs are neutral in the diffuse ISM (e.g., LePage et al. 2003).
3.3 Deviations from CCM
Adherence to the RV-dependent extinction law of CCM in our sample was also examined. In order to do this, we found the CCM curve which best fit each extinction curve. The extinction curves were fit with a CCM curve using a standard IDL curve fitting routine that minimized the . The values of RV found this way were compared to those calculated using IR photometry as is shown in Fig. 9. While there is some scatter, there is generally good agreement between the two values, with the fitted RV being within 3 of the calculated value for 93% of the sample. This indicates that the vast majority of sightlines agree with CCM within the measurement uncertainties. The near absence of non-CCM sightlines in the Galaxy could be attributed to the IUE dataset somehow favoring lines of sight through CCM-type dust environments. IUE was a small telescope with limited dynamic range. As a result, there is little information on grain parameters deep inside dark clouds. The dust columns sampled in this study all have A 5 mag.
Next we measured deviations of each measured extinction curve from its best fit CCM curve. We followed the method of Mathis & Cardelli (1992; hereafter MC92), in which the authors specified the deviation at various wavelengths to be:
Plots are shown of these deviations in Fig. 10 at 4.65, 4.90, 5.07, 5.24, and 7.82 m-1. The calculated and best-fit CCM extinction curves agreed within 2 of each other for all but four of the sightlines, HD 210121, HD 204827, HD 62542, and HD 29647, which are deviant at several wavelengths. Their deviations are shown in Table 7.
HD 204827 is an intriguing sightline. It has been shown that when a foreground reddening component has been removed, its extinction curve resembles that of the SMC, even though the environment of the dust in the HD 204827 cloud is quite different from that seen in the SMC sightlines (Valencic et al. 2003). A similar curve has been found toward HD 283809 (Whittet et al. 2004). The dust local to HD 204827 has high density. The HD 204827 dust cloud resembles a molecular cloud more than the diffuse ISM. The HD 204827 cloud is very rich in carbon molecules, showing large column densities of C2, C3, CH, and CN (Oka et al. 2003; Thorburn et al. 2003). The sightline to HD 204827 samples dust swept up by a supernova or hot star winds (Patel 1998). In these respects, the HD 204827 dust is quite similar to the sightline toward HD 62542 (Cardelli & Savage 1988). Its dust is also rich in carbon molecules. The sightline to HD 62542 also lies on the edge of material swept up by a stellar wind bubble. The other two non-CCM, weak bump, steep far-UV sightlines in the Galaxy, HD 29647, and HD 210121, are also associated with dense clouds (Cardelli & Savage 1988; Larson, Whittet, & Hough 1996; Cardelli & Wallerstein 1989). The dust in the molecular cloud associated with HD 210121 is likely to have been processed as it was propelled into the halo during a Galactic fountain or other event. The final sightline, toward HD 29647, is sampling dust in a quiescent dense cloud. The steep far-UV extinction in these clouds helps shield the molecules in these clouds from dissociating UV radiation leading to larger column densities (Mathis 1990).
Fig. 11 shows the deviations, and , plotted against the column density of CN along the sightline divided by AV for 46 sightlines from our sample, including the four non-CCM sightlines discussed above (Federman 1994; Oka et al. 2003). CN can be used as an indicator of relatively dense regions in diffuse, molecule-rich clouds (Joseph et al. 1986; Gredel et al. 2002). The average and N(CN)/AV (1013cm-2 mag-1) for the 42 CCM-like sightlines were 0.030.03 and 0.330.01, respectively. For the four non-CCM sightlines, these values were 1.060.15 and 2.750.15. These four sightlines have both high N(CN)/AV and sigificant deviation from CCM at =7.82 compared to the CCM-like sample. Similarly, Burgh et al. (2000) showed that sightlines with steep FUV rises tend to have high N(CO)/E(B-V), though they did not notice any correlating weakness in the bump strength.
Virtually all of the non-CCM sightlines known today are in the (diffuse) Magellanic Clouds, not in dense Galactic clouds (e.g., Gordon et al. 2003). Clayton et al. (2000), found that the average of seven low density, low reddening sightlines showed an extinction curve very similar to the LMC. These 7 stars were found to be behind gas that showed signs of being subjected to shocks The deviations from CCM for the average of these 7 sightlines as well as for the SMC and LMC average curves were also found and are included in Figs. 10 and 9. Similar deviations from CCM may arise in various dust environments.
3.4 The Updated CCM Law
The new extinction curves and values of RV allow us to revise the CCM law. This was done by following the method described in CCM; that is, by plotting Aλ/AV against R for all wavelengths, then performing a linear least-squares fit of the resulting correlation. Thus, for all wavelengths, the extinction Aλ/ARV. Then, and were plotted against and fit with a polynomial expression by minimizing . It was found that for 3.3 m-1,
where, for m-1,
and for m-1,
A comparison of extinction laws are plotted in Fig. 12. The most noticeable difference between the law found here and the original CCM law, the increase in the zero-point of the UV extinction, is a consequence of the slightly higher value of the first term in . In 1988, CCM also found a higher value for this term (1.802) than in 1989 (1.752), when they found that the lower value, which was within the dispersion in the data, was needed for the curve to smoothly join the optical extinction data. Fig. 12 also shows the resulting curve when the average FM parameter values are used to construct extinction curves at different values of RV, in a fashion similar to Fitzpatrick (1999). The two methods of curve construction yield curves that are within 5% of each other for 2.5 R 5.0 over the entire wavelength range. For all values of RV, the difference is primarily in the bump height, or the FM parameter c3. This is most noticeable for 5.0 R 6.0; here, the curves agree to within 7%, with the curve found through the average FM parameters having a weaker bump than predicted by the either the revised or original CCM law. This can also be seen to a certain extent in Fig. 4. A weakened bump at high RV may be expected from Whittet et al.’s (2004) work, which suggests that the bump carrier may be destroyed in dark clouds. Both the revised CCM curves and the average FM curves are within about 5% of the original CCM law for 2.5 R 3.5. However, for increasing values of RV, the difference between the curves increases as well, reaching 20% at R. That the original CCM law agreed so well with the extinction curves examined here is an indicator of the sizes of the uncertainties on the data. Changes in the value of the extinction zero-point is an important factor. If the first term in is decreased by 0.20, the new CCM law and the original curve agree to within 15% for 2.5 RV 6.0 for m-1, and within about 20% for m-1. The dotted curve, constructed from Fitzpatrick’s (1999) suggested values of FM parameters with only c2 (and through it, c1) dependent on RV, illustrate further the dependences of some FM parameters on RV.
4 Conclusions
We have constructed a homogeneous database of UV extinction curves, all of which have been fit by the FM relation and for which values of RV have been calculated. All extinction curves and FM parameters have been normalized to AV, rather than E(B-V), so that relationships between parameters may be more easily seen. This is the largest and most comprehensive database of extinction curves yet constructed, sampling a wide variety of environments. It contains much longer sightlines than those included in previous studies (30 sightlines have d 5 kpc), thus greatly increasing the volume of the Galaxy sampled compared to previous works. Over 150 sightlines have d 2 kpc, so the regions of the Galaxy beyond the solar neighborhood are well represented.
The main results of this study are:
(1.) The CCM extinction relation accurately describes the diffuse Galactic ISM in virtually all cases. Out of 417 sightlines, only 4 deviated consistently from their CCM extinction curves by more than 3. This indicates that the physical processes which give rise to grain populations that have CCM-like extinction dominate the ISM, and thus, the quantity RV can accurately describe the UV extinction for most sightlines. This implies that the grain populations responsible for different components of the extinction curve are being processed efficiently and systematically along most sightlines.
The new curves and RV values allow for an updated CCM law to be made. The original and updated versions are within 5% of each other for 2.5 R over the full wavelength range covered, 3.3 x m-1. At higher values of RV, the differences in the extinction zero-point reduce the agreement in the curves to about 20%.
(2.) The bump width has a strong environmental dependence, with narrow bumps favoring diffuse sightlines, and broad bumps favoring dense sightlines. Very broad bumps are rare, as only 21 out of 417 sightlines had 1.1.
(3.) The central wavelength of the bump is invariant and may be regarded as a constant, with x0=4.590.01. Unlike the other parts of the UV extinction curve, this parameter does not respond to different environments. The invariance of x0, along with the observed variations in , put strong constraints on possible bump grain and mantle materials.
(4.) While there is evidence for shock processing in three of the four non-CCM sightlines, the common denominator is that all four sightlines have dense, molecule-rich clouds. They also had weak bumps and strong FUV extinction for their measured RV CCM curves, especially those which pass through cold, quiescent regions. The weakened bump may reflect processing which modifies or destroys the bump carrier in dark clouds (Whittet et al. 2004). This is seen in the bumpless dust toward HD 204827 and HD 283809. Other dense sightlines with strong FUV extinction, HD 204827, HD 62542, and HD 210121, pass through dense clouds that may have been exposed to shocks or strong UV radiation that disrupt large grains, possibly resulting in a size distribution that is skewed toward small grains.
Together, the sightlines in the Galaxy and the Magellanic Clouds suggest that similar extinction properties may arise from very different environments.
Financial support was provided by the Louisiana Board of Regents, BoRSF, under agreement NASA/LEQSF(1996-2001)-LaSPACE-01 or NASA/LEQSF (2001-2005)-LaSPACE and NASA/LaSPACE under grant NGT5-40115.
References
- Aiello et al. (1982) Aiello, S., Guidi, I., Barsella, B., Penco, U., & Perinotto, M. 1982, Ap&SS, 87, 463
- Aiello et al (1988) Aiello, S., Barsella, B., Chlewicki, G.,Greenberg, J. M., Patriarchi, P., & Perinotto, M. 1988, A&AS, 73, 195
- Allain et al. (1996a) Allain, T, Leach, S., & Sedlmayr, E. 1996, A& A, 305, 602
- Allain et al. (1996b) Allain, T, Leach, S., & Sedlmayr, E. 1996, A&A, 305, 616
- Barbaro et al. (2001) Barbaro, G., Mazzei, P., Morbidelli, L., Patriarchi, P., & Perinotto, M. 2001, A&A, 365, 157
- Bianchi et al. (1996) Bianchi, L., Clayton, G. C., Bohlin, R. C., Hutchings, J. B., & Massey, P. 1996, ApJ, 471, 203
- Bless & Savage (1970) Bless, R. C. & Savage, B. D. 1970, in Ultraviolet Stellar Spectra and Related Ground-Based Observations, IAU Symp. No. 36, eds. L. Houziaux and H.E. Butler, (Dordecht:Ridel), p. 28
- Bohlin et al. (1978) Bohlin, R. C. Savage, B. D., & Drake, J. F. 1978, ApJ, 224, 132
- Bohren & Huffman (1983) Bohren C. F. & Huffman, D. R. 1983, Absorption and Scattering of Light by Small Particles (New York: Wiley Interscience)
- Borgman et al. (1975) Borgman, J., van Duinen, R. J., & Koornneef, J. 1975, A&A, 40, 461
- Burgh et al. (2000) Burgh, E. B., McCandliss, S. R., Andersson, B.-G., & Feldman, P. D. 2000, ApJ, 541, 250
- Cardelli & Clayton (1991) Cardelli, J. & Clayton, G. 1991, AJ, 101, 1021
- Cardelli et al. (1988) Cardelli, J., Clayton, G., & Mathis, J. 1988, ApJ, 329, 33
- Cardelli et al. (1989) Cardelli, J., Clayton, G., & Mathis, J. 1989, ApJ, 345, 245
- Cardelli & Savage (1988) Cardelli, J. & Savage, B. 1988, ApJ, 325, 864
- Cardelli et al. (1992) Cardelli, J., Sembach, K. R., & Mathis, J. S. 1992, AJ, 104, 1916
- Cardelli & Wallerstein (1989) Cardelli, J. & Wallerstein, G. 1989, AJ, 97, 1099
- Carnochan (1986) Carnochan, D. J. 1986, MNRAS, 219, 903
- Clayton et al. (1987) Clayton, G. C. & Fitzpatrick, E. L. 1987, AJ, 93, 157
- Clayton et al. (2003) Clayton, G. C., Gordon, K. D., Salama, F., Allamandola, L. J., Martin, Peter G., Snow, T. P., Whittet, D. C. B., Witt, A. N., & Wolff, Michael J. 2003, ApJ, 592, 947
- Clayton et al. (2000) Clayton, G. C., Gordon, K. D., & Wolff, M. J. 2000, ApJ, 129, 147
- Clayton et al. (1996) Clayton, G. C., Green, J., Wolff, M., Zellner, N., Code, A., Davidsen, A., WUPPE Science Team, & HUT Science Team, 1996, ApJ, 460, 313
- Clayton et al. (1985) Clayton, G. C. & Martin, P. G. 1985, ApJ, 288, 558
- Cox (2000) Cox, A. N. 2000, Allen’s Astrophysical Quantities ed. A. N. Cox, (4th ed.; London: AIP Ltd.)
- Cutri et al. (2003) Cutri, R.M., et al. 2003, 2MASS Second Incremental All Sky Point Source Catalog
- Draine & Lee (1984) Draine, B. T. & Lee, H. M. 1984, ApJ, 285, 89
- Draine (1985) Draine, B. T. 1985, ApJS, 57, 587
- Draine (1987) Draine, B. T. 1987, ApJS, 64, 505
- Federman et al. (1994) Federman, S. R., Strom, C. J., Lambert, D. L., Cardelli, Jason A., Smith, V. V., & Joseph, C. L. 1994, ApJ, 424, 772
- Fitzpatrick (1985) Fitzpatrick, E. L. 1985, ApJS, 59, 77
- Fitzpatrick (1986) Fitzpatrick, E. L. 1986, AJ, 92, 1068
- Fitzpatrick (1999) Fitzpatrick, E. L. 1999, PASP, 111, 63
- Fitzpatrick & Massa (1990) Fitzpatrick, E. & Massa, D. 1990, ApJS, 72, 163
- Goebel (1983) Goebel, J. H. 1983, ApJ, 268, 41
- Gordon & Clayton (1998) Gordon, K. & Clayton, G. 1998, ApJ, 500, 816
- Gordon et al. (2003) Gordon, K., Clayton, G., Misselt, K., Landolt, A., & Wolff, M. 2003, ApJ, 594, 279
- Gredel et al. (2002) Gredel, R., Pineau des Forets, G., & Federman, S. R. 2002, A&A, 389, 933
- Guetter (1974) Guetter, H. 1974, PASP, 86, 795
- Haupt & Schroll (1974) Haupt, H. & Schroll A. 1974, A&AS, 15, 311
- Hecht (1986) Hecht, J. 1986, ApJ, 305, 817
- Hiltner (1956) Hiltner, W. A. 1956, ApJS, 2, 389
- Hiltner et al. (1956) Hiltner, W. A. & Johnson, H. L. 1956, ApJ, 124, 367
- Jackson (1962) Jackson, J. D. 1962, in Classical Electrodynamics (New York: Wiley)
- JG (1993) Jenniskens, P. & Greenberg, J. M. 1993, A&A, 274, 439
- Joblin (1992) Joblin, C., Léger, A., & Martin, P. 1992, 393, 79L
- Joseph (1986) Joseph, C. L., Snow, T. P. Jr., Seab, C., & Crutcher, R. M. 1986, ApJ, 309, 771
- Kester (1981) Kester, D. 1981, A&A, 99, 375
- Koorneef (1978) Koornneef, J. 1978, A&A, 68, 139
- Koorneef & Code (1981) Koornneef, J. & Code, A. D. 1981, ApJ, 247, 860
- Larson et al. (1996) Larson, K. A., Whittet, D. C. B., & Hough, J. H. 1996, ApJ, 472, 755
- Le Page et al. (2003) Le Page, V., Snow, T., & Bierbaum, V. 2003, ApJ, 584, 316
- Luck & Lambert (1992) Luck, R. E. & Lambert, David L. 1992, ApJS, 79, 303
- Massa, D., & Fitzpatrick (2000) Massa, D., & Fitzpatrick, E. L. 2000, ApJS, 126, 517
- Massa et al. (1983) Massa, D. Savage, B. D. & Fitzpatrick, E. L. 1983, ApJ, 266, 662
- Massa & Savage (1984) Massa, D. & Savage, B. D. 1984, ApJ, 279,310
- Mathis (1990) Mathis, J. 1990, ARA&A, 28, 37
- Mathis & Cardelli (1992) Mathis, J. & Cardelli, J. 1992, AJ, 104, 1916
- Mathis (1994) Mathis, J. S. 1994, ApJ, 422, 176
- Meyer & Savage (1981) Meyer, D. M. & Savage, B. D. 1981, ApJ, 248, 545
- Misselt, Clayton & Gordon (1999) Misselt, K. Clayton, G. & Gordon, K. 1999, ApJ, 515, 128
- Naiman et al. (1983) Naiman, A., Rosenfeld, R., & Zirkel, G. 1983, Understanding Statistics (3rd ed.; New York: McGraw-Hill, Inc.)
- Nandy et al. (1975) Nandy, K., Thompson, G. I., Jamar, C., Monfils, A., & Wilson, R. 1975, A&A, 44, 195
- Nandy et al. (1976) Nandy, K., Thompson, G. I., Jamar, C., Monfils, A., & Wilson, R. 1976, A&A, 51, 63
- Nandy et al. (1981) Nandy, K., Morgan, D. H., Willis, A. J., Wilson, R., & Gondhalekar, P. M. 1981, MNRAS, 196, 955
- Nichols & Linsky (1996) Nichols, J.S. & Linsky, J.L. 1996, AJ, 111, 517
- Nicolet (1978) Nicolet, B. 1978, A&AS, 34, 1 1996, AJ, 111, 517
- Oka (2003) Oka, T., Thorburn, J. A., McCall, B. J., Friedman, S. D., Hobbs, L. M., Sonnentrucker, P., Welty, D. E., & York, D. G. 2003, ApJ, 582, 339
- Papaj et al. (1991) Papaj, J., Krelowski, J., Wegner, W. 1991, MNRAS, 252, 403
- Papaj & Krelowski (1992) Papaj, J. & Krelowski, J. 1992, AcA, 42, 211
- Patel et al. (1998) Patel, N. A., Goldsmith, P. F., Heyer, M. H., Snell, R. L., & Pratap, P. 1998, ApJ, 507, 241
- Pendleton et al. (1994) Pendleton, Y. J., Sandford, S. A., Allamandola, L. J., Tielens, A. G. G. M. & Sellgren, K. 1994, ApJ, 437, 683
- Savage et al. (1985) Savage, B. D.; Massa, D.; Meade, M.; Wesselius, P. R. 1985, ApJS, 59, 397
- Schild et al. (1983) Schild, R., Garrison, R., & Hiltner, W. 1983, ApJS, 51, 321
- Seaton (1979) Seaton, M. J. 1979, MNRAS, 187, 73
- Smith (1993) Smith, R. G., Sellgren, K., & Brooke, T. Y. 1993, MNRAS, 263, 749
- Snow & Seab (1980) Snow, T. P. Jr. & Seab, C. G. 1980, ApJ, 242, L83
- Sorrell (1990) Sorrell, W. H. 1990, MNRAS, 243, 570
- Spitzer (1978) Spitzer, L. 1978, Physical Processes in the Interstellar Medium, (New York: John Wiley & Sons, Inc.)
- Thorburn et al. (2003) Thorburn, J. A., Hobbs, L. M., McCall, B. J., Oka, T., Welty, D. E., Friedman, S. D., Snow, T. P., Sonnentrucker, P., York, D. G. 2003, ApJ, 584, 339
- Valencic (2003) Valencic, L. A., Clayton, G.C., Gordon, K.D., & Smith, T.L. 2003, ApJ, 589, 369
- Verstraete et al. (1990) Verstraete, L., Leger, A., D’Hendecourt, L., Defourneau, D., Dutuit, O. 1990, A&A, 237, 436
- Warren (1984) Warren, S. G. 1984, Appl. Optics, 23, 1206
- Whittet (2004) Whittet, D. Senoy, S. Clayton, G. Gordon, K. 2004, in Astrophyics of Dust, in press
- York et al. (1973) York, D. G., Drake, J. F., Jenkins, E. B., Morton, D. C., Rogerson, J. B., & Spitzer, L. 1973, ApJ, 182, L1
| (1) | (2) | (3) | (4) | (5) | (6) |
|---|---|---|---|---|---|
| Authorship | No. of Sightlines | Instrument | FM | Spectral | RV |
| Classification | |||||
| Savage et al. 1985 | 1415 | ANS | no | MK | no |
| Aiello et al. 1988 | 115 | IUE | no | UV | no |
| FM90 | 78 | IUE | yes | UV | no |
| Papaj et al. 1991 | 166 | TD-1 | no | UV | no |
| JG93 | 115 | IUE | yes | UV | no |
| Barbaro et al. 2001 | 252 | ANS | yes | MK | yes |
| This Work | 417 | IUE | yes | UV | yes |
| Name | Spectral | UV | U | B | V | J | H | K | UBV | U | Non-2MASS |
|---|---|---|---|---|---|---|---|---|---|---|---|
| Type | Type | Source | Source† | Source | |||||||
| HD 14052 | B1Ib | B1Iab | 7.90 | 8.48 | 8.18 | 7.51 | 7.50 | 7.42 | 1 | … | … |
| 0.01 | 0.01 | 0.01 | 0.03 | 0.03 | 0.02 | ||||||
| HD 14357 | B2II | B2Ib | 8.31 | 8.83 | 8.52 | 7.86 | 7.83 | 7.80 | 1 | … | … |
| 0.01 | 0.01 | 0.01 | 0.03 | 0.02 | 0.02 | ||||||
| HD 41690 | B1V | B1.5III | 7.31 | 7.93 | 7.71 | 7.20 | 7.23 | 7.20 | 1 | … | … |
| 0.01 | 0.01 | 0.01 | 0.02 | 0.02 | 0.03 | ||||||
| HD 199216 | B1II | B2III | 7.05 | 7.51 | 7.03 | 6.05 | 6.03 | 5.97 | 1 | … | … |
| 0.01 | 0.01 | 0.01 | 0.02 | 0.03 | 0.02 | ||||||
| HD 203938 | B0.5IV | B1.5III | 7.13 | 7.54 | 7.08 | 5.97 | 5.88 | 5.81 | 1,2 | … | … |
| 0.01 | 0.01 | 0.01 | 0.02 | 0.02 | 0.02 | ||||||
| HD 235783 | B1Ib | B1Iab | 8.14 | 8.85 | 8.68 | 8.28 | 8.27 | 8.26 | 1 | … | … |
| 0.01 | 0.01 | 0.01 | 0.03 | 0.05 | 0.02 |
† If not the same as UBV Source.
The complete version of this table is in the electronic edition of
the Journal. The printed edition contains only a sample.
| Number | Citation |
|---|---|
| 1 | Hiltner, W. A. 1956, ApJS, 2, 389 |
| 2 | Nicolet, B. 1978, A&AS, 34, 1 |
| 3 | Schild, R., Garrison, R., & Hiltner, W. 1983, ApJS, 51, 321 |
| 4 | Haupt, H., & Schroll, A. 1974, A&AS, 15, 311 |
| 5 | Guetter, H. 1974, PASP, 86, 795 |
The complete version of this table is in the electronic edition of the Journal. The printed edition contains only a sample.
| Name | E(B-V) | RV | AV | Distance | Max. Distance | Min. Distance |
|---|---|---|---|---|---|---|
| (pc) | (pc) | (pc) | ||||
| HD 14052 | 0.49 | 2.99 | 1.47 | 4195.08 | 3322.81 | 6065.88 |
| 0.04 | 0.19 | 0.14 | ||||
| HD 14357 | 0.48 | 2.90 | 1.39 | 3817.16 | 2838.24 | 5229.96 |
| 0.04 | 0.21 | 0.15 | ||||
| HD 41690 | 0.47 | 2.91 | 1.37 | 820.92 | 602.25 | 1111.31 |
| 0.04 | 0.22 | 0.16 | ||||
| HD 199216 | 0.72 | 2.62 | 1.88 | 1567.69 | 1155.49 | 2380.10 |
| 0.04 | 0.36 | 0.27 | ||||
| HD 203938 | 0.71 | 3.13 | 2.22 | 496.81 | 362.62 | 672.56 |
| 0.04 | 0.14 | 0.16 |
The complete version of this table is in the electronic edition of the Journal. The printed edition contains only a sample.
| Name | c1/RV + 1.0 | c2/RV | c3/RV | c4/RV | x0 | |
|---|---|---|---|---|---|---|
| HD 14052 | 1.1856 | 0.2271 | 0.8595 | 0.2124 | 4.5740 | 0.8440 |
| 0.3918 | 0.0258 | 0.1237 | 0.0411 | 0.0140 | 0.0280 | |
| HD 14357 | 1.1134 | 0.2745 | 1.0155 | 0.2421 | 4.5830 | 0.8970 |
| 0.1461 | 0.0282 | 0.1364 | 0.0296 | 0.0050 | 0.0280 | |
| HD 41690 | 1.3412 | 0.2326 | 0.7100 | 0.2790 | 4.6050 | 0.7800 |
| 0.2734 | 0.0347 | 0.1193 | 0.0494 | 0.0120 | 0.0270 | |
| HD 199216 | 0.7992 | 0.2908 | 1.3424 | 0.1408 | 4.5900 | 0.9360 |
| 0.2038 | 0.0436 | 0.2244 | 0.0339 | 0.0090 | 0.0340 | |
| HD 203938 | 1.1581 | 0.1933 | 1.1735 | 0.1371 | 4.5580 | 1.0120 |
| 0.3085 | 0.0190 | 0.1534 | 0.0217 | 0.0110 | 0.0340 |
The complete version of this table is in the electronic edition of the Journal. The printed edition contains only a sample.
| Absolute Deviation | Linear Fit | |
|---|---|---|
| 0.58 | 0.19 | c3 = 2.12 - 0.95 |
| -0.79 | 0.13 | c1 = -2.54 c2 + 1.67 |
| 0.49 | 0.54 | c3 = 1.75 c2 + 0.54 |
| HD | |||||
|---|---|---|---|---|---|
| 29647 | -0.58 | -0.35 | -0.18 | -0.08 | 0.31 |
| 62542 | -1.49 | -1.10 | -0.75 | -0.50 | 1.12 |
| 204827 | -0.65 | -0.44 | -0.29 | -0.18 | 0.43 |
| 210121 | -2.63 | -2.35 | -1.76 | -1.24 | 2.33 |