Gemini/GMOS Imaging of Globular Clusters in the Virgo Galaxy NGC 4649 (M60)
Abstract
We present Sloan g and i imaging from the GMOS instrument on the Gemini North telescope for the globular cluster (GC) system around the Virgo galaxy NGC 4649 (M60). Our three pointings, taken in good seeing conditions, cover an area of about 90 sq. arcmins. We detect 2,151 unresolved sources. Applying colour and magnitude selection criteria to this source list gives 995 candidate GCs that is greater than 90% complete to a magnitude of i = 23.6, with little contamination from background galaxies. We find fewer than half a dozen potential Ultra Compact Dwarf galaxies around NGC 4649. Foreground extinction from the nearby spiral NGC 4647 is limited to be AV 0.1. We confirm the bimodality in the GC colour distribution found by earlier work using HST/WFPC2 imaging. As is commonly seen in other galaxies, the red GCs are concentrated towards the centre of the galaxy, having a steeper number density profile than the blue GC subpopulation. The varying ratio of red-to-blue GCs with radius can largely explain the overall GC system colour gradient. The underlying galaxy starlight has a similar density profile slope and colour to the red GCs. This suggests a direct connection between the galaxy field stars and the red GC subpopulation. We estimate a total GC population of 3700 900, with the uncertainty dominated by the extrapolation to larger radii than observed. This total number corresponds to a specific frequency SN = 4.1 1.0. Future work will present properties derived from GMOS spectra of the NGC 4649 GCs.
keywords:
globular clusters: general – galaxies: individual: NGC 4649 – galaxies: star clusters.1 Introduction
The study of globular cluster (GC) systems provides important insights into the star-formation history and chemical enrichment of galaxies (Ashman & Zepf 1998, Harris 2001). GCs are created during the initial stages of galaxy formation; but they also appear to form in subsequent star formation episodes up to, and including, the current epoch. Observationally, GC systems typically reveal a bimodal colour distribution, indicating discrete GC sub-populations (e.g. Gebhardt & Kissler-Patig 1999; Larsen et al. 2001; Kundu & Whitmore 2001)
Several testable galaxy formation scenarios address the origin of this bimodal behaviour (Ashman & Zepf 1992, Forbes, Brodie & Grillmair 1997, Cote et al. 1998). Recently, GC formation has been placed in the broader cosmological context of galaxy formation. For example, Beasley et al. (2002) investigated the formation of GCs in a semi-analytic model which invoked hierarchical merging in a CDM cosmology, finding that blue (metal-poor) GCs are formed at high redshift in proto-galactic fragments, while the red (metal-rich) GCs are formed later, during the gas-rich merging of these fragments. One prediction of this model is that the formation of the red GCs will be extended over several Gyrs in low density environments.
In order to test the model predictions, and further probe the halos of galaxies, we have undertaken to study the GC systems in a sample of early-type galaxies with the Gemini telescopes. The galaxies cover a range of environments and luminosities. Our basic approach, using the GMOS instruments, is to obtain deep imaging of several fields around each galaxy. A subset of the brighter candidate GCs are then selected for follow-up multi-object spectroscopy (these will be presented in a future paper by Bridges et al. 2004). The spectra allow us to derive GC system kinematics plus age and metallicity estimates for individual GCs. Some initial results of our programme have been highlighted in Bridges et al. (2003).
In this paper, we present and discuss the results from our deep imaging of the GC system around NGC 4649 (M60). This giant Virgo elliptical lies in a subclump to the East of the main Virgo concentration. The galaxy has strong X-ray emission with a luminosity of LX = 2.1 1041 erg/s (O’Sullivan, Forbes & Ponman 2001), largely from a hot diffuse halo. Chandra imaging reveals the presence of numerous discrete sources which are identified as low mass X-ray binaries (LMXBs), some of which lie in GCs (Sarazin et al. 2003). The galaxy has an old stellar population with no evidence of a young central population (Terlevich & Forbes 2002).
The GC system of NGC 4649 was first studied by Couture, Harris & Allwright (1991). Their B and V CCD imaging covered an area of 2.1 3.4 arcmins, and reached a depth of B 24.5. They measured a mean colour of B–V = 0.75 for 82 candidate GCs but could not detect any bimodality in the colour distribution. A radial colour gradient was seen in the overall GC population. Harris et al. (1991) studied the B band GC luminosity function. These data reached a depth of B 26. They measured the turnover to be B = 24.47 0.18 with a Gaussian spread of = 1.29 0.12. They also showed that the overall GC system has a more extended radial distribution than the underlying starlight.
Larsen et al. (2001) included NGC 4649 in their HST/WFPC2 study of GC systems in 17 galaxies, and detected a bimodal GC colour distribution. To V = 25, they detected 176 blue GCs and 169 red GCs with mean colours of (V–I)o = 0.954 and (V–I)o = 1.206. Kundu & Whitmore (2001) also found bimodality with peaks around V–I = 0.95 and 1.20. Larsen et al. fit a t5 profile to the GC luminosity function and found a peak magnitude of V = 23.58 0.08 and = 1.28 0.09. The red peak was 0.2 mag. fainter than the blue peak. The specific frequency in the literature is relatively high with SN = 6.7 1.4 (Ashman & Zepf 1998). In this paper we assume a distance to NGC 4649 of m–M = 31.13 (Tonry et al. 2001) or 16.83 Mpc, which implies 1 = 81 pc. The total V magnitude from the RC3 is 8.84. The Galactic extinction is AV = 0.086 from Schlegel et al. (1998) and = 0.030 from Burstein & Heiles (1982). This gives Vo = 8.75 (8.81) which corresponds to an absolute magnitude of MV = –22.38 (–22.32). At a projected distance of 12 kpc from NGC 4649 lies the SBc spiral NGC 4647.
2 Observations and Initial Data Reduction
Images were taken of NGC 4649 using the Gemini Multi-object Spectrograph (GMOS) in imaging mode on the Gemini North telescope on 2002 April 10, 11 and 14th. The internal Gemini program ID is 20020410-GN-2002A-Q-21/Q-13. The instrument consists of three 2048 4608 pixel CCDs, with a scale of 0.072 arcsec per pixel, yielding a 5.5 5.5 arcmin field-of-view in a single pointing. We obtained three pointings close to the galaxy centre: the North-East (field No. 1), South-East (field No. 2), and East (field No. 3). The images were taken using modified Sloan g and i filters (centred at wavelengths of 475 nm and 780 nm respectively). Both g and i images had exposure times of 4 120 sec, and the subexposures were dithered to remove the gaps between the CCD chips. The seeing for the three fields were similar in the g and i filters, with 0.6, 0.7 and 1.0 arcsec for fields 1, 2 and 3 respectively.
The raw images were processed using the Gemini GMOS routines within IRAF (e.g. gprepare, gbias, giflat, gireduce and gmosaic). The resulting images for each filter were then co-added using imcoadd. These images were then used for all the subsequent data analysis.
3 Object Finding and Selection
3.1 Galaxy halo removal
To aid in the selection, classification and photometry of the GC candidates we must first remove the bright background of the galaxy halo.
After experimenting with different filtering and modelling methods we adopted the SExtractor (Bertin & Arnouts 1996) background modelling approach. This method makes a local estimate of the background by, first, selecting a number of pixels within a box that, after k-sigma clipping and median filtering, yields a mesh of background values. These values can then be interpolated in order to estimate the background level at a given position. The best results were obtained for a grid sampling of 32 by 32 pixels, combined with a 5 pixels (square box) median filter, and bi-cubic interpolation.
3.2 Determination of the Point Spread Function
The determination of the point spread function (psf) on the co-added images was made using the DAOPHOT II package (Stetson 1987) within IRAF. Each psf determination involved 30 to 60 objects per field and the use of the variable psf option. Some of the unresolved objects (i.e. the brightest and relatively uncrowded ones) were used to derive aperture corrections to the psf fitting photometry.
An object search was carried out on the i image, since this is the deepest in terms of signal-to-noise, using the finding routines included in the SExtractor package. This approach classifies a detection as real if it is composed of a number of connected pixels, above a certain signal-to-noise. We used the following SExtractor parameters: detection treshold of 1.5 sigma; detection minimum area of 3 pixels, and filtering with a Gaussian of FWHM of 0.58 arcsecs.
A size measure (i.e. resolved or unresolved) for each object was made in two steps. The stellarity index, defined in SExtractor, was used as a first step. This index takes values of around 1.0 for unresolved objects and close to 0.0 for extended ones (at the distance of NGC 4649, GCs are not resolved in the GMOS images).
Figure 1 shows the behaviour of the stellarity index as a function of the i magnitude and shows that, for a range of intermediate index values, the nature of a given object cannot be unambiguously identified. However from a sample of 7,000 artifical objects created with the ADDSTARS rountine, we found that a stellarity index of greater than 0.35 provided a good initial definition of ”unresolved” (i.e. less 1.5% of objects were misclassified).

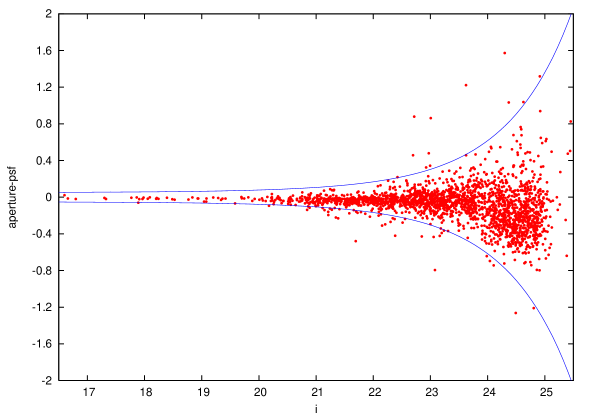
In order to improve this first selection, we analyzed the position of each object on a psf magnitude vs. aperture-minus-psf magnitude diagram shown in Figure 2. This figure shows both an increase of the dispersion as a function of magnitude, as expected from increasing photometric errors, and also an asymmetry towards negative values that is indicative of the resolved nature of the images. The upper boundary (positive values) in this figure is presumably dominated by unresolved objects and was quantified by adopting an exponential fit. This curve, and its negative mirror, were then used to define the domain of what we consider as unresolved objects. All those objects with magnitude differences more negative than the lower curve were then removed and added to the resolved objects list. Thus, we have a list of 874 resolved objects (i.e. galaxies) and a list of 2,151 unresolved objects, i.e. candidate GCs.
Figures 3 and 4 show the spatial distribution of the GC candidates and of the resolved objects. There is a clear concentration of the candidate GCs around the galaxy, whereas the resolved objects have a more random spatial distribution.


3.3 Photometry
One of the pointings (field No. 1) exhibits the best overall seeing both for the g and i images and was adopted as the reference field, i.e. both the instrumental (psf) magnitudes and colours of the other two pointings were derived using objects in the overlapping regions. After atmospheric extinction correction, the instrumental magnitudes and colours were linked to the standard system by adopting the zero-point values provided by the Gemini pipeline. We expect the absolute photometric calibration of GMOS images to improve with time, so our calibration should be considered as preliminary. The behaviour of the photometric errors for candidate GCs (as derived from the DAOPHOT package) are shown in Figures 5 and 6. Typical errors at i = 24 are 0.08 in magnitude and 0.13 in colour.
Note that the magnitudes and colours presented in this paper have not been corrected for Galactic extinction. The extinction values from Schlegel et al. (1998; AV = 0.086) and from Burstein & Heiles (1982; = 0.030) with Ag = 1.25AV and Ai = 0.65AV, imply a colour reddening correction of 0.052 and 0.018 respectively. If we apply the g,i to V,I transformations of Smith et al. (2002) our colours are 0.05 mag redder than the Schlegel et al. extinction-corrected values given in Larsen et al. (2001). This suggests that our magnitudes, although preliminary, are close to the standard photometric system.


Table 1 gives the photometry for the candidate GCs (similar measurements for the resolved objects are given in the Appendix Table A1). We list x,y position (in pixels), defined in a rectangular system with its origin at the galaxy centre with x positive towards West and y positive towards the North; galactocentric radius (in arcsecs), i magnitude, g–i colour and their errors.
| Table 1. Candidate NGC 4649 Globular Clusters | ||||||
|---|---|---|---|---|---|---|
| X | Y | RGC | i | g–i | i err | g–i err |
| (pix) | (pix) | (arcsec) | (mag) | (mag) | (mag) | (mag) |
| 3479 | 4546 | 101.6 | 22.95 | 1.11 | 0.03 | 0.06 |
| 4284 | 4546 | 151.3 | 21.19 | 0.99 | 0.01 | 0.01 |
| 4048 | 4541 | 135.8 | 20.51 | 0.67 | 0.01 | 0.01 |
| … | … | … | … | … | … | … |
Notes: the full table is available in the on-line version.
3.4 Completeness experiments
An estimate of the completeness of the photometric sample given in Table 1 was carried out by means of ADDSTARS experiments conducted on the i band galaxy-subtracted image. A total number of 7000 artificial objects were added to the image and the identification routine was run using the same search parameters as before. The spatial distribution of the artificial objects was determined using a stochastic-generating program that, in an approximate way, follows the radial distribution of the globular cluster candidates.
The results of our completeness tests are shown in Figures 7 and 8. Figure 7 shows the overall magnitude completeness, indicating that at i = 23.4 the data are 90% complete and at i = 24.7 the data are 50% complete. However, our completeness varies with galactocentric radius. In Figure 8 we show the completeness fractions for several different ranges of magnitude as a function of galactocentric radius. This figure shows that for i magnitudes brighter than 23.4, we have detected the vast majority of GCs over the entire NGC 4649 field. For magnitudes fainter than i = 23.4, we are missing some of the innermost GCs.


3.5 Background contamination
The degree of background contamination for the objects listed in Table 1 was estimated by adopting a comparison field, and assuming it is representative of the background near NGC 4649. This field was observed as part of our overall Gemini program, and is located some distance from the galaxy NGC 7332. Objects in the comparison field were selected using a similar procedure to that for the NGC 4649 fields. The number of resolved objects (i.e. presumably background galaxies) in the comparison field was found to be 256. This is consistent with the 874 resolved objects found in the three galaxy fields given the the slight seeing variations between fields. We note also, that we find 38 non-resolved objects (i.e. presumably foreground stars) in the comparison field. The galaxy model of Ratnatunga & Bahcall (1985) predicts 22 in our magnitude and colour range.
After completeness tests, similar to those described above, we find that the background field has a similar magnitude completeness to the NGC 4649 data with the 50% completeness fraction occurring at i 24.7. From this comparison field, we estimate the contamination of background objects in our sample of candidate GCs to be 3% for i 24. Thus we can be confident that the effects of background objects on the results presented below are minimal.
4 Foreground dust from NGC 4647 ?
The spiral galaxy NGC 4647 (UGC 7896) is located to the NW (PA –45o) of NGC 4649 at a projected separation of about 12 kpc. It has a recession velocity of 1422 km/s, or 305 km/s greater than that of NGC 4649. There are no obvious tidal interaction signatures between the two galaxies. Images of NGC 4647 reveal a flocculent spiral structure with strong dust lanes. If NGC 4647 lies in the foreground then dust in its outer regions may cause reddening of the NGC 4649 GCs in the NW quadrant.
We have compared both the GCs and the underlying starlight in the NW quadrant to each of the other three quadrants. We find similar colours (g–i 0.1) and similar mean magnitudes (i 0.05). These limit the extinction to be AV 0.1. In a study of dust extinction in overlapping galaxies, White, Keel & Conselice (2000) concluded that if NGC 4647 caused any additional extinction in NGC 4649 then it was limited to AB 0.11. Thus with no evidence for strong foreground dust reddening due to NGC 4647, we proceed to treat all GCs the same.
5 Results
5.1 Globular Cluster Colours
A colour-magnitude diagram for the candidate GCs is shown in Figure 9. The diagram shows some evidence of colour bimodality, with colours of g–i 0.9 and 1.2 down to magnitudes of i 24; fainter than that a broad colour distribution is seen. The contribution of contaminating background objects rises steeply at magnitudes fainter than i = 23.6. This magnitude also corresponds to reasonable errors of 0.05 in i magnitude and 0.08 in colour. Thus we now only consider objects brighter than i = 23.6. Our bright magnitude limit is chosen to be i = 20 (MI = –11.12) as the few sources brighter than this are likely to be foreground stars or compact dwarf galaxies. We note in passing that the number of potential Ultra Compact Dwarfs (UCDs; Drinkwater et al. 2003) with –12.12 MI –11.12 and g–i 1 is about half a dozen. All of these could be foreground stars (see Ratnatunga and Bahcall 1985) suggesting that NGC 4649 does not contain a large population of UCDs. A generous colour range of 0.5 to 1.5 has also been applied for GC selection. Such a selection would include all Milky Way GCs after a reddening correction. These magnitude and colour constraints are shown in Figure 9 and used for the subsequent analysis. A total of 995 objects meet these selection criteria.

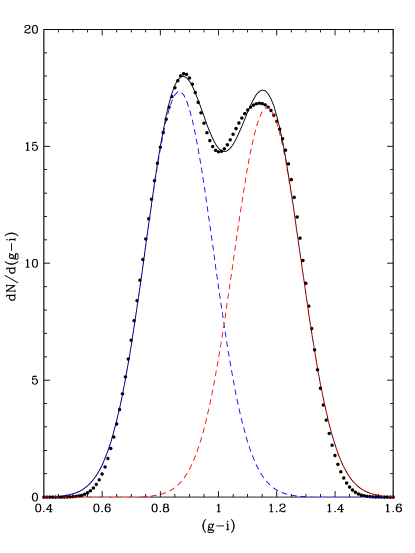
In Figure 10 we show the colour distribution, smoothed on 0.05 mag scales, for the candidate GCs from the CMD selected region. Two Gaussians have been fit (using NGAUSS in IRAF) to the distribution allowing their amplitudes, central position and FWHM to vary. We find that the distribution is well fit by two Gaussians. The blue subpopulation has a peak color of g–i = 0.865 0.005, and the red subpopulation has g–i = 1.167 0.004 (an extinction correction would make these colours 0.02–0.05 bluer).
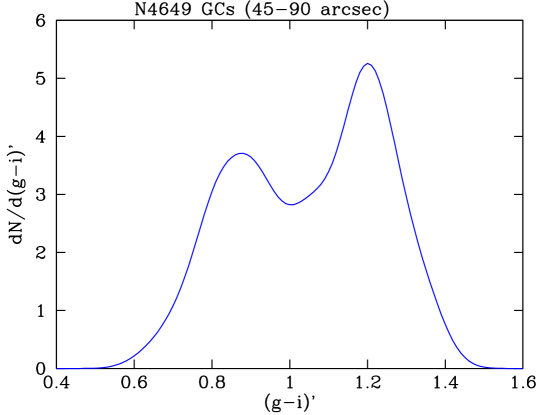
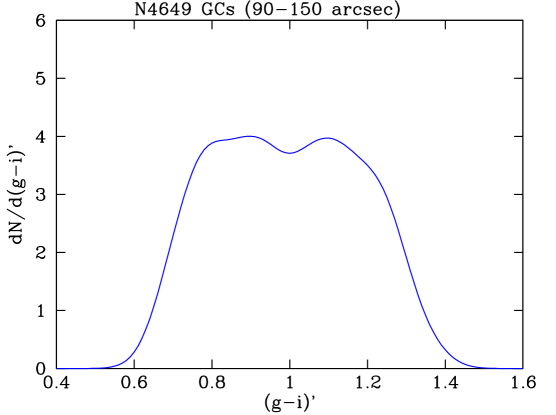
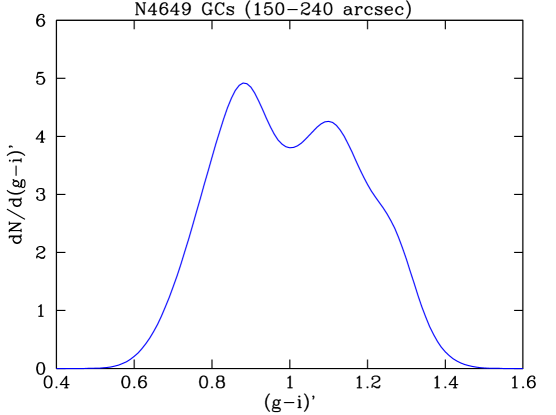
In Figure 11 we show colour distributions, smoothed on 0.05 mag scales, of candidate GCs over three radial bins (45-90, 90-150 and 150-240 arcsec), all of which have a completeness of 90% or better. These figures show how the inner regions are dominated by red (metal-rich) GCs, the outer regions by blue (metal-poor) GCs and intermediate regions have similar numbers of the two GC subpopulations.
In Figure 12 we show the radial gradient of the GC subpopulations compared to the overall GC system and the underlying galaxy starlight. For the galaxy profile two different sky subtraction algorithms have been used; for one the sky level has been subtracted using the counts in the outer regions of our field-of-view, and for the second these counts have been reduced by 75% (under the assumption that the outer regions still contains galaxy light). Both the red and blue GC subpopulations are statistically consistent with no radial colour trend (having non-zero slopes of 2 and 1.5 respectively). However, the overall GC population has a radial colour trend of 6 significance, becoming bluer with radius. This is therefore the effect of the changing relative mix of GCs with radius, i.e. the ratio of red-to-blue GCs decreases with radius. Similar trends been found over the radial range observed here for NGC 4472 (Geisler, Lee & Kim 1996; Rhode & Zepf 2001) and NGC 1399 (Forbes et al. 1998; Dirsch et al. 2003). The galaxy light has a similar colour to the mean colour of the red GCs for common radii (see also Forbes & Forte 2001).

5.2 Globular Cluster Surface Density
In Figure 13 we show the surface density of the two GC subpopulations versus galactocentric radius. The subpopulations have been restricted in colour to 0.5 g–i 0.9 and 1.1 g–i 1.5 to help remove the GCs with intermediate colours. A correction has been made for the missing area in each radial annulus. The error bars correspond to Poisson statistics.
As expected from Figure 11, we find the red GCs are more concentrated towards the galaxy centre than the blue GCs. In other words the red GCs have a steeper surface density profile. A simple power law fit to the surface density profiles gives a slope of –1.73 0.06 for the reds and –1.04 0.09 for the blues. We note that Harris et al. (1991) measured a slope of –1.08 0.10 for the overall GC system out to radii of 140 (for comparison our overall slope measured out to 230 is –1.3 0.05).
Figure 13 also shows the galaxy i band surface brightness profile, after converting into log units and applying an arbitrary vertical normalisation. The slope of the galaxy profile changes from –1.45 0.02 in the inner regions (5 to 30) to –1.75 0.02 in the outer regions (30 to 230). Thus for the region of overlap with the GC system, the galaxy starlight has the same slope, within the errors, to that of the red GC subpopulation.

5.3 GC Specific Frequency
Given our somewhat uncertain photometric calibration we will not attempt a detailed analysis of the GC luminosity function for NGC 4649. However we can still usefully estimate the total number of GCs in the NGC 4649 system, and hence the GC specific frequency.
We have corrected the counts, in 0.25 mag bins, for our incompleteness as a function of galactocentric radius and magnitude. As mentioned in section 3.4, for i 23.6 we have essentially detected all GCs over the field-of-view of our observations. We need to make two corrections in order to estimate the total number of GCs in the system. The first concerns the missing areal coverage, i.e. beyond 230, and the second concerns GCs fainter than the limiting magnitude of i = 23.6.
By integrating the surface density profile from 60 to 230 we estimate 1007 GCs. Interior to 60 we assume a constant GC number density as adopted by Harris et al. (1991). This gives another 219 GCs. Extrapolating the surface density profile out to 10 arcmins or 48.6 kpc (such large radial extents have been observed for giant ellipticals in clusters) gives an additional 1421 GCs.

Thus we estimate the total number of GCs spatially to be 2647 but this is only to magnitudes of i = 23.6. In Figure 14 we show the completeness and background corrected GC luminosity function in 0.25 mag bins. The corrected counts show a steady Gaussian-like rise profile. We have fit the data using NGAUSS in IRAF and find a Gaussian profile of width = 1.30 0.1 mag (Harris et al. 1991 found = 1.29 and Larsen et al. 2001 measured = 1.28) and a peak or turnover magnitude of i = 23.17 0.15. The resulting Gaussian profile is shown in Figure 14 to be a reasonable fit to the data. This profile has about 62% of GCs brighter than i = 23.6 (the limit used in the density analysis) and 38% fainter.
We estimate the total number of GCs in the NGC 4649 system, integrated over all magnitudes and area, to be 3653. Various random errors are present in this estimate, but the largest uncertainty is probably associated with the extrapolation of the surface density to large radii not covered by our images. For example, if we had chosen 8 or 12 arcmins, instead of 10 arcmins, for the radial extent our estimate would change by 25%. In addition, the true surface density profile might not be a single power-law at all radii (Rhode & Zepf 2004; Dirsch et al. 2003) A remaining systematic error is that of the photometric calibration. These caveats aside, our final estimate of the total GC population is 3700 900 which is less than the 5100 1100 given in the compilation of Ashman & Zepf (1998). This value is based on observations by Harris et al. (1991). We derive a steeper density profile than Harris et al. , and hence a smaller GC population.
For an absolute magnitude of MV = –22.38, we estimate a global specific frequency of SN = 4.1 1.0. This is fairly typical of cluster ellipticals, and less than the 6.7 1.4 in Ashman & Zepf (1998). We also note that because the ratio of red-to-blue GCs decreases with radius (see section 5.1), the local SN value for red GCs will decrease relative to the blue SN with galactocentric radius.
6 Discussion and Conclusions
Our two filter imaging of the NGC 4649 GC system has returned a number of results. However, before turning to GCs, we confirm the findings of White et al. (2000) that any possible foreground extinction due to the disk of NGC 4647 is limited to be less than 0.1 mag. We also argue that the number of Ultra Compact Dwarfs associated with NGC 4649 is small, i.e. less than half a dozen.
With the caveat that the GMOS photometric calibration is not final, we detect GC colour bimodality with subpopulations at g–i = 0.865 0.005 and 1.167 0.004 (an extinction correction would make these colours 0.02–0.05 bluer).
As is commonly seen in other galaxies, the red GCs are concentrated towards the centre of the galaxy. They have a steep number density profile of slope –1.73 0.06 compared to the shallower slope of –1.04 0.09 for the blues. The varying ratio of red-to-blue GCs with radius can largely explain the overall GC system colour gradient.
For common radii, the underlying galaxy starlight has a similar density profile to the red GCs and colour to the mean colour of the red GCs. This suggests similar metallicities and/or ages (formation epoch) for the red GCs and the galaxy field stars. A luminosity-weighted spectral age based on Lick indices (Terlevich & Forbes 2002) suggests that the galaxy stars are old. The fact that the peak of the red GC luminosity function is fainter than that for the blue GCs (Larsen et al. 2001) is consistent with an old age for the GCs, as at a given age metal-rich GCs are expected to be fainter than metal-poor GCs due to line blanketing effects. Our forthcoming GMOS spectra will have sufficient S/N to derive Lick style ages for the brighter GCs (Bridges et al. 2004).
We estimate a total GC population of 3700 900, which corresponds to a specific frequency SN = 4.1 1.0. This is lower than the current value quoted in the literature.
7 Acknowledgments
We thank the Gemini support staff for their help. We thank R. Musgrave for help preparing some of the figures, and M. Pierce for his comments on the text. We also thank the referee, S. Larsen, for suggested improvements to the paper. These data were based on observations obtained at the Gemini Observatory, which is operated by the Association of Universities for Research in Astronomy, Inc., under a cooperative agreement with the NSF on behalf of the Gemini partnership: the National Science Foundation (United States), the Particle Physics and Astronomy Research Council (United Kingdom), the National Research Council (Canada), CONICYT (Chile), the Australian Research Council (Australia), CNPq (Brazil), and CONICET (Argentina). The Gemini program ID is 20020410-GN-2002A-Q-21/Q-13. This work was supported in part by a research grant provided to DAH by the Natural Science and Engineering Research Council of Canada.
8 Appendix A
The photometric data for the resolved objects in the field of NGC 4649 are given in Table A1. The magnitudes are not total magnitudes but derived from aperture photometry. The colours however should be largely unaffected.
| Table A1. Resolved Objects in the field of NGC 4649 | ||||||
|---|---|---|---|---|---|---|
| X | Y | RGC | i | g–i | i err | g–i err |
| (pix) | (pix) | (arcsec) | (mag) | (mag) | (mag) | (mag) |
| 3925 | 4531 | 127.7 | 21.81 | -0.30 | 0.03 | 0.04 |
| 3812 | 4545 | 121.1 | 24.24 | -0.35 | 0.10 | 0.12 |
| 3818 | 4511 | 120.3 | 21.32 | -0.02 | 0.03 | 0.04 |
| … | … | … | … | … | … | … |
Notes: the full table is available in the on-line version.
References
- [1]
- [2] Ashman, K. M., Zepf S. E., 1992, ApJ, 384, 50
- [3]
- [4] Ashman, K. M., Zepf S. E., 1998, Globular Cluster Systems, Cambridge University Press
- [5]
- [6] Beasley, M. A., Baugh, C. M., Forbes, D. A., Sharples, R. M., Frenk, C. S., 2002, MNRAS, 333, 383
- [7]
- [8] Bertin, E., Arnouts, S., 1996, A&AS, 117, 393
- [9]
- [10] Bridges, T. J., et al. 2003, in Extragalactic Globular Clusters and their Host Galaxies, JD6, IAU General Assembly, Sydney, July 2003 (astro-ph/0310324)
- [11]
- [12] Bridges, T. J., et al. 2004, in preparation
- [13]
- [14] Bridges, T. J., Ashman, K. M., Zepf, S. E., Carter, D., Hanes, D. A., Sharples, R. M., Kavelaars, J. J., 1997, MNRAS, 284, 376
- [15]
- [16] Brocato, E., Castellani, V., Poli, F., Raimondo, G., 2000, A&AS, 146, 91
- [17]
- [18] Burstein, D., Heiles, C., 1982, AJ, 87, 1165
- [19]
- [20] Cote, P., Marzke, R. O., West, M. J., 1998, ApJ, 501, 554
- [21]
- [22] Couture J., Harris W. E., Allwright J. W. B., 1991, ApJ, 372, 97
- [23]
- [24] Dirsch, B., Richtler, T., Geisler, D., Forte, J., Bassino, L., Gieren, W., 2003, AJ, 124, 1908
- [25]
- [26] Drinkwater, M., et al. 2003, Nature, 423, 519
- [27]
- [28] Forbes, D. A., Brodie, J. P., Grillmair, C. J., 1997, AJ, 113, 1652
- [29]
- [30] Forbes, D. A., Grillmair, C. J., Williger, G. M., Elson, R. A. W., Brodie, J. P., 1998, MNRAS, 293, 325
- [31]
- [32] Forbes, D. A., Forte J. C., 2001, MNRAS, 322, 257
- [33]
- [34] Gebhardt, K., Kissler-Patig, M., 1999, AJ, 118, 1526
- [35]
- [36] Geisler, D., Lee, M. G., Kim, E., 1996, AJ, 111, 1529
- [37]
- [38] Harris, W. E., Allwright, J. W. B., Pritchet, C. J., van den Bergh, S., 1991, ApJS, 76, 115
- [39]
- [40] Harris, W. E., 2001, in Star Clusters, Saas-Fee Advanced Course 28, edited by L. Labhardt and B. Binggel, p223
- [41]
- [42] Kundu, A., Whitmore, B. C., 2001, AJ, 122, 1251
- [43]
- [44] Larsen, S. S., Brodie, J. P., Huchra, J. P., Forbes, D. A., Grillmair, C. J., 2001, AJ, 121, 2974
- [45]
- [46] O’Sullivan, E., Forbes, D., Ponman, T., 2001, MNRAS, 328, 461
- [47]
- [48] Ratnatunga, K., Bahcall, J., 1985, ApJS, 59, 63
- [49]
- [50] Rhode, K., Zepf, S., 2001, AJ, 121, 210
- [51]
- [52] Rhode, K., Zepf, S., 2004, AJ, 127, 302
- [53]
- [54] Sarazin, C., Kundu, A., Irwin, J., Sivakoff, G., Blanton, E., Randall, S., 2003, ApJ, 595, 743
- [55]
- [56] Schlegel, D. J., Finkbeiner, D. P., Davis, M., 1998, ApJ, 500, 525
- [57]
- [58] Smith, J., et al. 2002, AJ, 123, 2121
- [59]
- [60] Stetson, P., 1987, PASP, 99, 191
- [61]
- [62] Terlevich, A., Forbes, D., 2002, MNRAS, 330, 547
- [63]
- [64] Tonry, J., et al. 2001, ApJ, 546, 681
- [65]
- [66] White, R., Keel, W., Conselice, C., 2000, ApJ, 542, 761
- [67]