To appear in the proceedings of the XXXIXth Rencontres de Moriond
“Exploring the Universe”, La Thuile, Italy, March 28-April
4, 2004
A NEW ESTIMATION OF THE ARCHEOPS ANGULAR POWER SPECTRUM
We present a refined angular power spectrum of the Cosmic Microwave Background (CMB) anisotropies using the Archeops last flight data. The estimation of the described here is performed using Xspect , a method which uses the cross-power spectra of the maps of 6 different detectors. It covers multipole range from to in 25 bins and confirms a strong evidence of a plateau followed by the presence of two Doppler peaks. Archeops was conceived as a precursor of the Planck HFI instrument by using the same optical design and the same technology for the detectors and their cooling. Since last publication, specific methods have been developed, extra bolometers were used and the sky coverage, of about 20%, is almost twice larger. We also present a comparison with first-year WMAP data both using individually spectra and by computing the cross-power spectrum of the two experiments.
1 Introduction
Archeops aaasee http://www.archeops.org, a pre-WMAP balloon–borne experiment, is a CMB bolometer-based instrument using Planck technology that fills a niche where previous experiments were unable to provide strong constraints due to insufficient sky coverage. Namely, Archeops seeks to join the gap in multipole between the large angular scales as measured by Cobe/Dmr and degree-scale experiments, typically for between 10 and 200. These results have been published in 2002 .
Archeops consists of a 1.5 m aperture diameter telescope and an array of 21 photometers maintained at mK which operates at 4 frequency bands centered at 143, 217, 353 and 545 GHz. The data were taken during the Arctic night of February 7, 2002 after the instrument was launched by CNES from Esrange base (Sweden). The entire dataset covers % of the sky. The refined analysis presented here was obtained with a subset of the data using the 6 most sensitive photometers in the CMB bands (143 and 217 GHz) and 19.9% of the sky.
2 Data processing
A detailed description of the instrument inflight performance is given in and the full data processing is described in . Here we only focus on the new refined analysis we developed with respect to .
The CMB dipole is the prime calibrator of the instrument. The absolute calibration error against the dipole measured by COBE/DMR and confirmed by WMAP is estimated to be less than 4% (resp. 8%) in temperature at 143 GHz (resp. 217 GHz).
One of the main assumptions of the power spectrum estimation method is that the detector noises are decorrelated. So it is capital to carefully and efficiently remove correlated noise and systematic effects. To suppress residual dust and atmospheric signals, the data are decorrelated using a linear combination of the high frequency photometers (353 and 545 GHz) and a synthetic dust timeline extrapolated from SFD observations at 100 m.
3 Beams
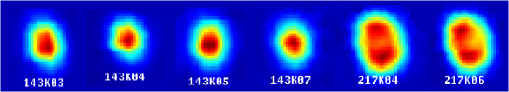
The beam shapes of the bolometers measured on Jupiter are quite irregular and so the effective beam transfer function for each bolometer must be carefully estimated. The asymmetry imposes to take into account the scanning strategy. The beam transfer functions are computed with simulations using the Asymfast method detailed in . This method is based on the decomposition of the beam into a sum of Gaussians which are easily convolved in the spherical harmonic space. This allows to deal with effective asymmetric beam patterns using the scanning strategy of the instrument.
Figure 1 presents the 6 CMB detectors used in this analysis. While the 143 GHz detector beams are quite elliptical with a FWHM of about 11 arcmin, the 217 GHz ones are rather irregular with a FWHM of about 13 arcmin.
4 Map-making and Galactic mask
Detector maps of 7 arcmin. resolution (HEALPix ) are produced using an optimal procedure called MIRAGE for each absolutely calibrated detector with data bandpassed between 0.1 and 38 Hz. The high-pass filter removes remaining atmospheric and galactic contamination, the low-pass filter suppresses non-stationary high frequency noise.
A Galactic mask is deduced from SFD map extrapolated at 353 GHz. The Galactic plane and the Taurus region are efficiently hiden by asking for an emission MJy.sr-1. So CMB maps cover 19.9% of the sky sampled by pixels.
5 Power spectrum estimation, Xspect
The estimation of the angular power spectrum is performed using an extension of the so-called ‘pseudo-’s estimators to the cross power spectrum called Xspect . The method computes directly the data ‘pseudo’ angular power spectrum, , linked to the power spectrum, by
| (1) |
where the mode-mode coupling kernel resulting from the cut sky is computed analytically for each cross power spectra and the beam transfer function for each bolometer. The pixel transfert function takes into account the smoothing effect induced by the finite size of the pixel. Filtering function is deduced from CMB simulations. Assuming no correlation between the noises of two different maps, the noise term vanishes and each cross spectrum is an unbiased estimation of the (see ).
After correction, the cross power spectra are optimally combined into an accurate estimation using only the ‘real’ cross spectra () which are not noise-biased. The combination method is based on the maximization of the likelihood,
| (2) |
where, is the analytically computed cross-correlation matrix of the cross power spectra and (see for the description of ).
With this method, we can use individual weighting schemes for each cross power spectra. Two different weighting schemes are combined to produce the smallest error bars. For the low- part of the spectrum, each pixel has equal weighting while in the high part the data are noise weighted (a weighting of the data was done in each pixel, where is the variance of the data in that pixel).
Figure 2 shows the mean angular power spectrum computed from 500 simulations of Archeops setup with analytically computed error bars. Simulations are done from realizations of the CMB sky convolved by the beams and realistic noise is added in timelines which are filtered with the same bandpass as for the data. We observe that the optimal combination of cross-power spectra is an unbiased estimate of the input CMB model for the angular power spectrum.
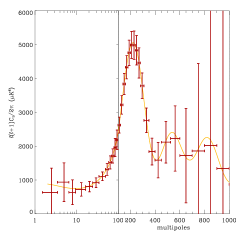
Results on the Archeops last flight data have been shown on the conference and will be soon published by the Archeops collaboration. Compared to the last publication , the spectrum presents smaller error bars on a larger multipole range (from to ) using a larger sky coverage and extra bolometers.
6 Systematics and Foregrounds contamination
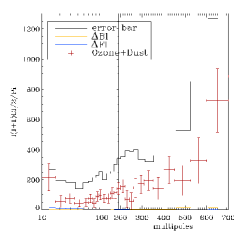
As a balloon-borne experiment, Archeops is exposed to the atmospheric emission. Moreover the Galactic emission at 143 and particularly at 217 GHz is low but not negligeable. Even if a carefull decorrelation of ozone and dust emission has been performed (see Sect. 2), uncertainties of their residuals in the CMB data are the major source of systematic errors.
To estimate the level of contamination coming from these foregrounds we cross-correlate the detectors used for the estimation with the 353 GHz Archeops channel. We thus check if there is still some Galactic and atmospheric contaminations in the CMB maps. Figure 2 summarizes the different sources of systematic errors. They remain bellow the sample variance at low multipoles and the instrumental noise at higher .
Tests of consistency have been computed in order to check the robustness of the results. They consist in computing the power spectrum using Xspect with different map resolutions, varying frequency cuts in bandpass filtering or increasing the Galactic mask coverage. They show a very stable power spectrum.
7 Comparison with WMAP
The Xspect method has been applied to the WMAP bbbhttp://lambda.gsfc.nasa.gov data restricted to the Archeops sky coverage. This was done in order to be able to compare the power spectrum of the two data sets individually coming from the same sky area. Taking into account a 8% calibration uncertainties of Archeops in temperature, we found that the two power spectra are compatible with by dof = 19.3/24. In parallel, we also cross-correlate the Archeops data with the WMAP ones. Archeops rescaled by 8% is correlated using Xspect to WMAP maps. The cross-power spectrum is found to be compatible with the WMAP one with by dof = 25.6/24. A more detailed analysis is under study.
References
References
- [1] Tristram M., Macías-Peréz J.F., Renault C., Santos D., 2004, Phys. Rev. D, submitted
- [2] Benoît, A. et al. 2003a, A&A, 399, L19
- [3] Benoît, A., Ade, P., Amblard, A. et al. 2004a, in preparation
- [4] Benoît, A., Ade, P., Amblard, A. et al. 2004b, in preparation
- [5] Fixsen, P. J., Cheng, E. S., Cottingham, D. A., et al. 1994, ApJ, 420, 445
- [6] Bennett, C. L. et al., 2003, ApJ, 148, 1
- [7] Schlegel, D., Finkbeiner, D., Davis, M. 1998, ApJ, 500, 525
- [8] Tristram M. et al., 2004, Phys. Rev. D, in press astro-ph/0310260
- [9] Gorski K. M., Hivon E. & Wandelt B. D., 1998, Proceed. of the MPA/ESO Conf., eds. A.J. Banday, R.K. Sheth and L. Da Costa, astro-ph/9812350
- [10] Yvon D. & Mayet F., 2004, A&A, accepted astro-ph/0401505
- [11] Peebles P.J.E., 1973, ApJ, 185, 431
- [12] Szapudi I. et al., 2001, ApJ, 548, L115
- [13] Hivon, E., Gorski, K. M., Netterfield, C. B., et al. 2002, ApJ, 567, 2