The proper motion of the isolated neutron star RX J1605.3+3249††thanks: Based on data collected at Subaru Telescope, which is operated by the National Astronomical Observatory of Japan.
We obtained deep optical imaging of the thermally emitting X-ray bright and radio-quiet isolated neutron star RX J1605.3+3249 with the Subaru telescope in 1999 and 2003. Together with archival HST images acquired in 2001 these data reveal a proper motion of mas/yr. This implies a relatively high spatial velocity and indicates that the star is unlikely to be re-heated by accretion of matter from the interstellar medium. Assuming that RX J1605.3+3249 is a young (105-106 yr) cooling neutron star, its apparent trajectory is consistent with a birth in the nearby Sco OB2 OB association at a location close to that derived for RX J1856.5-3754 and perhaps also to that of RX J0720.4-3125. This suggests that the X-ray bright part of ROSAT-discovered isolated neutron stars is dominated by the production of the Sco OB2 complex which is the closest OB association and a part of the Gould belt. The B and R magnitudes of the faint optical counterpart did not vary from 1999 to 2003 at B = 27.220.10. Its B-R colour index of +0.320.17 is significantly redder than that of other isolated neutron stars and the optical flux lies a factor 11.5 above the extrapolation of the X-ray blackbody-like spectrum. The red optical colour reveals the presence of an additional emitting component in the optical regime over the main neutron star thermal emission. We also discovered a small elongated H nebula approximately centered on the neutron star and aligned with the direction of motion. The width of the nebula is unresolved and smaller than 0.4″ for a length of about 1″. The shape of the Balmer emitting nebula around RX J1605.3+3249 is very different from those seen close to other neutron stars and should be confirmed by follow-up observations. We shortly discuss the possible mechanisms which could give rise to such a geometry.
1 Introduction
A decade ago, it was expected that a large number of isolated neutron stars (INSs) accreting from the interstellar medium would populate the ROSAT all-sky survey. It is now clear that this numerous population is not detected, although a handful of X-ray bright INSs were found. These INSs are radio-quiet, display thermal X-ray spectra with kT 40-100 eV, undergo little interstellar absorption indicating relatively small distances (few hundred parsecs) and are not associated with any supernova remnant (see reviews in Treves et al. treves2000 (2000), Motch mo2001 (2001) and Haberl haberl03 (2003)). Four of them exhibit pulsations with periods around 10 s (Haberl haberl04 (2004)). Most of these INSs now have identified faint optical counterparts or good candidates with B magnitudes in the range of 25.8 to 28.6. Their proximity and the apparent absence of strong non-thermal activity makes them unique laboratories for testing radiative properties of neutron star surfaces, high gravity and high magnetic field physics. This group of INSs could eventually bring important constraints on the debated equation of state of matter in neutron star interior.
Grating X-ray spectra of the two brightest ROSAT-discovered INSs RX J0720.4-3125 (Paerels et al. paerels2001 (2001)) and RX J1856.5-3754 (Burwitz et al. bur2001 (2001); Drake et al. drake02 (2002)) failed to reveal any spectral feature that could be used to derive a gravitational redshift, for instance. Their X-ray spectra are usually best fitted by a blackbody-like model. Further observations with the EPIC and RGS instruments on board XMM-Newton have revealed in several cases the presence of broad absorption lines with central energies in the 300-500 eV range on top of the blackbody energy distribution. These structures have been tentatively interpreted as proton cyclotron lines in magnetic fields of a few 1013 G (Haberl et al. haberl03a (2003), Haberl et al. haberl03b (2004) and van Kerkwijk et al. vk2004 (2004)). A puzzling problem is that none of the models fitting the X-ray data can adequately represent the optical-UV emission. Hydrogen atmosphere models usually overpredict optical flux while the Rayleigh-Jeans tails of the X-ray blackbody model typically fall short by a factor 10 at 550 nm (see Pavlov et al. pavlov2002 (2002) for a recent review). Understanding neutron star surface emission properties is therefore a prerequisite to derive reliable stellar radii.
When observed, the X-ray pulsations can be interpreted as due to a non uniform temperature distribution over the surface of a young cooling neutron star in strong magnetic field conditions or to variable absorption lines. The absence of detected pulsations in cases where evidence for strong magnetic fields exists is also not well understood.
The evolutionary status of these objects, old accreting neutron stars or relatively young cooling stars can be established by various means. A braking or an acceleration of the rotation period can in principle reveal the powering mechanism (Zane et al. zane02 (2002)). This exercise is however difficult and limited to pulsating stars. A potentially more efficient way is to search for proper motion using either deep optical imaging or by taking advantage of the high spatial resolution affordable by Chandra. Because of the strong dependency of Bondi-Hoyle accretion efficiency on velocity relative to the interstellar medium, a high proper motion will naturally exclude the accretion scenario, unless high interstellar densities are locally encountered. Significant spatial motions have been already detected from RX J1856.5-3754 (Neuhäuser neu01 (2001); Walter walter2001 (2001); Kaplan et al. kaplan02b (2002)) and from RX J0720.4-3125 (Motch et al. motch03 (2003)) which in both cases appear to exclude the accretion scenario.
We report here on deep optical imaging obtained at the Subaru telescope and Hubble Space Telescope of the optical counterpart of RX J1605.3+3249 (Motch et al. motch1999 (1999)) which is the third X-ray brightest of its class. An optical counterpart has been identified by Kaplan et al. (2003a ). Our observations covering a four year interval of time reveal the high proper motion of the object. A small but resolved H nebula is also detected.
2 Optical observations
Optical imaging has been obtained on two occasions with the Subaru telescope in 1999 and 2003, and in 2001 by the HST.
Data from the first epoch have been retrieved from the SMOKA database at the end of January 2003. These first observations were obtained between April 22 and May 15 1999 using the SuprimeCam instrument (Miyazaki et al. miyazaki1998 (1998)) mounted at the Cassegrain focus. This configuration which used a 3x2 CCD setup was in operation until July 1999 to perform an initial detailed testing of both the telescope and instrument. Each ST-002A SITe CCD had 2048 x 4096 square pixels with a size of 15 corresponding to 0.03″ on the sky at the Cassegrain focus. For our purpose, we only used CCD # 5 which fully contains the field of RX J1605.3+3249. Of the 3 filters used, B, R and broad H , there exist only flat-fields for the R band. The H filter NAL651 has a central wavelength of 6521Å and a full width of 325Å. Due to relatively large central wavelength variations with off axis angle (up to 100 Å), this filter was later decommissioned. Laboratory measurements show that the H line was in all cases well inside the filter band pass but due to the spatial inhomogeneities the exact transmission at H remains uncertain. Individual exposure times were 1200 s for the H and B filters and 900 s for the R band. The telescope was moved by about 12″ in both directions between two consecutive exposures. All individual images were corrected for bias using over-scan areas and the R band images were furthermore flat-fielded using well illuminated dome flats. Since only one bias exposure exists for these observations, we prefered to correct images using mean over-scan values in order to not increase photometric and positional errors. Individual images were then moved to a common frame using a well exposed single reference star located close to the neutron star position in order to minimize the effects due to the lack of correction for geometrical distortion. The images were then stacked using a statistical cosmic-ray event rejection criterion and finally rebinned with a 0.15″ pixel size.
The HST archive provided second epoch observations. We used the unfiltered CCD (50CCD aperture) image obtained on July 21 2001 which offers the highest sensitivity. Individual HST images were geometrically corrected, drizzled onto a reference image with a pixel scale half of the original one, filtered for cosmic-ray impacts and stacked together following the method outlined in Fruchter & Hook (fruchter2002 (2002)). These data were presented in Kaplan et al. (2003a ).
Third epoch images were all obtained on June 8 2003 with the FOCAS instrument (Kashikawa et al. kashikawa2002 (2002)) operated at the Cassegrain focus. The target was located on CCD # 2 which has the best cosmetic quality. We obtained series of B and R band exposures with integration times of 1200 s and 600 s respectively. Raw images were corrected for bias using average offset exposures and flat-fielded with dome flats. A dedicated IDL procedure then corrected individual images for geometrical distortion which otherwise could lead to errors of up to 2″ at the edge of the field of view. All images were moved to a common frame using a set of 9 reference stellar-like objects and then stacked together using a statistical criterion for rejecting cosmic-ray impacts.
Ground based observations were in general obtained in photometric conditions although some thin cirrus may have been present in 2003. The Subaru telescope is equipped with an atmospheric refraction correction prism at the telescope side. The difference in colours between the relatively red astrometric reference stars and the blue neutron star thus does not yield any significant difference in position.
The log of observations is listed in Table 1. FWHM seeings are given as measured on the summed images.
| Date | Instrument | Band | Exp. | Pixel | FWHM image | airmass |
|---|---|---|---|---|---|---|
| (ksec) | (″) | size (″) | range | |||
| 22 April 1999 | Suprime-Cam | H | 3.6 | 0.031″ | 0.57″ | 1.05 - 1.13 |
| 23 April 1999 | Suprime-Cam | B | 2.4 | 0.031″ | 0.64″ | 1.03 - 1.04 |
| 15 May 1999 | Suprime-Cam | R | 3.6 | 0.031″ | 0.40″ | 1.10 - 1.23 |
| 21 July 2001 | HST/STIS | 50CCD | 2.7 | 0.0254″ | 0.10″ | |
| 8 June 2003 | FOCAS | B | 7.2 | 0.104″ | 0.42″ | 1.06 - 1.34 |
| 8 June 2003 | FOCAS | R | 4.8 | 0.104″ | 0.58″ | 1.50 - 2.40 |
3 Photometry
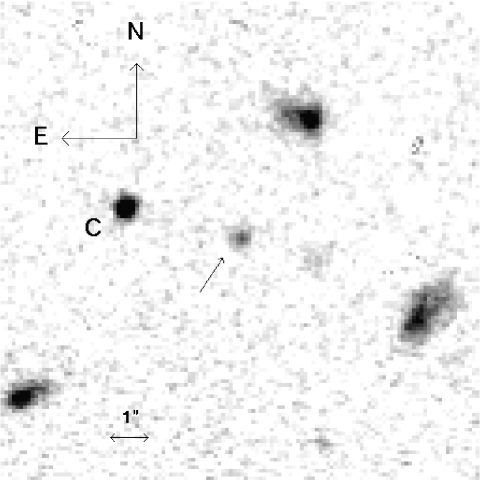
During the second Subaru observations, B and R photometric standard stars were repeatedly observed in the field of SA110-504 (Landolt landolt (1992)). However, zero point variability by about 0.1 mag rms reveals the probable presence of thin cirrus during that night. We thus used our photometric CFHT images obtained in 1998 and described in Motch et al. (motch1999 (1999)) to calibrate several B and R local photometric reference stars in addition to those already mentioned in that paper. Comparing CFHT and Subaru 2003 zero points shows that the 2003 images were indeed absorbed by 0.15 mag in B and R. Magnitudes were computed using a 2-d Gaussian fitting process taking into account possible sky background spatial variability. The magnitudes of RX J1605.3+3249, listed in Table 2 are generally consistent with those reported by Kaplan et al. (2003a ) from HST/STIS photometry. Errors quoted are one sigma and take into account uncertainties in colour transformation and for the 1999 B value errors due to the absence of flat-field correction. There is no evidence for flux variability on time scales of years. We show in Fig. 1 the summed B image obtained in 2003 at the Subaru telescope with FOCAS.
| Epoch | B | R |
|---|---|---|
| April-May 1999 | 27.25 0.19 | 26.90 0.15 |
| June 2003 | 27.22 0.10 | 26.90 0.14 |
Using the best determined value in 2003 we find BR = +0.32 0.17. This colour index is significantly redder than that of RX J1856.5-3754 (BR = 0.61 0.13, van Kerkwijk & Kulkarni 2001a ) and maybe also RX J0720.4-3125 (BR = 0.3 0.4, Kulkarni & van Kerkwijk KvK98 (1998)).
4 Proper motion study
Comparing positions obtained by three different instruments with different band passes requires some caution. We estimated the errors resulting from uncorrected geometrical distortions by measuring the dispersion in position of a number of bright stellar-like objects on individual Subaru images. For the 1999 observations, the rms error is 12 mas in the B filter (4 objects) and 7 mas in the H and R filters (5 objects). Geometrical correction of the 2003 FOCAS frames brings down the dispersion from about 12 mas to 4.6 mas. Therefore, the absence of available distortion mapping for the Suprime-Cam instrument mounted at the Cassegrain focus has little impact. However, the geometrical correction of FOCAS images indeed improved the astrometric quality.
We searched for proper motion using the sum of the B and R band images in 1999, the HST 50CCD image and the B band FOCAS image in 2003 which provide the best compromise between sensitivity and image quality. A group of astrometric reference objects were selected on the HST image for their stellar-like profile or very small spatial extension. We used a 2-d Gaussian fitting process allowing for sky gradient to measure accurate positions. Centering accuracies are listed in Table 3. The Subaru 1999 and 2003 images were scaled and rotated to the HST frame using 9 and 7 such astrometric reference stars respectively. After transformation to the HST frame, reference objects had mean position residuals of the order of 16 mas and 25 mas for the Surprime-Cam and FOCAS, respectively. These residuals are larger than expected from centering position errors only and probably reflect some remaining low level large scale field distortion. The Subaru positional accuracies transformed to the HST reference frame take these systematic errors into account.
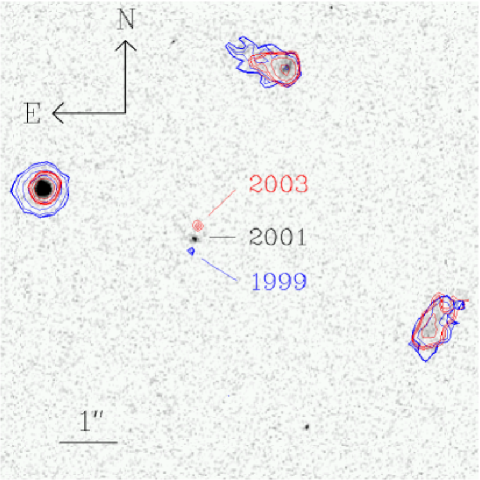
A proper motion solution expressed in terms of total motion and direction was then fitted to the three recorded positions of RX J1605.3+3249 using a minimum algorithm. The best fit shown in Fig. 2 is obtained for mas/yr with a direction of motion of 9.86° 5.65° eastward from north. This corresponds to ()=24.716.3 mas/yr and =142.415.4 mas/yr. All errors are quoted here for a 90% confidence level on one parameter. The detected proper motion is thus highly significant and overall measurement and systematic errors appear negligible (see Fig. 3). The part of the apparent displacement due to solar motion should be small, of the order of 5 mas in right ascension and 11 mas in declination at 100 pc.
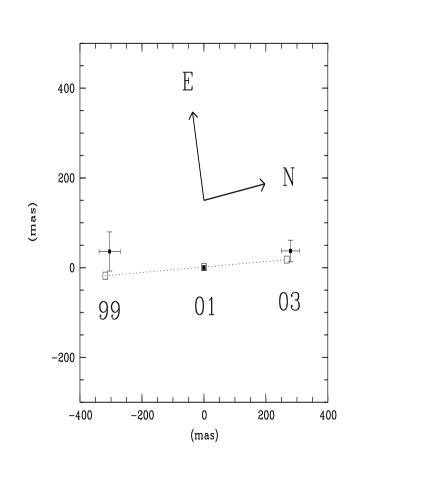
.
Most of the proper motion of RX J1605.3+3249 is in galactic longitude ( = 137 mas/yr). The source is however slowly moving away from the galactic plane with = 37 mas/yr. The unknown distance and radial velocity of the neutron star does not allow us to derive the possible position of its birth place with very good accuracy. In order to constrain the origin of RX J1605.3+3249 we assumed a maximum age of 106 yr, compatible with possible cooling times of a young neutron star with kT 100 eV (see below, Yakovlev & Pethick yakovlev2004 (2004)), distances in the range of 100 pc to 500 pc and radial velocities in the range of 700 km s-1. Considering the short flight time, we also neglect the effects of the galactic potential. The only nearby OB association overlapping with some backward trajectories is the upper Scorpius-Centaurus region belonging to the Sco OB2 complex. Amazingly, Walter & Lattimer (wl2002 (2002)) derive a similar birth place for RX J1856.5-3754 in the upper Scorpius while Motch et al. (motch03 (2003)) speculate on a possible birth place in the lower Centaurus-Crux part of the same Sco OB2 complex for RX J0720.4-3125.
| Sub. 1999 | HST 2001 | Sub. 2003 | |
|---|---|---|---|
| Reference stars | 8 | 3 | 9 |
| RX J1605.3+3249 | 25 | 4 | 10 |
5 An H nebula
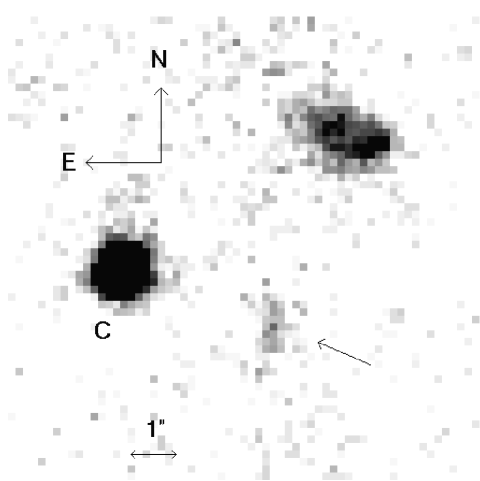
We show in Fig. 4 the H image obtained in 1999. An extended and elongated source is clearly seen at the position of RX J1605.3+3249. The emission is detected on individual images whose centers were shifted by several hundreds of pixels and is thus unlikely to be of instrumental origin or caused by the absence of flat-field correction. The direction of largest extent of the nebula is close to that of the apparent trajectory. H nebulae have been discovered around a small number of isolated neutron stars (see Chatterjee & Cordes cc2002 (2002) for a recent review). They have in general a well defined arc-like shape extending several tens of arcseconds on the sky which can be interpreted as due to a bow shock created by the interaction of the high velocity pulsar wind with the interstellar medium. In the case of RX J1856.5-3754 H emission could also be due to X-ray ionization (van Kerkwijk & Kulkarni 2001b ). The bright cylindrical head of the Guitar nebula produced by the radio pulsar B2224+65 (Cordes et al. cordes93 (1993)), although significantly larger, could be a scaled-up analogue of the nebula seen here. However, we shall see below that this is in fact unlikely and that the shape and probably also the origin of the nebula detected around RX J1605.3+3249 are unique.
We tried to constrain the actual size and orientation of the H emission by fitting to the observed image a model consisting of a cylinder convolved with the point spread function. Owing to the poor spatial resolution available, we assumed a simple uniformly emitting bar shape characterized by its length, width and orientation. The Gaussian parameters of the point spread function were derived from the nearby star ”C” which is unresolved in the HST image and is a likely dwarf M star (Motch et al. motch1999 (1999)). We used a 2-d minimum fitting process taking into account CCD readout noise and counting statistics. The nebula seems slightly wider than would be expected from the PSF alone. However, the resulting width of the bar depends on whether the background is locally estimated or computed from a wider area as well as on the overall size of the fitted image. The possible width ranges from 0″, i.e. unresolved, to 0.4″. The best fit length is 1.1″ with an inclination angle of 4.5° 5.5° (1 error) eastward from north, consistent with the apparent direction of motion.
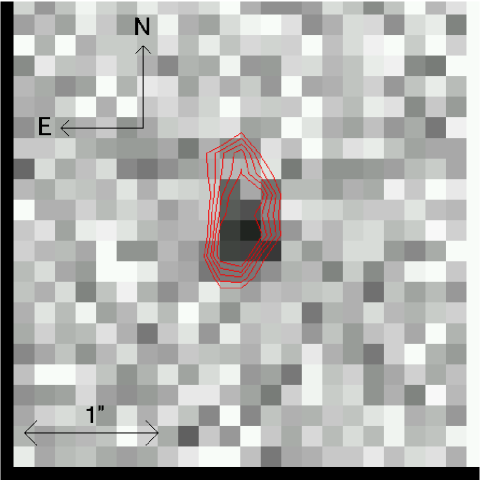
The H nebula is approximately centered on the neutron star (see Fig. 5) with a slightly larger extent ( 0.6″) toward the direction of motion. A total of 7 stellar like objects were used to move the H image onto the combined R+B image with a rms positional accuracy of 12 mas. The off center position of the neutron star with respect to its associated nebula is thus significant.
In the absence of flat-field and filter calibration at the position of RX J1605.3+3249 we can only very roughly estimate the H flux from the nebula. We assume a mean filter transmission of 80% similar to that of the H filter currently mounted on FOCAS and a total calibration error of 20%. The integrated flux from the nebula amounts to 2.40.6 10-5 photon s-1 cm-2 or 7.21.8 10-17 erg s-1 cm-2. Although much less extended than that of RX J1856.5-3754 (van Kerkwijk & Kulkarni 2001b ), the H surface brightness of RX J1605.3+3249 seems about 10 times brighter (for a 0.4″ width) allowing its detection in a 1h exposure only on an 8-m class telescope.
6 Discussion
6.1 Proper motion
RX J1605.3+3249 displays the second largest proper motion of the three objects of this class for which measurements exist; RX J1856.5-3754 has mas/yr (Neuhäuser neu01 (2001); Walter walter2001 (2001); Kaplan et al. kaplan02b (2002)) and RX J0720.4-3125 has 12 mas/yr (Motch et al. motch03 (2003)). For RX J1605.3+3249, a proper motion of mas/yr corresponds to a transverse velocity of VT 68 (d/100 pc) km s-1 with a small component due to solar motion of 5.5(d/100 pc)-1 km s-1.
A bolometric luminosity of (d/100 pc)2 erg s-1 (Motch et al. motch1999 (1999)) derived from the blackbody fit to the ROSAT data, if powered by accretion from the interstellar medium, would require a local particle density 170 (d/100 pc)5 cm-3. This furthermore assumes that there is no radial velocity component. Such ISM densities are much larger than the average density toward the source; 0.3 (d/100 pc)-1 cm-3, estimated from the hydrogen column density required by the blackbody fit of the ROSAT X-ray spectrum (NH 1020 cm-2, Motch et al. motch1999 (1999)). Following the arguments in Motch et al. (motch03 (2003)) we can conclude that like RX J0720.4-3125, RX J1605.3+3249 is unlikely to be powered by accretion from the ISM unless extremely rare conditions are met. Similar conclusions were reached by van Kerkwijk & Kulkarni (2001b ) for RX J1856.5-3754 based on the modeling of its associated H nebula.
6.2 Is Sco OB2 the main provider of the brightest radio quiet INSs ?
RX J1605.3+3249 is thus the third case of X-ray bright and radio quiet INS for which the accretion scenario can be excluded with relatively high confidence. This confirms the conclusion that the thermally emitting neutron stars detected by ROSAT are in general not powered by accretion from the interstellar medium but are rather young cooling neutron stars with typical ages ranging from 105 to 106 yr. The absence of accurate distance estimates, radial velocity information and the still relatively large errors on proper motion direction of RX J1605.3+3249 and RX J0720.4-3125 do not allow us to draw unambiguous conclusions on the birth place of these neutron stars. There are however relatively strong hints that the three X-ray brightest ROSAT discovered INSs, RX J1856.5-3754, RX J1605.3+3249 and possibly RX J0720.4-3125 were all born in the Sco OB2 association. With a mean distance of 120-140 pc (de Zeeuw et al. dezeeuw99 (1999)) this rich OB association is the closest to earth and belongs to the large structure of young stars known as the Gould belt. Since most OB stars are found in associations, we expect that statistically at least, the fact that a neutron star trajectory crosses an OB association at a time roughly consistent with the cooling time is evidence for its birth place. Some other middle-aged (age 4.25 Myr) nearby (d 350 pc) neutron stars have tentative birth places, Geminga possibly in Orion OB1 (Caraveo et al. caraveo1996 (1996)), PSR J1932+1059 also in Sco OB2 (Hoogerwerf et al. hooger2001 (2001)). The revised distance of PSR B0656+14 (d 290 pc Brisken et al. brisken2003 (2003)) could also suggest a birth place in Orion OB1. The tangential velocities of the X-ray bright and radio-quiet INSs have relatively modest values for neutron star standards, 22060 km s-1 for RX J1856.5-3754 (Kaplan et al. kaplan02b (2002)), 50 (d/100 pc) km s-1 for RX J0720.4-3125 (Motch et al. motch03 (2003)) and 68 (d/100 pc) km s-1 for RX J1605.3+3249. Their velocities are within the range observed for radio pulsars and, assuming distances of 200 pc for RX J0720.4-3125 (Motch et al. motch03 (2003)) and 300 pc for RX J1605.3+3249 (Kaplan et al. 2003a ), suggest that they belong rather to the slow part of the pulsar population (Arzoumanian et al. arzou2002 (2002)).
Although still based on small number statistics, it seems that our current proximity to Sco OB2 may be the reason why we can detect in relatively large numbers X-ray bright and radio quiet neutron stars at small distances. In contrast, Orion OB1, the other major OB association in our neighborhood may have provided Geminga and PSR B0656+14 but so far no ROSAT INS. Matching the flight time from Orion (d 500 pc) and the cooling time implies large radial velocities ( 700 km s-1). Such large radial velocities compared to tangential (120 km s-1 for Geminga) could be understood as due to a selection effect since we only detect in X-rays the neutron stars born in Orion which are young, hot and fast enough. The possibility is thus open that radio quiet and hot neutron stars may preferentially be born with low kick velocities. However, before such conclusions can be drawn, proper motions and distances of fainter objects must be measured.
6.3 Optical to X-ray energy distribution
We show in Fig. 6 the overall X-ray to optical distribution of RX J1605.3+3249. The model describing the X-ray continuum is a simple blackbody fit to EPIC pn data obtained in small window mode through the thick filter during revolution 589. We preferentially used these data because of their low pile-up fraction and high quality of the calibrations available for this instrumental setting compared to others, especially the thin filter which suffers from some transmission uncertainties at low energies. The blackbody fit gives a of 196 for 174 dof. Adding a Gaussian line with a fixed energy of 0.45 keV (van Kerkwijk et al. vk2004 (2004)) significantly improves the fit, reducing the at 167.5 for 172 dof. The best fit Gaussian equivalent width is 29.5 eV with a width 180 eV. For simplicity we plot in Fig. 6 the best blackbody-only fit with kT = 98.9 eV and R∞ = 0.9 (d/100 pc) km.
As for all X-ray dim optically identified INSs, the optical continuum of RX J1605.3+3249 lies above the Rayleigh-Jeans tail of the blackbody-like spectrum responsible for the X-ray energy distribution. This has been sometimes used as an argument in favour of the existence of a second cooler thermal component which would hardly contribute in X-rays but could account for most of the optical emission (see Pavlov et al. pavlov2002 (2002)). In the case of RX J1856.5-3754 , for which there exists an accurate distance estimate based on a measured parallax, the low temperature implies a larger radius of the emitting area more consistent with equations of state with conventional hadronic matter (Burwitz et al. bur2003 (2003)). The two-blackbody model can naturally represent the strong emissivity anisotropy induced by a large dipolar magnetic field. In this framework, the hot thermal component would represent radiation emitted from the polar regions while the cooler one would be emitted by the equatorial regions. However, in the case of RX J1605.3+3249 (van Kerkwijk et al. vk2004 (2004)) and even more acutely for RX J1856.5-3754 (Ransom et al. ransom02 (2002)), the absence of pulsations down to low pulse fractions puts severe constraints on the geometrical configuration and amplitude of gravitational deflection. Standard hydrogen atmosphere models, while usually fitting correctly the X-ray energy distribution, have the common problem to largely overpredict the optical continuum. Thin hydrogen atmospheres such as proposed by Motch et al. (motch03 (2003)) for RX J0720.4-3125 can account for the optical to X-ray energy distribution with a single component but have the drawback of assuming the presence of an ad hoc amount of light elements on the surface of the neutron star. A high surface reflectivity in the X-ray energy range such as in the case of condensed atmospheres might also solve the X-ray - optical discrepancy (Burwitz et al. bur2003 (2003)).
The B-R colour index of RX J1605.3+3249 (BR = +0.32 0.17) is significantly redder than that of RX J1856.5-3754 which essentially follows a F() continuum. Our B band flux is consistent with that measured in the wide HST/STIS 50CCD band pass whereas our R band flux is somewhat above that computed for the HST/STIS F28X50LP long pass filter. At present, the reasons for this small discrepancy (formally a 2.1 effect) are unclear. Due to flux calibration uncertainties, the contribution of the nebula detected in the broad H filter to the R band flux is difficult to estimate. The fact that the nebula remains undetected in the R band images suggests that the effect is not strong. The very small NH required to fit the X-ray data (NH 2.2 1020 cm-2, van Kerkwijk et al. vk2004 (2004)), corresponds to a maximum E(B-R) of about 0.09, too small to account for the red colour index if an intrinsic Rayleigh-Jeans spectrum is assumed.
The improved spectral resolution clearly shows that the energy distribution in the optical range does not follow a Rayleigh-Jeans tail and reveals the presence of an additional component. A similar situation exists in RX J0720.4-3125 where a power law with an index slightly softer than Rayleigh-Jeans is required to fit the optical/UV continuum (Kaplan et al. 2003b ) while still keeping relatively blue overall colours. Generally, the BR colour index of RX J1605.3+3249 appears similar to that of two middle aged neutron stars, Geminga (BR 0.2, Bignami et al. bignami1993 (1993)) and PSR B0656+14 (BR = 0.620.11, Komarova et al. komarova2003 (2003)). In these two pulsars, however, magnetospheric activity exists in the X-ray energy range (Zavlin & Pavlov zavlin04 (2004)). Mignami et al. (mignami1998 (1998)) find evidence for a peak at 6000Å which they interpret as the possible signature of cyclotron emission. For PSR B0656+14, a single power law component can in principle explain both the hard X-ray tail and the excess of optical and near-infrared emission above a Rayleigh-Jeans component (Pavlov et al. pavlov2002 (2002)). Assuming that a similar mechanism is at work in RX J1605.3+3249, we computed that a single powerlaw component with a photon index of about 1.5, similar to that found in PSR B0656+14, could account for both the 2-10 keV EPIC pn flux 1 upper limit (1.8 10-14 erg s-1 cm-2) and for the B to R band flux. The magnetospheric activity of RX J1605.3+3249 may thus well be a scaled down version of that of PSR B0656+14.

6.4 Nature of the H nebula
H nebulae have been discovered around about six INSs, ordinary or millisecond pulsars. In all cases an arc-shaped emission extending over several tens of arcseconds is visible with the main nebula axis roughly aligned with the direction of proper motion (Chatterjee & Cordes cc2002 (2002)). Supersonic pulsar motion can create a bow shock nebula when the high velocity wind which carries away most of the rotational kinetic energy interacts with interstellar medium. The shock surface is located where ram pressure balance between the pulsar wind and the interstellar medium takes place. H emission then mainly arises from collisional excitation of neutrals by shocked electrons and protons. In many cases, the shape of the nebula can be reasonably well fitted by the model of Wilkin (wilkin1996 (1996)) which assumes an isotropic wind and rapid radiative cooling. Some asymmetric nebulae provide evidence toward density gradients in the ISM, pulsar wind anisotropy or both (see e.g. Gaensler et al. gaensler2002 (2002)).
No such arc-shaped nebula is seen around RX J1605.3+3249. Our relatively low detection sensitivity could explain part of the observed differences. However, in the known bow shock nebulae Balmer emission usually shows the highest surface brightness ahead of motion. At the apex the nebula extends perpendicular to the trajectory thus tracing the shape of the front-shocked region. In the present case, the H emission appears elongated in the direction of motion. Such a geometry cannot be matched by any isotropic wind model since one would naively expect a larger extent in the direction perpendicular to the motion than in the direction of motion. In the absence of detailed modeling, it is unclear whether pulsar wind beaming could account for the observed geometry.
If no strong wind blows from RX J1605.3+3249 H emission could still arise from an X-ray ionized nebula. Blaes et al. (blaes1995 (1995)) have shown that ionization of the local interstellar medium by the X-ray and UV radiation field of the hot neutron star combined with proper motion would produce cometary HII regions. Their properties depend on the details of the ionization, recombination, heating and cooling rates (see van Kerkwijk & Kulkarni 2001b , for a detailed modeling including dynamical effects). The isotropic ionizing field should create a spherical head nebula centered on the neutron star with an extent in the direction perpendicular to motion at least as large as in the direction of motion, similar to the case of bow shock nebulae. Also, because of the rather long cooling time, most of the H emission will occur in the wake of the neutron star, again at variance with the observation. Scaling the observed H surface brightness to that of RX J1856.5-3754 (van Kerkwijk & Kulkarni 2001b ) would imply local densities of the order of 9 (d/100 pc)-1 cm-3, much larger than expected for normal ISM densities. Such high densities would however yield a cooling time of 6 (d/100 pc) yr roughly comparable to the nebula crossing time 4 yr as estimated from its angular size ( 600 mas ahead) and observed proper motion.
The geometry of the nebula is in principle consistent with that expected from a bipolar jet. Such jets have been observed in X-rays from very young neutron stars, the best documented cases being those of the Crab (Weisskopf et al. weisskopf2000 (2000)) and of the Vela pulsar (Helfand et al. helfand2001 (2001)). Their power-law X-ray spectra are interpreted as due to optically thin synchrotron emission from ultra-relativistic particles. Obviously, some other mechanism must be invoked to explain H emission at redshift 0.03 (the maximum allowed by the filter band pass) from such a jet. One possibility could be the interaction of the beamed particle flow with the interstellar medium. If the main direction of the H nebula would indeed trace the spin axis, RX J1605.3+3249 would be another case of apparent alignment of spin axis and proper motion direction (Lai et al. lai2001 (2001)).
Alternatively, if the main axis of the nebula would exactly follow the trajectory, as would be the case for an X-ray ionized or bow shocked nebula unperturbed by the interstellar medium, the apparent proper motion direction should not be exactly aligned with the nebula as a result of solar motion. In principle, this effect could be used to derive independent estimates of the distance of the neutron star. However, the accuracy with which we can determine the angle difference = 4.6° 6.3° is not yet large enough to be useful. Nevertheless, the sign of the angle difference between the nebula and the apparent proper motion is that expected due to the different positions of the Sun between 1999 and 2003. Using the Sun velocity parameters determined by Hipparcos (Dehnen & Binney db98 (1998)) we compute an angle difference = 1.3°(d/100 pc)-1 .
Considering the absence of calibration of the instrumental H setting, it is clear that the astonishing geometry of the nebula needs to be confirmed and specified by other observations before extensive conclusions on its nature can be drawn.
7 Conclusions
Our deep Subaru imaging reveals the high proper motion of RX J1605.3+3249 and thus confirms the optical identification proposed by Kaplan et al. (2003a ). The corresponding large space motion most probably excludes accretion from the interstellar medium as the source of the radiated X-ray energy. Similarly to RX J1856.5-3754 and RX J0720.4-3125, RX J1605.3+3249 is likely a cooling neutron star with an age younger than 106 yr. Evidence for residual magnetospheric activity comes from the relatively red BR index which indicates the presence of an excess of red light above the expected Rayleigh-Jeans tail, a picture comparable to that seen in Geminga or in PSR B0656+14. A small size H nebula is detected approximately centered on the neutron star and extended along the direction of the trajectory. The lack of photometric calibration and flat-fielding does not make it possible to draw stringent conclusions on its nature. However, the small size and geometry of the nebula are unique and no standard bow-shock or X-ray ionisation model can account for these peculiarities in a straightforward manner. Forthcoming deeper observations should allow us to confirm the unusual features detected in 1999. Finally, we find that RX J1605.3+3249 may have been born in the same nearby Sco OB2 OB association as RX J1856.5-3754 and also perhaps RX J0720.4-3125. This could imply that the bright part of the observed LogN-LogS curve for X-ray dim isolated neutron stars is dominated by the production of this single OB association.
Acknowledgements.
We thank the Subaru telescope team for providing access to the instrument and for help during the observations. We are particularly indebted to Dr. Yutaka Komiyama and Dr. Masafumi Yagi for carrying out the 1999 observations. Part of the data presented here were based on observations made with the NASA/ESA Hubble Space Telescope, obtained at the Space Telescope Institute, which is operated by the Association of Universities for Research in Astronomy, Inc. under NASA contract NAS 5-26555. We thank an anonymous referee for useful comments.References
- (1) Arzoumanian, Z., Chernoff, D. F., Cordes, J. M. 2002 ApJ, 568, 289
- (2) Bignami, G.F., Caraveo, P.A., Mereghetti, S. 1993, Nature, 361, 704
- (3) Blaes, O., Warren, O., Madau, P. 1990, ApJ, 454, 370
- (4) Brisken, W.F., Thorsett, S.E., Golden, A., Goss, W.M. 2003, astro-ph/0306232
- (5) Burwitz, V., Zavlin, V.E., Neuhäuser, R., et al. 2001, A&A, 379, 35
- (6) Burwitz, V., Haberl, F., Neuhäuser, R., et al. 2003, A&A, 399, 1109
- (7) Caraveo, P. A., Bignami, G. F., Mignani, R., Taff, L. G. 1996, ApJ, 461, L91
- (8) Chatterjee, S., Cordes, J.M. 2002, ApJ, 575, 407
- (9) Cordes, J.M., Romani, R.W., Lundgren, S.C. 1993, Nature, 362, 133
- (10) de Zeeuw, P. T., Hoogerwerf, R., de Bruijne, J. H. J., Brown, A. G. A., Blaauw, A. 1999, AJ, 117, 354
- (11) Drake, J.J., Marshall, H.L., Dreizler, S., et al. 2002, ApJ, 572, 996
- (12) Dehnen, W., Binney, J.J. 1998, MNRAS, 298, 387
- (13) Fruchter, A.S., Hook, R.R. 2002, PASP, 114, 144
- (14) Gaensler, B.M., Jones, D.H., Stappers, B.W. 2002, ApJ, 580, L137
- (15) Haberl, F. 2003, in High Energy Studies of Supernova Remnants and Neutron Stars, ed. W. Becker and W. Hermsen, COSPAR Symposium, Houston 2002, in press (astro-ph/0302540)
- (16) Haberl, F., Schwope, A. D., Hambaryan, V., Hasinger, G., Motch, C. 2003, A&A, 403, L19
- (17) Haberl, F., Zavlin, V.E., Trümper, J., Burwitz, V. 2004, A&A in press, astroph-0312413
- (18) Haberl, F. 2004, in proceedings of the ”XMM-Newton EPIC Consortium meeting, Palermo, 2003 October 14-16”, published in Memorie della Societa Astronomica Italiana, astro-ph/0401075
- (19) Helfand, D.J., Gotthelf, E.V., Halpern, J.P. 2001, ApJ, 556, 380
- (20) Hoogerwerf, R., de Bruijne, J. H. J., de Zeeuw, P. T. 2001, A&A, 365, 49
- (21) Kaplan, D.L., van Kerkwijk, M.H., Anderson, J. 2002, ApJ, 571, 447
- (22) Kaplan, D.L., Kulkarni, S.R., van Kerkwijk 2003a ApJ, 588, L33
- (23) Kaplan, D.L., van Kerkwijk, M.H., Marshall, H.L., et al. 2003b, ApJ, 590, 1008
- (24) Kashikawa, N., Aoki, K., Asai, R., et al. 2002 PASJ, 54, 819
- (25) Komarova, V., Shibanov, Yu, Zharikov, S., et al. 2003, in Pulsars, AXPs and SGRs observed with BeppoSAX and Other Observatories, Proceedings of the International Workshop held in Marsala, September 23-25, 2002. Edited by G. Cusumano, E. Massaro, T. Mineo. Roma, Italy: Aracne Editrice, July 2003, ISBN 88-7999-514-6, p. 77-80.
- (26) Kulkarni, S.R., van Kerkwijk, M.H. 1998, ApJ, 507, L49
- (27) Lai, D., Chernoff, D.F., Cordes, J.M. 2001, ApJ, 549, 1111
- (28) Landolt, A.U. 1992, AJ, 104, 340
- (29) Mignami, R.P., Caraveo, P.A., Bignami, G.F. 1998, A&A, 332, L37
- (30) Miyazaki, S., Sekiguchi, M., Imi, K., et al. 1998, SPIE, 3355, 363
- (31) Motch, C., Haberl, F., Zickgraf, F.-J., Hasinger, G., Schwope, A. D. 1999, A&A, 351, 177
- (32) Motch, C. 2001, in AIP conference proceedings vol 599, ed. N.E. White, G. Malagutti and G.G.C. Palumbo, p. 244
- (33) Motch, C., Zavlin, V.E., Haberl, F. 2003, A&A, 408, 323
- (34) Neuhäuser, R. 2001, AN, 322, 3
- (35) Paerels, F., Mori, K., Motch, C., et al. 2001, A&A, 365, 298
- (36) Pavlov, G.G., Zavlin, V.E., Sanwal, D. 2002, in Neutron Stars, Pulsars and Supernova, ed. W. Becker, H. Lesch and J. Trümper, MPE Report 278, p. 273 (astro-ph/0206024)
- (37) Ransom, S.M., Gaensler, B.M., Slane, P.O. 2002, ApJ, 570, L75
- (38) Treves, A., Turolla, R., Zane, S., Colpi, M. 2000, PASP, 112, 297
- (39) van Kerkwijk, M.H., Kulkarni, S.R. 2001, A&A, 380, 221
- (40) van Kerkwijk, M.H., Kulkarni, S.R. 2001, A&A, 378, 986
- (41) van Kerkwijk, M.H., Kaplan, D.L., Durant, M., Kulkarni, S.R., Paerels, F. 2004, ApJ, in press, astro-ph/0402418
- (42) Walter, F.M. 2001, ApJ, 549, 433
- (43) Walter, F.M., Lattimer,J.M. 2002, ApJ, 576, L45
- (44) Weisskopf, M. C., Hester, J. J., Tennant, A. F., et al. 2000, ApJ, 536, L81
- (45) Wilkin, F.P. 1996, ApJ, 459, L31
- (46) Yakovlev, D.G., Pethick, C.J., 2004, Ann. Rev. Astron. Astrophys, in press
- (47) Zane, S., Haberl, F., Cropper, et al. 2002, MNRAS, 334, 345
- (48) Zavlin, V.E., Pavlov, G.G., Shibanov, Yu.A. 1996, A&A, 315, 141
- (49) Zavlin, V.E., Pavlov, G.G. 2004, in Memorie della Societa’ Astronomica Italiana, the Proceedings of the EPIC Consortium (Palermo 2003)