Triggering the Formation of Halo Globular Clusters with Galaxy Outflows
Abstract
We investigate the interactions of high-redshift galaxy outflows with low-mass virialized clouds of primordial composition. While atomic cooling allows star formation in objects with virial temperatures above K, “minihalos” with virial temperatures below this threshold are generally unable to form stars by themselves. However, the large population of high-redshift starburst galaxies may have induced widespread star formation in neighboring minihalos, via shocks that caused intense cooling both through nonequilibrium formation and metal-line emission. Using a simple analytic model, we show that the resulting star clusters naturally reproduce three key features of the observed population of halo globular clusters (GCs). First, the K maximum virial temperature directly corresponds to the upper limit on the stellar mass of such clusters, a feature that can not be explained by any GC destruction mechanism. Secondly, the momentum imparted in such interactions is sufficient to strip the gas from its associated dark matter halo, explaining why GCs do not reside in the dark matter potential wells that are ubiquitous in galaxies. Finally, the mixing of ejected metals into the primordial gas provides a straightforward mechanism to explain the dex homogeneity of stellar metallicities within a given GC, while at the same time allowing for a large spread in metallicity between different clusters. To study the possibility of such “fine grained” mixing in detail, we use a simple one-dimensional numerical model of turbulence transport to simulate mixing in cloud-outflow interactions. We find that as the shock shears across the side of the cloud, Kelvin-Helmholtz instabilities arise, which cause turbulent mixing of enriched material into of the cloud. Such estimates ignore the likely presence of large-scale vortices, however, which would further enhance turbulence generation. Thus the global nature of mixing in these interactions is multidimensional, and quantitative predictions must await more detailed numerical studies.
1. Introduction
Most of the Milky Way’s 150 globular star clusters are old. Their ages have been reliably determined from main sequence turnoff points, with the firm result that the majority formed 10-13 Gyr ago and thus are coeval with the oldest stars in the Galaxy (Krauss & Chaboyer 2003, and references cited therein). Furthermore, the existence of similar systems in many other galaxies suggests that these objects represent an essential aspect of the epoch of galaxy formation. Seminal papers by Peebles & Dicke (1968), Searle & Zinn (1978), and Fall & Rees (1985) spurred numerous lines of investigation into this relationship and produced scenarios in which globular clusters (hereafter GCs) formed either before, during, or shortly after the development of the galaxies that now host them. Unfortunately, improved theory and simulations, and especially, new observations have made most of the earlier scenarios untenable, or at least unlikely. Hence, the question of what triggers the formation of globular clusters has yet to be satisfactorily answered.
One key development for this subject was the work of Zinn (1985), who established that two distinct populations of Galactic GCs exist: (1) relatively metal-rich clusters, with [Fe/H] -0.8, which share spatial and kinematic properties with the Galaxy’s thick disk or bulge; and (2) relatively metal-poor clusters, with -2.5 [Fe/H] -0.8, which appear to be part of the halo. Further work has indicated a similar dichotomy in other galaxies (e.g. Ashman & Bird 1993; Forbes, Brodie, & Huchra 1997; Beasley et al. 2000; Larsen et al. 2001), which suggests two different modes of GC formation. In the metal-rich case, formation is likely to be an ongoing process. External galaxies, often in the midst of strong tidal interactions, have been observed to host OB associations with various properties expected of young GCs – they are compact, bright, bluish, and are estimated to have masses (e.g. Whitmore & Schweizer 1995; Schweizer et al. 1996). Furthermore, it has recently been realized that galaxies can add to their system of globulars by stripping GCs from dwarf satellite galaxies, as seems to be occurring now in connection with the Milky Way’s Saggitarius dwarf (Ibata et al. 2001; Yoon & Lee 2002). In low-metallicity GCs, only ages Gyr are seen, and characteristics appear to be more uniform across galaxy types and sizes (see however, Strader, Brodie, & Forbes 2004). While the reader is referred to the recent monograph by Ashman & Zepf (1998) for a more detailed comparison between these populations, our focus in this work will be to develop a formation model only for halo globular clusters.
There are three essential features of these objects that any formation scenario must explain or accommodate. The first of these is the remarkable chemical homogeneity of iron-peak elements exhibited by stars within a given cluster: typically, the dispersion in [Fe/H] is less than 0.1 dex (e.g. Suntzeff 1993). This is particularly extraordinary in the case of the oldest clusters, in which the star-forming gas must have attained its metallicity before the universe was a billion years old. This condition divides current formation theories for halo GCs into ‘pre-enrichment’ and ‘self-enrichment’ types. In the former scenario (e.g. Elmegreen & Efremov 1997; Bromm & Clarke 2002), GCs were formed out of gas that had already been homogeneously enriched by a previous generation of supernovae (SNe). Here the key question is just exactly what that population was, why it played only a secondary role in the formation history of the GC, and how it could have enriched this material on very short time scales. In the self-enrichment picture, on the other hand, the protocluster cloud was enriched by one or more supernova events occurring within it (e.g. Brown, Burkert, & Truran 1995; Cen 2001; Nakasato, Mori, & Nomoto 2000; Beasley et al. 2003; Li & Burstein 2003). In this case, the key problems are that this self-enrichment must occur extremely homogeneously and that the kinetic energy corresponding to these SNe can be enough to unbind the gaseous proto-cluster (Peng & Weisheit 1991). Note however that the distribution of metallicities among different halo globular clusters is quite large, and approximates a Gaussian with a mean of [Fe/H] and a dispersion of [Fe/H] (Ashman & Zepf 1998).
A second constraint comes from observations of the tails of stars that are in the process of being stripped from GCs by the tidal field of the Galaxy (Irwin & Hatzidimitriou 1993; Grillmair et al. 1995). If globular clusters contained substantial halos of dark matter, this increased gravitational potential would have a large impact on these tidal losses. In fact, no evidence of dark matter halo suppression is seen, placing a strong upper limit of 2.5 on the ratio of total mass to stellar mass of these objects (Moore 1996; see however Maschenko & Sills 2004). This is in direct contrast with galaxies, which exhibit total mass to stellar mass ratios (e.g. Marinoni & Hudson 2002). Thus the mechanism that formed GCs is likely to be fundamentally different from the dark-matter driven collapse that is believed to govern the formation of galaxies, as it is much easier to separate dark matter from gas than from point-like bodies such as stars (see, however, Bromm & Clarke 2002).
The final constraint on GC formation is related to their mass distribution, which is well described as a Gaussian in with a mean and a dispersion of (e.g. Armandroff 1989). This issue is most lucidly illustrated by the classic “survival triangle” in the mass-radius plane of globular clusters, which is bounded by the long-term disruption processes that act on Galactic GCs (Fall & Rees 1985). Here the minimum radius as a function of mass is determined by mechanical evaporation (e.g. Spitzer and Thuan 1972) while the maximum radius as a function of mass is bounded by shocking that occurs when a cluster passes through the high-density Galactic disk (e.g. Ostriker, Spitzer, & Chevalier 1972). While both these constraints seem to provide good agreement with the observed GC minimum stellar masses and sizes, dynamical friction, which is the only Galactic mechanism limiting the maximum stellar mass, only operates at masses . Thus it appears that the upper mass cut of globulars is not set by any known destruction mechanism (e.g. Gunn 1980; Caputo & Castellani 1984), but rather represents an intrinsic property of the population of gaseous proto-clusters (Peng & Weisheit 1991).
In the high-redshift universe, nature has provided us with just such a population. Because atomic line cooling is only effective at temperatures K, collapsed clouds of material with virial temperatures below this threshold must radiate energy through dust and molecular line emission. While the levels of left over from recombination are sufficient to cool gas in the earliest structures (e.g. Abel, Bryan, Norman 2002; Bromm, Coppi, & Larson 2002) the resulting 11.20-13.6 eV photon emission from the stars in these objects (e.g. Haiman, Rees, & Loeb 1997; Ciardi et al. 2000) is likely to have quickly dissociated this primordial . Thus a generic prediction of current structure formation models is a large population of K, virialized clouds of gas and dark matter that are unable to form stars until they interact with other objects. In fact, it was the similarity between these so-called “minihalos” and the globular cluster population that led Cen (2001) to propose that convergent ionization fronts during cosmological reionization might be able to transform these objects into GCs. Yet such a scenario begs the question of how globulars were enriched with metals, and it is not at all clear that the first galaxy-minihalo interactions were radiative.
Observations of high-redshift starburst galaxies have uncovered large numbers of outflows, both in optical and infrared measurements at (Pettini et al. 2001) and in optical observations of lensed galaxies at (Frye, Broadhurst, & Benitez 2002; Hu et al. 2002). In addition, the classic picture of reionization is of a two stage process, which begins with individual sources ionizating their immediate surroundings and ends in a rapid “overlap” phase in which neighboring H II region join together, quickly ionizing the remaining neutral regions (e.g. Gnedin 2000). Thus it is possible that minihalos that were close to starbursting galaxies during the first stage of reionization could have been impacted by outflows prior to reionization fronts, depending on which was first able to escape from high-redshift starbursts. While numerical simulations have yet to yeild a definitive answer to this question, there are suggestions that the I-fronts in starbursts may be -type at small radii and slow to expand (Kitayama et al. 2004), and that shell material swept up by outflows is effective at trapping ionizing radiation (Fujita et al. 2003). And while eventually shell fragmentation allowed such ionizating radiation to escape, even then, large regions may have remained “shadowed” by the fragments.
It is possible, therefore, that a large number of minihalos were first impacted by outflows. Unlike radiation fronts, which typically boil away the minihalo gas (e.g. Shapiro et al. 2004), shock interactions will result in intense cooling through both nonequilibrium formation of (Mac Low & Shull 1986; Shapiro & Kang 1987; Palla & Zinnecker 1988; Ferrara 1998; Uehara & Inutsuka 2002) and the mixing in of metals with ionization potentials below 13.6 eV (Dalgarno & McCray 1972), thereby initiating the formation of large numbers of stars. Similar shock-induced star formation has been observed and simulated in low-redshift intergalactic clouds impacted by radio jets (van Breugel et al. 1985; Fragile et al. 2004). Further, the efficient dispersal of stellar nucleosynthetic products at high redshift is required by observations of metals (at levels to ) in the metal-poor stars of the Galaxy’s halo (e.g. Freeman & Bland-Hawthorn 2002), in the hot gas within galaxy clusters (e.g. Renzini 1997; Peterson et al. 2003), and in the intergalactic clouds producing quasar absorption line features (e.g. Tytler et al. 1995; Rauch et al. 1996; Songaila 2001).
Additionally, this formation trigger offers a plausible explanation of why individual GCs do not have dark matter halos today. Previous work (Scannapieco, Ferrara, & Broadhurst 2000) has shown that gas in growing pre-virialized density perturbations is vulnerable to the influence of outflows. Here the dominant mechanism is “baryonic stripping” in which the gas is accelerated above the escape velocity and ejected from the associated dark matter perturbation. While this has the effect of completely suppressing star formation in diffuse pre-viralized regions, such interactions may strip the dense gas from virialized minihalos while at the same time enhancing their densities to form gravitationally-bound clouds.
In this paper we carry out a two-part study to explore this scenario in detail. First, using a simple analytical model, we examine heating, cooling, and momentum transfer in outflow-minihalo interactions, and determine the general properties of star clusters formed by this process. Second, we use one-dimensional numerical models to examine the turbulence-driven mixing that happens when metal-rich supernova ejecta encounters gas of primordial composition. Our work builds on recent analyses involving one of us (Thacker, Scannapieco, & Davis 2003; Scannapieco, Schneider, & Ferrara 2003) in which basic outflow properties, global enrichment patterns, and heavy-element yields from Population III supernovae were determined.
The structure of this work is as follows. In §2 we outline a general model for galaxy outflows and high-redshift minihalos, and in §3 we construct simple analytical estimates for the fate of the minihalo gas subjected to an outflow as a function of model parameters. In §4 we use one-dimensional numerical turbulence models to examine the mixing of metals into the minihalo gas. Conclusions are given in §5.
2. General Framework
Driven by measurements of the Cosmic Microwave Background, the number abundance of galaxy clusters, and high-redshift supernova distance estimates (eg. Spergel et al. 2003; Eke et al. 1996; Perlmutter et al. 1999) throughout this paper we adopt a Cold Dark Matter (CDM) cosmological model with parameters , = 0.3, = 0.7, and , where is the Hubble constant in units of 100 km s-1 Mpc-1, and , , and are the total matter, vacuum, and baryonic densities in units of the critical density, g/cm3 for our choice of . Note, however, that as the outflow-minihalo interactions relevant to GC formation are all at high redshifts, the value of has no direct impact on our calculations.
2.1. The Outflow
To model the expanding outflow we consider a (spherically symmetric) Sedov-Taylor blast wave with energy input in units of ergs, which is expanding into a gas of times the mean density at a redshift . While any realistic starburst-driven outflow will show some degree of asymmetry, this model gives a resonable approximation to the structure of high-redshift starbursts seen in numerical simluations (e.g. Mac Low & Ferrara 1999; Mori, Ferrara, & Madau 2002; Fujita et al. 2004). Here is the fraction of the total kinetic energy from supernovae () which is channeled into the galactic outflow.
In our assumed cosmology, the blast’s expansion speed is
| (1) |
where , is the redshift at which the shock reaches the halo and is the physical (ie. not comoving) radius of the shock in units of kpc. Our choice of the a typical gas overdensity is motivated by the model described in §2.2. The corresponding postshock temperature is K, assuming an ionized gas with a mean molecular weight of By the time it reaches , the shock will have entrained a total mass of
| (2) |
of material and have an overall surface density of
| (3) |
and it will reach this radius at a time of
| (4) |
We can estimate the total mass in metals as roughly 2 per 1051 ergs, a relation that is true both for type II supernovae, as well as for pair-production supernovae (SNγγ) from very massive PopIII stars (Woosley & Weaver 1995; Heger & Woosley 2002). Assuming that half of these metals escape from the host galaxy, we find the mass of ejected metals, in units of , to be simply . While the Sedov-Tayor solution assumes that the entrained material represents swept-up gas, in fact a few times the mass in metals is injected into the blast wave. However, the Sedov solution will be accurate as long as kpc, and cooling within the bubble is small.
To estimate the energy in a typical high-redshift outflow, consider a young galaxy whose total mass is . Such a galaxy will have a virial temperature exceeding 20,000 K, so its gas readily cools via atomic (HI) line emission, leading to star formation. The assumption that 10% of the gas is converted to stars gives good agreement with observed high-redshift star-formation rates, as well as with abundances of metals measured in high-redshift quasar absorption line systems (Thacker, Scannapieco, & Davis 2002; Scannapieco, Ferrara, & Madau 2002). For very massive (PopIII) stars, the models of Heger and Woosley (2002) suggest that supernovae produce some ergs for every 30 of material in new stars. For less massive (PopII) stars, a Salpeter IMF yields one supernova with an explosion energy of ergs for every 150 in new stars (eg. Tegmark, Silk, & Evrard 1993). Thus we obtain
| (5) |
where here and below is the galaxy mass in units of For the wind efficiency () we rely on the simulations described in Mori, Ferrara, & Madau (2002), which indicated in the case of a star-bursting galaxy.
Finally, we note that a lower bound, , follows from the fact that high-redshift outflows dispersed metal efficiently enough to preclude stars of primordial composition being formed today (Scannapieco, Schneider, & Ferrara 2003). This minimum value, plus the numbers cited above, suggest a fiducial outflow model in which and .
2.2. The Protocluster
Having established basic outflow parameters, we now develop a simple model for the gas and dark matter in a protocluster whose total mass . We assume that the gas has a primordial composition (76% H and 24 % He, by mass) and is unionized, giving a mean molecular weight .
At a redshift , corresponding to a cosmic age Gyr, the gas and dark matter collapse and virialize. Initially, the mean density of the protocluster cloud is enhanced by a factor above the background,
| (6) |
where the enhancement factor for a virialized cloud at high redshift is well approximated by the value in a critical universe (e.g. Eke, Navarro, & Frenk 1998). With this choice, the cloud’s virial radius is
| (7) |
and its virial velocity is
| (8) |
As first observed in the numerical simulations of Navarro, Frenk, and White (1997, hereafter NFW) we assume that the CDM minihalo develops a radial profile of the form
| (9) |
where , is the halo concentration parameter, and
| (10) |
We then assume that as the procluster gas collapses within the dark mater halo, it is shock heated to the virial temperature
| (11) |
and develops the density distribution of isothermal matter in the CDM potential well:
| (12) |
The central gas density () is determined by the condition that the average baryonic density within the virial radius is equal to . The escape velocity for an atom at a radius within the well is given by
| (13) | |||||
so that .
Following Madau, Ferrara, & Rees (2001) we assume a typical concentration parameter of , although there are some indications that high-redshift halos may be less concentrated than expected from this estimate (e.g. Bullock et al. 2001). With this choice , motivating our typical value of , and , , and
| (14) |
where and .
Note that a gas-to-star conversion efficiency of followed by a loss of of a young globular cluster’s original stellar mass (through winds, tidal forces, etc.), when combined with the aforementioned present GC mass limit, , implies that the likely limiting mass of proto-globular clouds (gas+CDM) is
| (15) |
For a collapse redshift the corresponding limit on the virial temperature is K. Choosing a conversion efficiency gives a corresponding limit on the virial temperature of K, which is low-enough to preclude substantial ionization, hydrogen line cooling, and “unassisted” star formation. Thus, given the uncertainties involved, the maximum size of minihalos corresponds to the maximum size of halo globular clusters.
Lately, a great deal of attention has been given to the inner profile of dark-matter halos, as measured from the properties of low surface brightness (LSB) galaxies, whose gravitational potentials are thought to be dark-matter dominated at all radii. In particular, studies of these objects have found that their inner rotation curves are likely to be well-described by constant density cores, in contrast to the profile assumed here (e.g. Carignan & Beaulieu 1989; Carignan, & Sancisi 1991; de Blok & McGaugh 1997). Recent studies have complicated the issue, however, suggesting that to some degree, these results may have been affected by the poor angular resolution of the H I observations. By accounting for beam smearing, several groups have shown that the H I rotation curves of LSB galaxies are consistent with a wide variety of dark matter potentials, ranging from constant density cores to profiles as steep as (e.g. Blais-Ouellette et al. 1999; Swaters, Madore, & Trewhella 2000; van den Bosch & Swaters 2001). Further high-resolution measurements have reached similar conclusions (Swaters et al. 2003). While still an unsettled issue, the presence of such a core will only reduce the gravitational potential in the center of the cloud, enhancing the impact of a cloud-outflow interaction. This effect is only important in the interior profile of the cloud, however, which contains of the gas mass. Thus we expect our NFW model to provide a reasonable description of the the protocluster; at worst it provides a slight underestimate of the impact of shocking by galaxy outflows.
Finally we note that, given our cosmological model (with a primordial power spectrum as given by Eisenstein & Hu 1999, ) and the efficiencies assumed above, by the region that evolved into the Milky Way was filled with minihalos that could form into GCs with stellar masses ; by , there were such minihalos. These estimates are based on the Lacey & Cole (1993) progenitor model and an assumed total Galactic mass and formation redshift of and . Even assuming just the mean cosmological density results in and such minihalos at and respectively (Press & Schechter 1974). Thus, although we show below that only a fraction of minihalos will be located the correct distance from a starburst to form a GC, our mechanism need not be particularly efficient to account for the Galaxy’s halo globular clusters.
3. Fate of the Protocluster
3.1. Outflow-Protocluster Interactions
Using the simple outflow and protocluster models described above, we now outline the general features to be expected when the shock interacts with the gas in a CDM minihalo. The mass of the shell that impacts such a protocluster is
| (16) |
and at the time of impact its momentum is
| (17) | |||||
where is a momentum surface density. Recalling that is the total mass in metals within the blast-wave material, it is straightforward to calculate that the metallicity to which the protocluster gas is enriched is
| (18) |
where we have taken solar metallicity to be by mass, and have assumed that a fraction of the metals is thoroughly mixed into protocluster gas and is contained in the GC stars observed today. This mixing efficiency is studied in detail in §4.
We are most interested in clouds whose stars are enriched to approximately 1/30 the solar value (Ashman & Zepf 1998), which occurs at a typical distance of
| (19) |
This is sufficiently large that the original mass input is negligible compared to the entrained mass (see eq. 2). The time it take for the bubble to reach this radius is
| (20) | |||||
Typically, this is shorter the cooling time within the bubble
| (21) |
where is the radiative cooling rate of the gas in units of ergs cm3 s-1 and is electron number density of the shocked gas in units of cm-3, is the gas temperature in units of K, and we have asssumed that the density of the post-shock gas is enhanced by a factor of 4. Thus our assumed Sedov solution should be reasonable for the range of values considered in this study.
Futhermore, for likely values of , is comparable to the virial radius of the outflowing galaxy, which is kpc. Hence, the density of the medium through which the shock is passing is substantially higher than the mean IGM density, and more like our fiducial value, , taken at the virial radius.
From Eqs. (1), (2), (17), and (19) we determine the shock velocity at the time of impact to be
| (22) |
and the mass and momentum impinging on the cloud to be
| (23) |
and
| (24) | |||||
If we compare with the virial velocity of the cloud times its baryonic mass,
| (25) |
we see that for redshifts the blast wave’s momentum is sufficient to move the gas out of the dark matter potential well whenever . But, how will such a dark cloud be impacted as a function of radius, and what is the ultimate fate of its swept-up gas?
3.2. Three Stages of Evolution
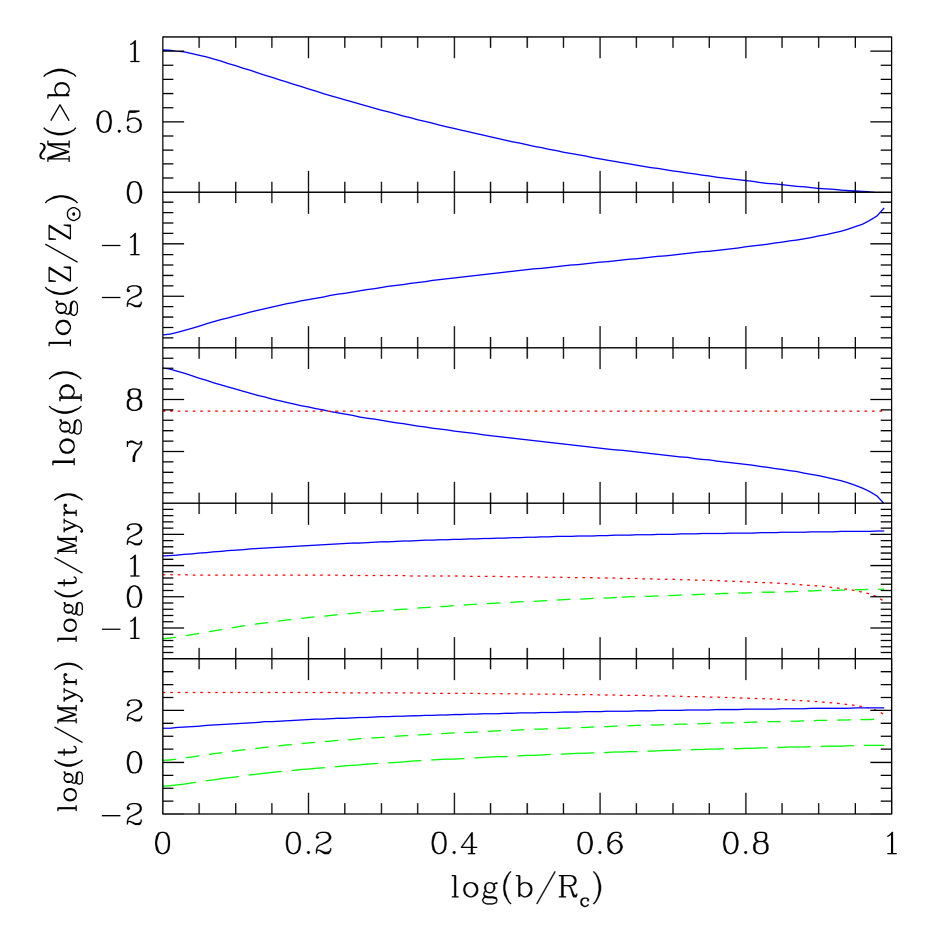
In order to study this interaction in more detail, we adopt a specific set of parameters for §3.2, and in §3.3 we discuss the effect of varying these values. Here we put , , , , and . We consider a protocluster with whose total gas mass is approximately . Assuming an overall star formation efficiency this provides a good match to the observed peak in the globular cluster mass function at (in stars). In this section, we assume that all metals eventually mix into the protocluster gas, so . Altogether, these choices represent our fiducial model.
We identify three important stages in the evolution of shocked cloud. The first of these occurs as the outflows moves across the minihalo. At this point, the key question is whether the impinging momentum is sufficient to accelerate the gas to its escape velocity, stripping it from the dark matter potential. To estimate when this occurs, we compute the average momentum surface density as
| (26) |
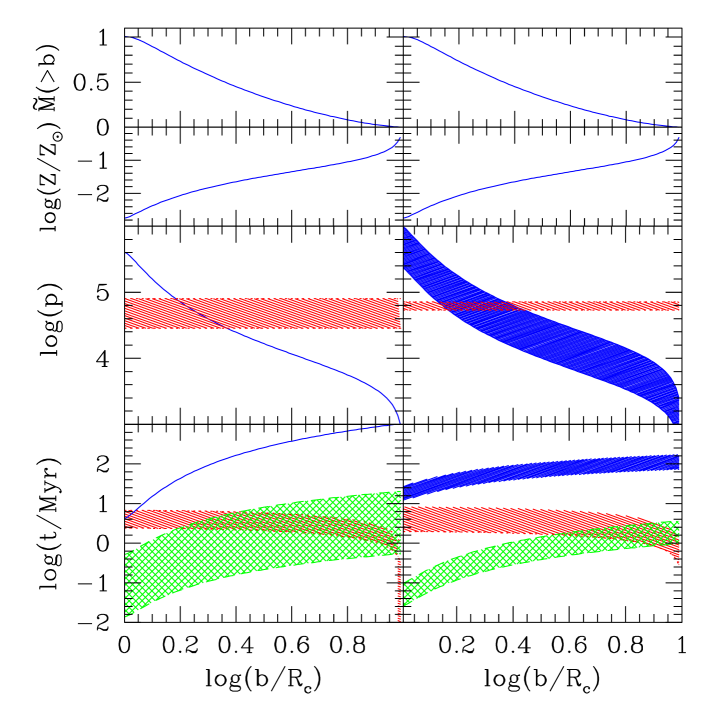
is the impact parameter from the central axis of the cloud, and is the distance along a line parallel to this axis. This is plotted in third row of Fig. 1, for our fiducial model.
Comparing the momentum surface density with the momentum per unit area in the outflow, we find that for all impact parameters In our simple picture, we assume that all the gas outside of will be stripped from the potential, while the denser central regions will be left behind, resulting in an elongated bell-shaped distribution, not unlike the coma of a comet.
In order to better relate our radial profiles to the properties of the cloud, in the upper two panels of Fig. 1 we plot
| (27) |
the mass outside a given impact parameter, and
| (28) |
the local metallicity at that distance, where . From these estimates, we find that approximately of the gas mass is able to be efficiently stripped from the minihalo and that, once homogenized, the metallicity of this gas exceeeds
The second important stage occurs just after the blast front passes across the protocluster. At this time, the gas has been heated to a postshock temperature of several million degrees and its density has been enhanced by a factor of four. There are three time scales that then enter into the problem. The first of these is the sound crossing time, which we estimate as
where km/s is the postshock sound speed.
The first key issue is then whether the self-gravity of the gas alone can resist the pressure associated with such an enormous temperature increase. This is determined by comparing the sound crossing time with the free-fall time, which can be written in convenient units as
| (30) |
where is the gravitational constant, and is the density of the gas in atoms cm-3. In the fourth panel of Fig. 1 we see that for our fiducial set of parameters at all impact parameters. Thus it seems the swept away gas will be evaporated into the IGM within a sound crossing time. In order for this to occur, however, the gas must expand before cooling process are able to dissipate its thermal energy. This is determined by the cooling time as given by eq. (21). Note that in this equation is a function not only of the temperature of the gas, but also of its elemental composition, as the presence of heavy elements greatly increases the number of transitions that can radiate efficiently. For simplicity we estimate this radiation by assuming that all the gas is at the mean metallicity given by eq. (18) and by taking solar abundance ratios, which allows us to make use of the tabulated models of Sutherland & Dopita (1993). This approximation is dependent on the prompt mixing of the minihalo gas with all the impinging material (as discussed in §4), but in fact a range of metallicities may be found in the gas at a given impact parameter. For temperatures within this leads to values ranging from 0.6 to 10. At higher temperatures, cooling is dominated by bremsstrahlung and is largely metallicity independent, while molecular cooling becomes important at lower temperatures, as discussed below. Finally we estimate the post-shock density at an impact parameter as
With these simplifying assumptions, we obtain the cooling times that are plotted as the dashed lines in the fourth panel of Fig. 1. Note that is several orders of magnitude smaller than the free-fall time, as can be inferred directly from the properties of GCs observed today (Murray & Lin 1992). In fact, for a large range of impact parameters, is much smaller than the sound crossing time. Thus, despite enormous postshock temperatures, efficient radiation by the dense and metal-enriched halo gas is able prevent evaporation of the gas within which we label as . This means that roughly half of the gas () is expelled from the dark matter potential, yet cools sufficiently quickly to remain gravitationally bound. Modulo our assumption of efficient mixing (), this gas has a relatively small range of metallicities, from about to .
At high temperatures, the cooling time is a monotonic function that strongly decreases with decreasing temperature. The cloud becomes ever more efficient at radiating its energy until the gas begins to cool below K, when it reaches the third and final important stage. At this point, the gas is largely neutral, and the cooing rate decreases precipitously. Two new processes then become important, the first of these is the production of molecular hydrogen by nonequilibrium reactions (e.g. Ferrara 1998) and the second is infrared line emission by C ii, Fe ii, and Si ii, whose ionization potentials are less than 13.6 eV (Dalgarno & McCray 1972). In the case of molecular hydrogen, runaway cooling from K results in appreciable levels of H- and H, which act as intermediaries in H2 formation. While the exact numbers are uncertain to within a factor this can result in levels of H2 (see e.g. Uehara & Inutsuka 2000, Figure 1), which, in turn yield cooling rates of ergs cm3 s-1 (Galli & Palla 1998). The atomic infrared cooling is somewhat less efficient but also a weaker function of temperature, ranging from about ergs cm3 s-1 at 1000 K to ergs cm3 s-1 at 100 K for gas. Thus cooling through is expected to be slightly more important than metal line cooling at 1000 K and slightly less important at 100 K.
The relevant times scales at late times are plotted in the bottom panel of Fig. 1, assuming that the gas cools at a fixed density. Here we see that at both 1000 and 100K, the cooling time is substantially shorter than the sound crossing time at all radii, and the gas is likely to cool to very low temperatures even if photo-dissociating radiation (which we do not attept to model) were strong enough to quickly destroy the formed , meaning that all cooling was through C ii, Fe ii, and Si ii, or if mixing is inefficent, meaning that all cooling was through . In fact, at 100 K the sound crossing times even lie above the free-fall times. Thus, although the cooling rate is orders of magnitude smaller at these low temperatures, weak radiation from or metals is still sufficient to cool the cloud to the point at which its thermal pressure cannot counteract self-gravity. Note that this runaway collapse takes place even if we assume no additional density enhancement during cooling, and no external pressure from the hot medium that is likely to be found behind the shell [as seen for example in NGC 3077 (Ott, Martin, & Walter 2003)]. As and , while , such density changes during cooling from K will only enhance collapse at low temperatures. Furthermore external pressure, while negligible for the hot cloud, may equal or even exceed the thermal pressure of K gas. Thus we believe low-temperature cooling does not represent an important barrier for star formation in shocked minihalos.
To summarize, the two key issues that determine the fate of the gas are momentum transfer to the cloud during outflow shocking (stage 1) and the ratio of the cooling time to the sound crossing time just after the shock moves across the cloud (stage 2). It is these issues that we now address in some detail, as we study the impact of varying several model parameters about their fiducial values.
3.3. Dependence on Input Conditions
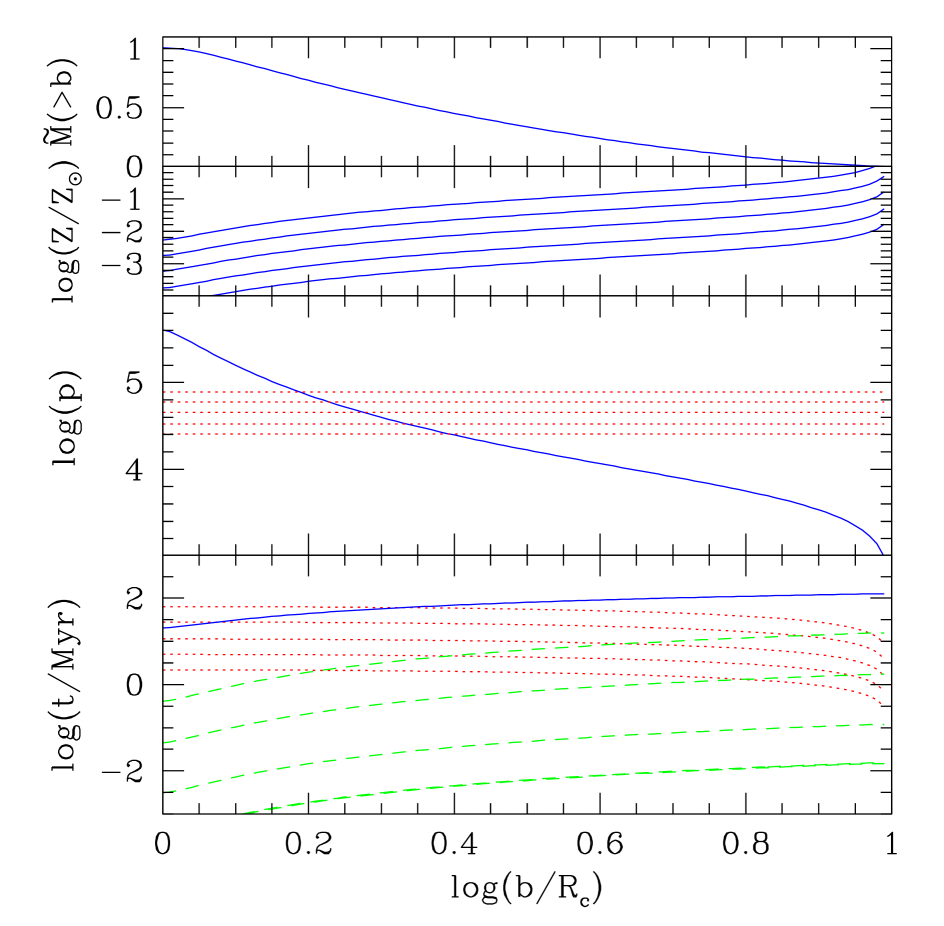
Having outlined the general stages we expect shocked minihalos to undergo, we now consider a range of values for the input parameters of our model, and relate these to the observed range of properties of halo globular clusters. The first issue we explore is the impact of varying the distance between the minihalo and the outflowing galaxy. As this is directly related to the mass in metals reaching the cloud, according to eq. (18), this constrains the range of globular cluster metallicities that can be generated in our model. Holding all other fiducial paramters fixed, we select mean values of , , , , and which correspond to distances of 21, 12, 6.6, 3.7, and 2.1 kpc, respectively, and to the results that are plotted in Fig. 2.
At the smallest distance, more momentum is imparted to the halo, causing stripping to be slightly more efficient. As the momentum surface density is proportional however, this effect is minor in comparison to the change in the postshock temperature Thus, in this case, is vastly increased while is decreased, and the stripped gas is evaporated without forming stars. Similarly, increasing the distance has a much stronger impact on and than on . In the models in which , , and , almost all of the gas outside of , and respectively is stripped from the halo, yet able to efficiently cool, which again corresponds to roughly of the gas mass. In fact the maximum distance at which ejection and shock-induced star formation are effective is not determined by the stripping criteria, but rather by the postshock temperature being too low to ionize the minihalo gas and allow it to radiate efficiently. The post-shock temperature for , for example, is only K, well below the K needed for effective collisional excitation of hydrogen.
These results compare well with the observed metallicity distribution of halo globular clusters, which peaks slightly below [Fe/H and falls off gradually with very few objects having iron abundances below [Fe/H or above [Fe/H (Ashman & Zepf 1998). Furthermore the relatively constant metallicity between compares well with the observed dex spread observed within individual objects (e.g. Suntzeff 1993).
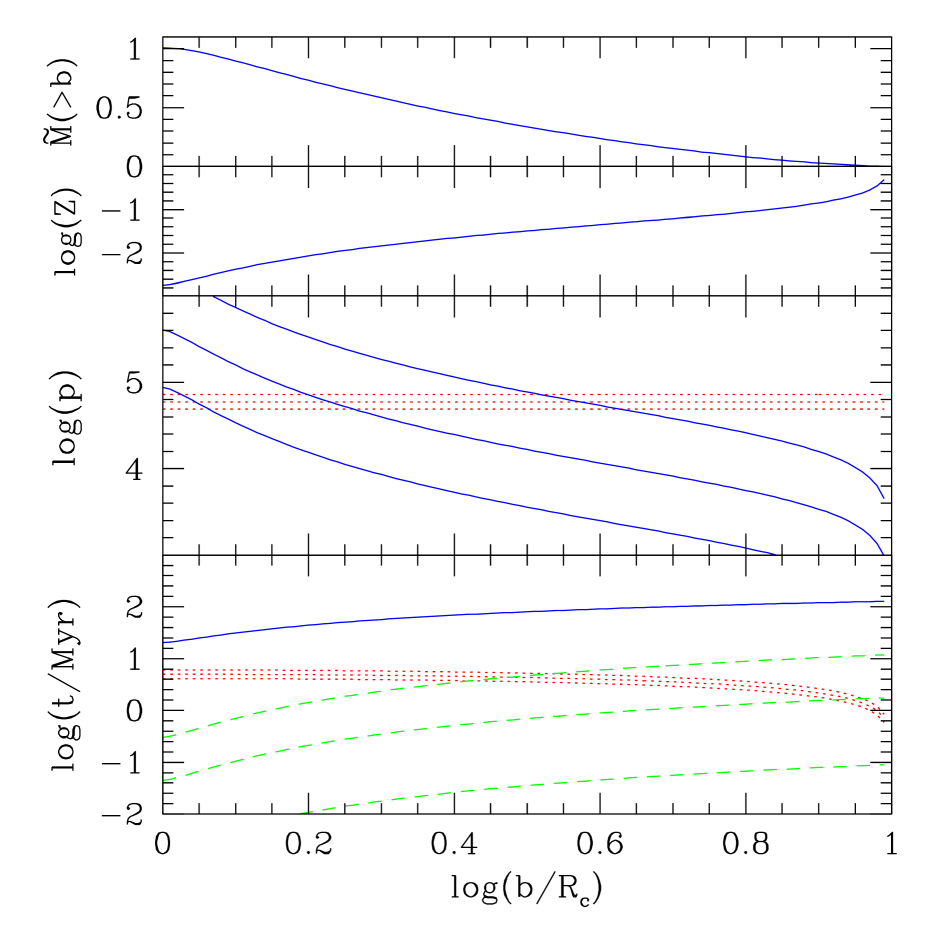
The second important issue is the dependence of our model on the mass of the shocked cloud. In Fig. 3 we vary this quantity over two orders of magnitude, while keeping other fiducial parameters fixed. By eq. (18), this means that the distance between the source galaxy and the minihalo is assumed to increase with decreasing mass. Thus, although stripping is seen to be more efficient in the lower mass case, the post-shock temperature is reduced too, as at a fixed . This greatly reduces the cooling time, allowing the gas as a whole to be stripped and to cool quickly enough to remain bound.
From this comparison it is clear that our assumed mechanism becomes more effective in the case of smaller minihalos, and that the minimum scale of globular clusters probably depends instead on processes that occur after star formation. Fortunately, as discussed in §1, this limit is easily understood in terms of the dominant destruction processes that act on GCs in the Milky Way, in particular disk-shocking and mechanical evaporation. On the other hand, the maximum mass of GCs is likely to be a feature of the proto-cluster cloud itself. Turning our attention to the high mass case, we find that if then and Thus we expect our scenario to be relatively inefficient in forming stars in objects more than a few times larger than our fiducial mass, , which rougly corresponds to the largest minihalo as well as the maximum observed GC mass, as discussed in §2.2.
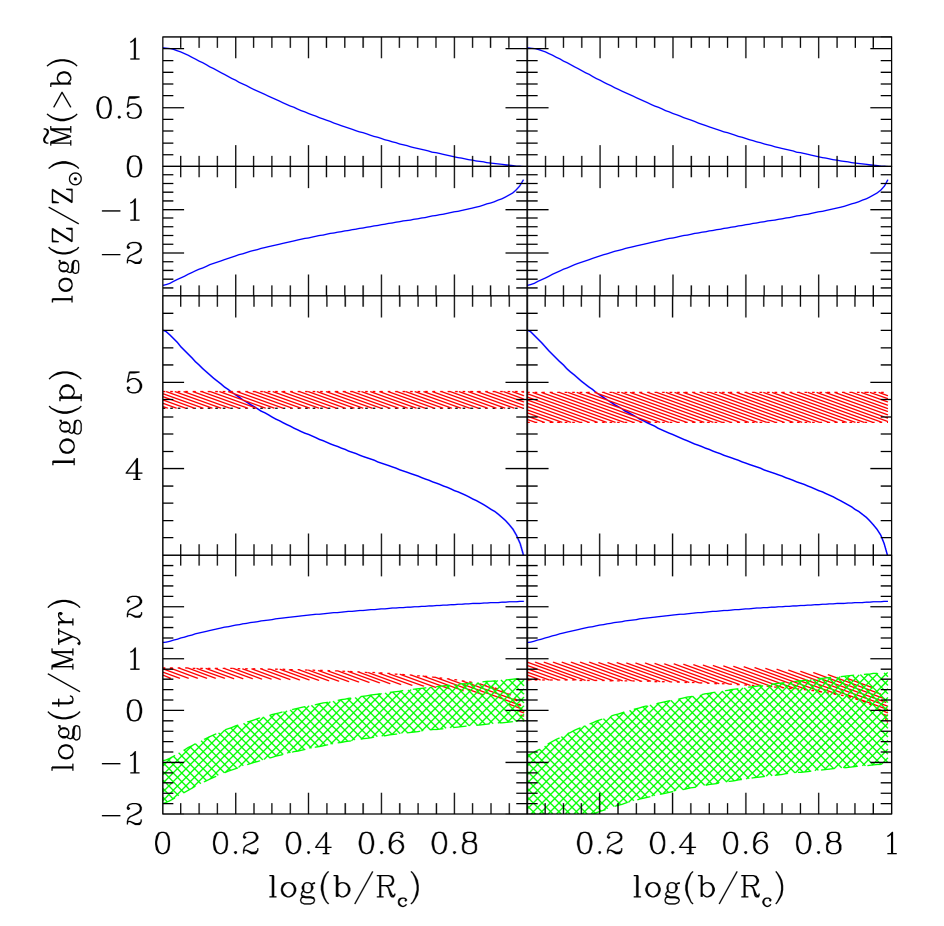
Next we evaluate the effect of varying the energy input parameters and . Increasing increases the mass of ejected metals, so raising this value also raises the distance corresponding to enrichment. Thus, changing the number of supernovae in the outflowing galaxy has a relatively minor impact on the momentum imparted to the cloud, changing by only a few percent, as is shown in the left panels of Fig. 4. Similarly, simultaneously increasing the energy input and distance serves to damp the effect has on the sound crossing time and and cooling time of the postshock gas. Note that as the postshock temperature is proportional to , decreasing slightly with increasing , and shorting while raising somewhat. Thus the primary impact of on our globular cluster formation model is simply to shift the relevant distance further away from the outflowing galaxy, while keeping the metallicity fixed, and slightly improving the fraction of minihalo gas available for star formation.
In the right columns of Fig. 4 we study the impact of varying , the ejection efficiency. As this parameter affects only the shock velocity, it has no impact or our choice of fiducial distance and is not subject to the damping observed in the left panels. In this case ranges from 0.2 to 0.35 while ranges from in the case to if . Thus the wind efficiency represents a larger model uncertainty than , although at least 40% of the gas mass lies between and in all cases.
Finally, in Figure 5 we study the effect of varying the density of the medium through which the shock is moving, as determined by , and the density of the minihalo, as determined by . From eqs. (22) and (24) while Thus increasing improves the efficiency of our formation mechanism, pushing towards the center, while shifting outwards. Similarly, decreasing reduces both the efficiency of stripping and cooling. At , and our GC formation mechanism fails completely. Thus, our scenario is most likely to take place at separations that are comparable to the virial radius of the starbursting galaxy. This point is particularly noteworthy because, while protocluster-scale minihalos are ubiquitous in CDM cosmological simulations, no patently intergalactic globular clusters have been found to date (McLaughlin 1999; Marín-Franch & Aparicio 2003).
Changes in the density of the cloud, as determined by its formation redshift, have the opposite effect on the shock properties. In this case and Variations in also effect the properties of the cloud, however, in particular shortening the free-fall time and increasing the imparted momentum as the formation redshift is increased. Thus later-forming clouds are heavily favored by our mechanism, and is unlikely that efficient star-formation was achieved in objects in which Note that it is the ratio of and that is important for this comparison, and thus we expect little difference in our results if both the collapse and outflow redshifts were shifted to higher values, as might be necessary if cosmic reionization took place early, as suggested by polarization measurements from the Wilkinson Microwave Anisotropy Probe (Kogut et al. 2003).
To summarize these sensitivity studies in the context of our scenario, cloud-outflow interactions are efficient at forming stars in clusters with mean metallicities ranging from about to . Below shocks are too weak to induce star formation, while above , shocks are too powerful and disrupt the gas completely. Induced star formation is largely independent of the total energy input from a given starburst, although some uncertainty is introduced by the unknown fraction of this energy that goes into powering a galaxy outflow. While outflowing shells are efficient at forming stars in small minihalos, this become more difficult in the largest of such objects, whose gas masses compare well with the maximum stellar masses of globular clusters. And finally, our mechanism is most efficient in cases in which the density contrast between the cloud and the surrounding medium is not too high: in minihalos close to starbursting galaxies that formed at a similar redshift.
4. Turbulence Models of Metal Mixing
4.1. A 1D Code for Turbulence Transport and Mixing
In §3 we saw that the chemical homogeneity observed within globular clusters can be associated with the range of metallicities generated in outflow-minihalo interactions. Yet these estimates were based only on the mass of heavy elements impinging on the cloud as a function of impact parameter. For true homogeneity within the resulting stellar population to be achieved, not only must sufficient masses of metal be present, but this material must be well mixed into the star-forming gas. Note that this chemical structure is of particular importance as it plays a key role in gas cooling as described in §3.2.
As a first step towards examining this “fine grained” mixing (Rees 2003) in detail, we have developed a one-dimensional numerical code, which make use of a well-tested generalization (Besnard et al. 1992) of the the widely used “” model of turbulence transport (Harlow & Nakayama 1967). In this case the equations of conservation of mass, momentum, and energy are coupled to the Reynolds stress tensor, which represents the ensemble average of the product of the density and the velocity departures from the mass-weighted mean. Thus we have
| (31) | |||||
| (32) | |||||
| (33) | |||||
where and are time and position variables, is the mass density field, is the mass-averaged mean-flow velocity field in the direction, is the mean pressure, is the total mean energy, is the mean temperature, is the volume averaged mean-flow velocity field in the direction, and we take and , as appropriate for a polytropic gas. The Reynolds stress tensor is then modeled using a Boussinesq-type approximation as
| (34) |
where is the turbulence “eddy” viscosity (which is calculated as ), is the turbulence energy density, and is the turbulence energy density decay rate. The transport equation for each of these quantities is constructed as a compressible generalization of the standard model, namely
| (35) |
where (with and the departures from the volume-weighted mean density and velocity), and the terms on the right hand side of the equation represent buoyancy creation, shear creation, decay, and self-diffusion respectively. Similarly
| (36) | |||||
where the first four terms on the right hand side parallel those in eq. (35), and the final term represents changes in the turbulent scale due to expansion or contraction of the fluid element. This scale can be defined as
| (37) |
such that an expanding motion results in an increase in , which translates to a decrease in , likewise a contraction decreases , driving up. In eq. (36) is the turbulence mass flux, while the empirically fit constants are , , , , and , (e.g. Launder, Reece, & Rodi 1975) where is the dimensionality of the compression modeled in the last term of eq. (36), which in our case is 1. Closure of our system of equations is achieved by the transport equation for :
| (38) |
where the first two right-hand terms represent turbulence distributive creation and “drag” decay, , and the last term with , describes buoyancy effects, which are here neglected. Mixing between multiple materials is computed by carrying additional transport equations for their concentrations, . For this purpose we use a diffusional approximation for the species flux:
| (39) |
where is an index over materials and . We compute as and the temperature as with the Boltzmann constant. Our code does not attempt to account for self-gravity or the impact of the dark matter gravitational potential, as these only become of primary importance when the full two-dimensional geometry of the distortion is calculated, as discussed in §4.2.
This formulation of turbulence equations is closely related to that used in the CAVEAT numerical code (Adessio et al. 1990), where it has been compared with a wide range of experimental results. Our implementation is an Eulerian finite-difference one, with donor-cell advection being used throughout. Test calculations show overall qualitative agreement with experimental results for the shear problems of interest us. While our approach is sufficiently accurate to demonstrate our ideas for this paper, more precise analyses may require the use of a full spectral representation, like that described by Steinkamp, Clark, & Harlow (1999a; 1999b).
4.2. Application to Shocked Minihalos
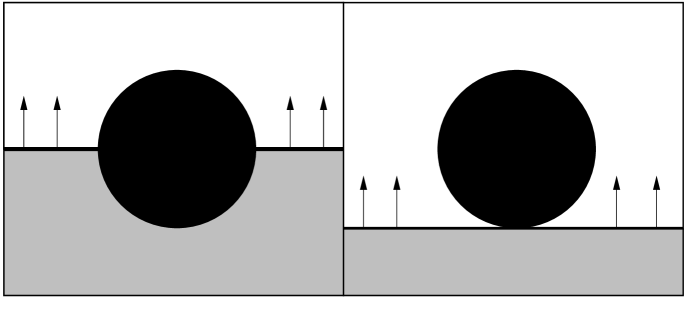
Having developed and tested a simple one-dimensional code to track turbulent mixing in compressible fluids, we then applied this tool to the problem of cloud-outflow interactions. Here we focused on two key geometries: an edge-on configuration, in which mixing occurs due to Kelvin-Helmholtz instabilities as the outflow shears along the side of the cloud, and a face-on configuration, in which mixing due to Rayleigh-Taylor instabilities occurs as the outflow material moves into the denser cloud. Each of these configurations is illustrated in Figure 6.
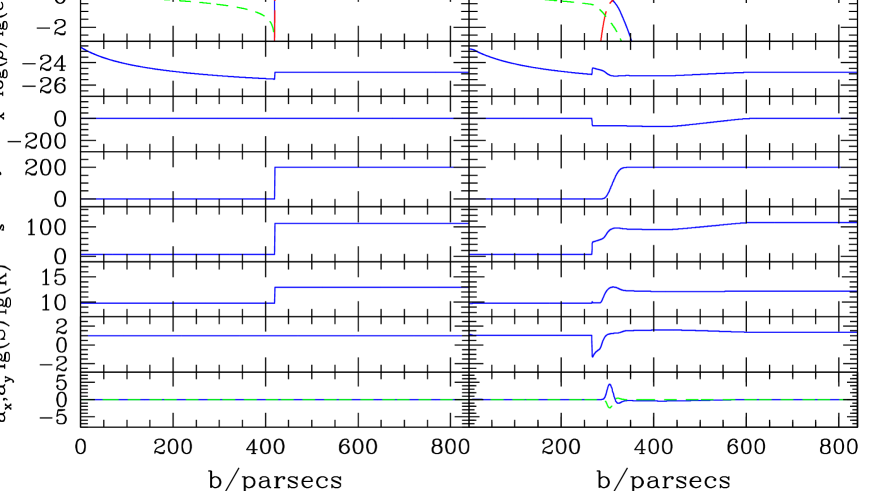
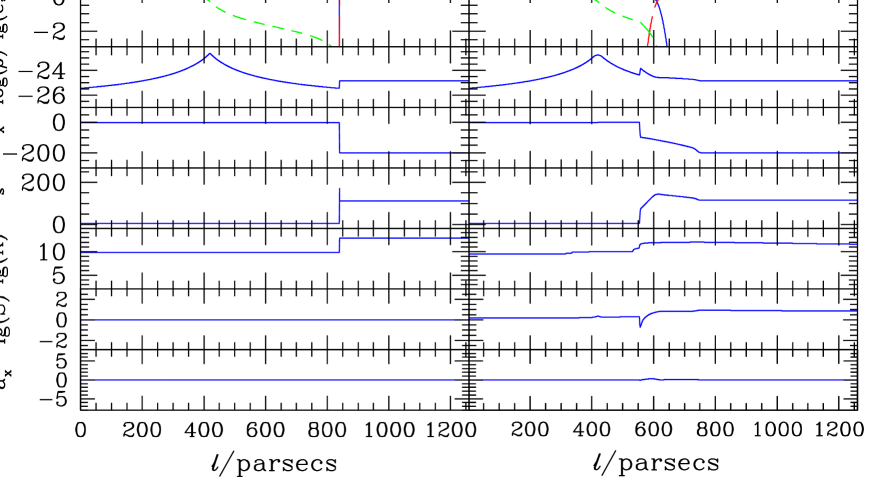
Turning our attention first to the shear instability case, we chose our initial conditions to approximate the fiducial problem described in §3. Our simulation domain was divided into 800 evenly-spaced zones, spanning a distance of 840 physical parsecs, twice the radius of our fiducial cloud. The first 400 of our simulations zones were filled with material 1, which was taken to represent the primordial gas making up the cloud. Here the density was computed as per eq. (12), the fluid was initially at rest, and the temperature was taken to be the virial value of 1650 K. The second 400 zones were filled with material 2, which was taken to represent the enriched outflow. In these cells the density was taken to be 4 times the density at the radius of the cloud, was 200 km/s ( parsecs/Myr), and the temperature was taken to be the postshock value of K. On both sides of the shock, material is assumed to be largely quiescent, with an initial turbulent kinetic energy equal to only of the total energy. An initial turbulent scale of 10 parsecs was chosen in both materials.
These conditions are shown in the various panels in the left column of Figure 7. In order to better quantify mixing in the simulation, we also computed
| (40) |
a quantity that estimates the fraction of the total cloud gas mass contained outside of a given impact parameter , which is plotted as the dashed lines in the upper panel.
Adopting a time step of years and a time unit such that is defined as 1.5 million years, we ran our simulation to a final time of . From the estimates in , one can expect a Myr delay between shocking and star formation, which is primarily governed by the free-fall time; however by these late times the distortion of the cloud is likely to be so severe that our one-dimensional calculations will look nothing like the true configuration. Thus we choose to stop our simulation much sooner, quoting our simulated mixing as a lower limit. These results are depicted in Figures 7 and 8.
Three major features are visible in the mean-flow quantities represented in the upper panels in these plots: a strong shock moving into the cloud, a material interface moving inwards, and a rarefaction wave moving outward into the enriched gas. The motion of each of these features is well approximated by the analytical solution for the propagation of a strong pressure discontinuity in the absence of turbulence transport or shear (eg. Harlow & Amsden 1971):
| (41) | |||||
| (42) | |||||
| (43) |
where and are the velocities of the interface, shock, and rarefaction wave respectively, is the sound speed in the outflow region, and is the sound speed to the left of the rarefaction wave. Initially, the inward shock and fluid interface move at speeds of and km/s respectively, but slow somewhat as they reach the dense regions near the center of the cloud. On the other hand, the sound speed in the unshocked regions is quite small ( km/s). As the cloud is assumed to be initially in pressure equilibrium, any motions due to gravitational effects should also be km/s, justifying our neglecting self-gravity and the dark-matter gravitational potential in this one-dimensional calculation.
Turning our attention to the turbulence energy profile, we find a notable increase along the shearing interface between the two materials. This is initially confined to a relatively narrow region at early times, but expands to cover parsecs by , and the corresponding turbulent diffusion is sufficient to mix metals into of the cloud by this time. In order to distinguish this mixing from the numerical diffusion intrinsic to our Eulerian approach, we also include values in the right column of Figure 8 for an identical run in which has been set to zero in eq. (39).
As a test of convergence, both runs were repeated doubling the resolution and halving the overall time step. This had the effect of reducing the mixing in the estimates of the concentrations, while leaving other quantities unchanged in both runs.
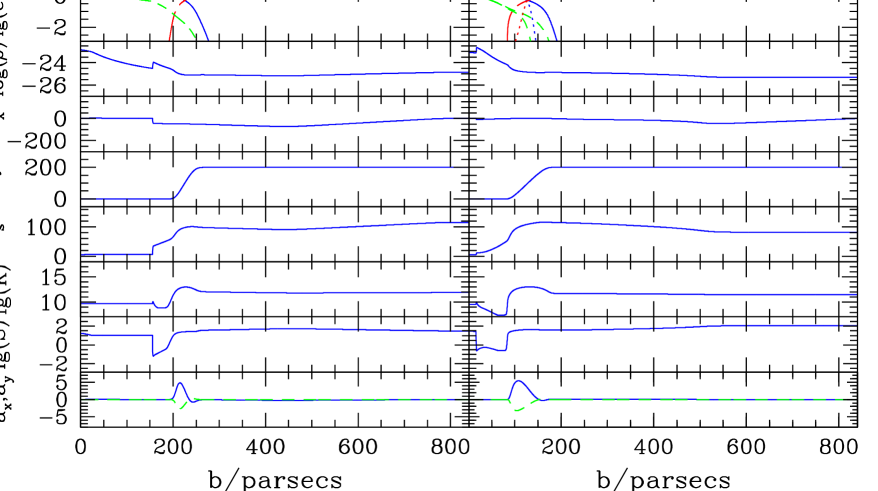
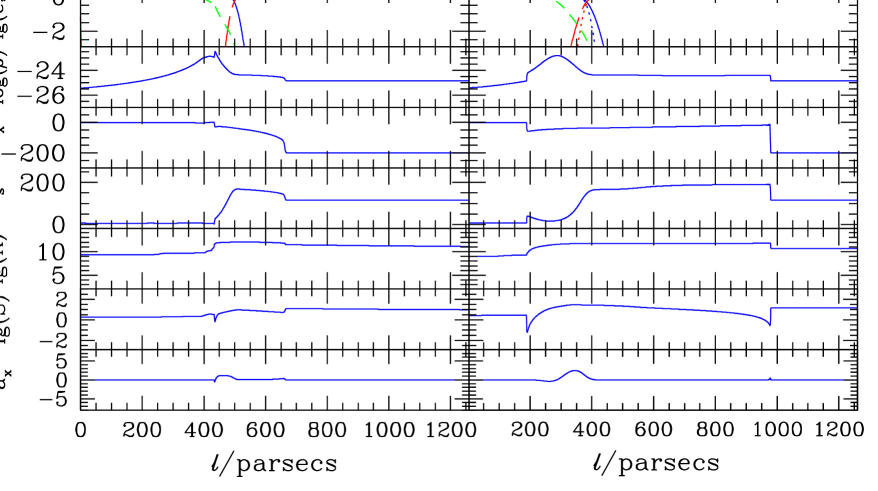
To explore our model in the face-on case, we conducted a second simulation with initial conditions as shown in the left column of Figure 9. Here the simulation domain was divided into three regions, the left two representing the full density profile through the cloud, and the right representing the impinging outflow. The simulation domain was divided into 1200 cells, each with the same width that was used in the edge-on calculation ( parsec). Again the dashed lines in the upper panels represent the total mass of primordial material contained in front of a given value, , where is defined as the distance from the back of the cloud. This mass is calculated using an equation analogous to eq. (40), but now adding over the full cloud such that at the center of the density profile.
Choosing a time step and time unit as in the edge-on case, we ran our simulation to a final time of , with results as depicted in Figures 9 and 10. Again, three major features are visible in the mean-flow quantities. As in the edge-on case, a strong shock and material interface quickly propagate inwards. Initially, the fluid interface moves at the incoming speed of km/s, and and share roughly the relation expected from eq. (42). But as in the Kelvin-Helmholtz problem, both of these features are slowed considerably as they move into the central regions of the cloud, where the gas density becomes large.
Unlike the edge-on case, the third major feature is not a rarefaction wave, but rather a reflected shock, which gains in strength as the inward propagating shock moves into the increasingly dense material. Thus this feature initially moves leftward, at a physical velocity of km/s, but a positive velocity km/s in the frame of the incoming shock. By however, this shock attains a positive physical velocity km/s, and exhibits a density ratio
In the lower three panels of these figures, we again find an increase in the turbulent kinetic energy along the interface, but with a lower overall magnitude than in the shear layer case. In fact, the most efficient source of in this simulation is the backwards moving shock, which is made up completely of enriched gas. This means that mixing in this geometry is less efficient than in the edge-on case, and our results indicate that only of the total cloud mass is able to be enriched before our final time step. Comparing this mixing to an identical run in which was set to zero in eq. (39), we find that much of this mixing is due to numerical diffusion. At least in the one-dimensional case, mixing is dominated by shear, and occurs at a level before the onset of star formation.
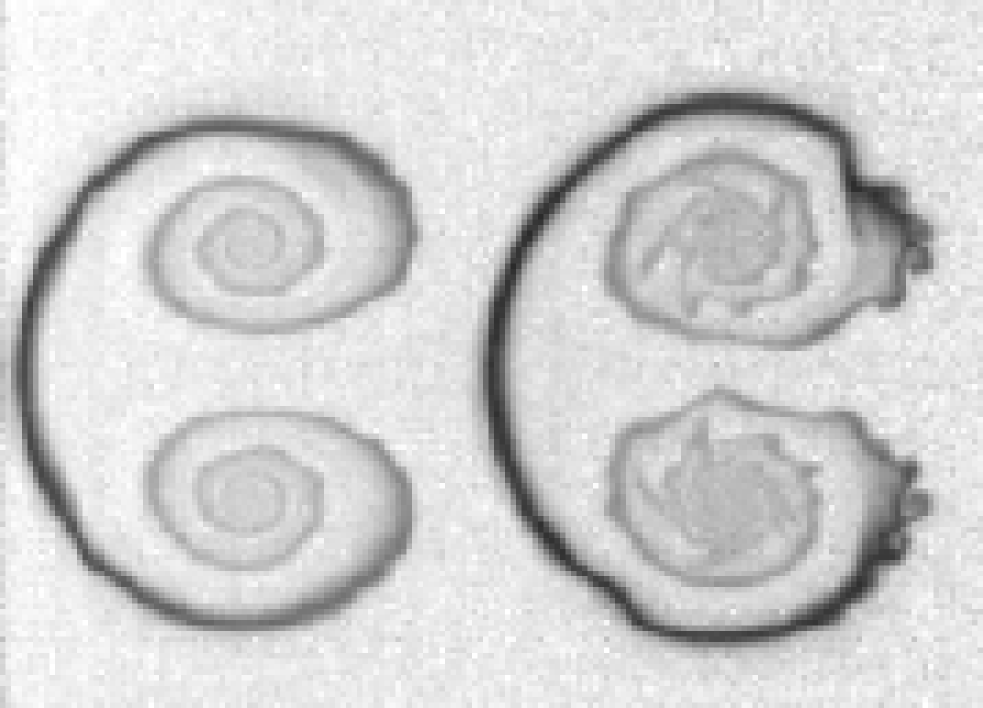
From these calculations we expect a reasonable value for the fraction of impinging metals mixed throughly into the cloud to be . Furthermore, even higher values may be appropriate when the motion of the flow is not constricted to such limited geometries, as hinted at by a feature in our face-on calculations. In the regions between the material interface and the reverse shock, a large turbulence scale length is generated by and grows with time, suggesting that a global instability may be developing within the cloud. In fact, while not strictly turbulence, a global mean-flow distortion is known to arise in an analogous configuration in the laboratory, where it serves as a prime example of the problem of transition to turbulence. In the experimental studies described in Vorobieff et al. (2003), a column of heavy gas (SF6) initially surrounded by air was accelerated by a planar shock. In this case the cloud is observed to deform as an arc, which buckles along the edges. Eventually these edges spiral over themselves, leading to two large counter-rotating vortices as shown in Figure 11. These vortices quickly transition to an overall turbulent flow, unlike the one seen in our one-dimensional studies.
It is this global distortion that is likely to be key in increasing mixing in the post-shock cloud. Indeed, a similar geometry was hinted at by the arcs observed in the jet-cloud interactions studied by Fragile et al. (2004), as well as by the the large-scale vortices observed in the shock-cloud simulations of Klein, McKee, & Colella (1994). However the properties of this overall buckling will undoubtedly be modified by the presence of a radial density gradient, forces due to the dark-matter potential, and self gravity, none of which were included in these studies. Clearly then, for the moment, we can only conclude that the simple Kelvin-Helmholtz and Rayleigh-Taylor instabilities simulated in our one-dimensional calculations are insufficient to produce the observed homogeneity within globular clusters. The question of global mixing requires more extensive modeling, an issue we are actively pursuing and intend to describe in a future publication.
5. Discussion
The first cosmic structures to form are likely not to have been galaxies, but rather lower mass clouds of gas and dark matter too small to cool by atomic processes. In fact, in the Cold Dark Matter cosmological model assumed here, as much as of the total mass is contained in such minihalos by a redshift of 10. Thus these clouds represent a vast reservoir of material that can quickly be converted into stars though shocking and enrichment by neighboring objects.
A second generic feature of any hierarchical model is a high-redshift epoch of galaxy outflows. Although the sizes of galaxies increase strongly with time, internal properties such as the scale of OB associations (McKee & Williams 1997) and the efficiency of energy deposition from supernovae are largely independent of redshift. Thus while the ejecta of conglomerations of Type II SNe are primarily confined to the interstellar medium of large galaxies like the Milky Way forming at , they are easily able to escape from the dwarf galaxies forming at , generating large outflows of material such as are now well-observed in the Lyman break population.
It is clear that these outflows will interact with minihalos, the uncertainty lies only in the nature of that interaction. Through our estimates in §3, we have shown that for a large range of outflow energies, minihalos sizes, and separations, the most likely outcome is a dense cluster of stars that is bounded by self-gravity, but stripped from its associated dark matter. Furthermore the present-day universe has natural candidates for these collections of stars, which formed on the periphery of galaxies.
Although globular cluster formation may well be an ongoing process, the majority of halo globular star clusters are old, and exhibit several features of induced minihalo star-formation. Observations of GC tidal streams show no indication of associated dark mater halos, unlike the accreted dwarf spheroidal galaxies (e.g. Ibata & Lewis 1998; Mayer et al. 2002). GCs also exhibit a maximum mass that can not be understood by dynamical friction or any other known destruction mechanism that operates in the Galaxy. Instead, this value closely corresponds to the minimum gas mass of high-redshift minihalos for which atomic cooling at the virial temperature is effective. Finally, the span of time over which halo GCs form in our model is fairly short, on the order the parent galaxy’s virial radius divided by its outflow velocity. Even for a large galaxy like the Milky Way, Gyr, which is comparable to the observed age spread. Additionally, Freeman & Bland-Hawthorn (2002) have remarked on the fact that halo GCs and stars in the thick disk of our Galaxy have very similar abundances and ages. While some of these disk stars may be from globulars long since destroyed, according to our picture, others may have formed from gas in outflow-enriched protocluster clouds for which the conditions were never conducive to GC formation.
The small range in metallicities amongst the stars within any given cluster points to an external mechanism for enrichment, as provided in our picture. Furthermore the time scale for this enrichment must be short, as the presence of dust and metals will inevitably spark cooling and star formation, which will further enrich material that is not quickly formed into stars. Outflow-minihalo interactions have the potential to achieve such rapid mixing, but order of magnitude estimates can not confirm this definitively. Rather the problem of mixing is a delicate one, in which the time scale for star formation in shocked regions is comparable to the global dynamical time, and the detailed turbulent structure is key. In the numerical studies presented in this paper we have taken a first step towards improving these estimates, exploring a simple model of turbulent mixing in a one-dimensional context. Yet the shear-induced mixing seen in this study highlights the importance of large scale vortices in turbulence generation. Multi-dimensional simulations are necessary to move further, and a definitive answer will require detailed modeling of cooling, gravitation, and perhaps even the turbulent spectral distribution.
Although the issue of mixing is complicated, two properties of the metals available in outflow-minihalo interactions are suggestive of recent GC observations. First, as pointed out by Beasley et al. (2003), no single Pop III object seems capable of producing the typical abundance ratios of heavy elements in GC stars. Some distribution of first generation stars is needed, and a galactic outflow is the likely consequence of several concurrent supernovae. Second, the existence of a correlation between a parent galaxy’s luminosity and the mean color (viz., metallicity) of its GC systems (Strader, Brodie, & Forbes 2004) argues strongly against self-enrichment as the source of a GC’s heavy elements.
Our basic model even enables us to deduce such a dependence. As the efficiency of our scenario is primarily due to an interplay between cooling and sound-crossing times, both which depend on the shock velocity, we fix a typical at which GC formation is effective. From eq. (1) this gives that We then assume that, on average, the total mass in metals and the outflow energy will be proportional to luminosity of the parent galaxy to which the resulting globular cluster belongs, yielding From the simple top-hat collapse model , where is the slope of the primordial power spectrum, so again taking the mass proportional to , we obtain the prediction
| (44) |
where for the CDM model is between -3 and and -2 for the scales of interest. This gives a final index ranging from 1/3 for small galaxies to 0 for the largest ones, bracketing the observed value of 1/6 (Strader, Brodie, & Forbes 2004).
A similar calculation can be carried out to estimate the maximum galactocentric radius of the distribution of halo GCs. Fixing we have
| (45) |
such that for the values appropriate for CDM, the index ranges from for small galaxies to for large galaxies, and the “best-fit” value to the observed metallicity-luminosity relationship gives . As such observations require both high-angular resolution and a wide field of view, no current constraints on this relationship are available in the literature. However, such measurements are well within the capabilities of the Advanced Camera for Surveys on the Hubble Space Telescope and new information in this area should be expected to become available soon. Note that this scaling with luminosity is likely to persist even if substantial “shuffling” of globular clusters within this maximum radius is likely to have taken place, as a large fraction of halo GCs are on close to radial orbits (eg. Dinescu et al. 1999; Wang & Zhou 2003). On the other hand, any initial metallicity gradient established among a galaxy’s halo GCs is expected to be washed-out by this shuffling and possibly by the addition of clusters striped from small, neighboring galaxies. It is also interesting to note that while no clear metallicity gradients have ever been observed in halo GCs, there are hints of a fall off in metallicity with radius in the Milky Way Halo GC population when one attempts to remove accreted systems (Zinn 1993; Parmentier et al. 2001).
While these comparisons are perhaps a bit simplified, it is reassuring that recent investigations not only uncovered a trend with luminosity, but one compatible with our model, and that we are able to construct a simple prediction that will be testable in the near future. Perhaps even more reassuring is the fact that the ideas presented here allow for immediate points of contact between theory and new observations. Although many issues remain to be better understood, our scenario provides clear directions that can lead to more detailed comparisons with various observational constraints. Such future studies may soon shed new light on the old question of the origin of halo globular clusters.
References
- (1)
- (2) Abel, T., Bryan, G. L., & Norman, M. L. 2002, Sci, 295, 93
- (3) Addessio, F. L., Baumgardner, J. R., Dukowicz, J. K., Johnson, N. L., Kashiwa, B. A., Rauenzahn, R. M., & Zemach, C. 1990, CAVEAT: A Computer Code for Fluid Dynamics Problems with Large Distortion and Internal Slip, LA-MS-10613, Los Alamos National Laboratory
- (4) Armandroff, T. C., 1989, AJ, 97 375
- (5) Ashman, K. M., & Bird, C. M. 1993, AJ, 106, 2281
- (6) Ashman, K. M., & Zepf, S. E. 1998, Globular Cluster Systems, (New York : Cambridge University Press)
- (7) Beasley, M. A., et al. 2000, MNRAS, 318, 1249
- (8) Beasley, M. A., Kawata, D., Pearce, F. R., Forbes, D. A., & Gibson, B. K. 2003, ApJ, 596, L187
- (9) Besnard, D., Harlow, F. H., Rauenzahn, R. M., & Zemach, C. 1992, Turbulence Transport Equations for Variable-Density Turbulence and Their Relationship to Two-Field Models, LA-MS-12303, Los Alamos National Laboratory
- (10) Blais-Ouellette, S., Carignan, C., Amram, P., & Côté, S. 1999, AJ, 118, 2123
- (11) Bullock, J. S., Kolatt, T. S., Sigad, Y., Somerville, R. S., Kravtsov, A. V., Klypin, A. A., Primack, J. R., & Dekel, A. 2001, MNRAS, 321, 559
- (12) Bromm, V., Coppi, P. S., Larson, R. B. 2002, ApJ, 564, 23
- (13) Bromm, V., & Clarke, C. J. 2002, ApJ, 556, L1
- (14) Brown, J. H., Burkert, A., & Truran, J. W. 1995, ApJ, 440, 666
- (15) Caputo, F., & Castellani, V. 1984, MNRAS,207, 185
- (16) Carignan, C., & Beaulieu, S. 1989, ApJ, 347, 760
- (17) Carignan, C., Sancisi, R., & van Albada, T. S. 1988, AJ, 95, 37
- (18) Cen, R. 2001, ApJ, 560, 592
- (19) Ciardi, B., Ferrara, A., Governato, F., & Jenkins, A. 2000, MNRAS, 314, 611
- (20) Dalganro, A., & McCray, R. A. 1972, ARA&A, 10, 375
- (21) de Blok, W. J. G., & McGaugh, S. S. 1997, MNRAS, 290, 533
- (22) Dinescu, D. I., Girard, T. M., van Altena,W. F. 1999, ApJ, 117, 1792
- (23) Eke, V. R., Cole, S., & Frenk, C. S. 1996, MNRAS, 282, 263
- (24) Eisenstein, D. & Hu, W. 1999, ApJ, 511, 5
- (25) Elmegreen, B. G., & Efremov, Y. N. 1997, ApJ. 480, 235
- (26) Fall. M. S., & Rees, M. J. 1985, ApJ, 298, 18
- (27) Ferrara, A. 1998, ApJ, 499, L1
- (28) Forbes, D. A., Brodie, J. P., & Huchra, J. P. 1997, AJ, 113, 887
- (29) Fragile, P. C., Murray, S. D., Anninos, P., & van Breugel, W. 2004, ApJ, 604, 74
- (30) Freeman, K. & Bland-Hawthorn, J. 2002, ARA&A, 40, 487
- (31) Frye, B., Broadhurst, T., & Benitez, N. 2002, ApJ, 568, 558
- (32) Fujita, A., Martin, C. L., Mac Low, M.-M., & Abel, T. 2003, ApJ, 599, 50
- (33) Fujita, A., Mac Low, M.-M., Ferrara, A., & Meiksin, A. 2004, ApJ, accepted (astro-ph/0405611)
- (34) Galli, D. & Palla, F. 1998, A&A, 335, 403
- (35) Gnedin, N. Y. 2000 ApJ, 535 530
- (36) Grillmair, C. J., Freeman, K. C., Irwin, M. & Quinn, P. J. 1995, AJ, 109, 2553
- (37) Gunn, J. E. 1980 in Globular Clusters, eds. D.Hanes and B. Madore (Cambridge University Press), 301
- (38) Haiman, Z., Rees, M., & Loeb, A. 1997, ApJ, 476, 458 (erratum 484, 985)
- (39) Harlow, F. H., & Amsden, A. A. 1971, Fluid Dynamics a LASL Monograph LA-MS-4700, Los Alamos Scientific Laboratory
- (40) Harlow, F.H., & Nakayama, P.I. 1967, Phys. Fluids, 10, 2323
- (41) Heger, A. & Woosley, S. E. 2002, ApJ, 567, 532
- (42) Hu, E. M., et al. 2002, ApJ, 568, L75
- (43) Ibata, R., Irwin, M., Lewis, G. F., & Stolte, A. 2001, ApJ, 547 L133
- (44) Ibata, R. A. & Lewis, G. F. 1998, ApJ, 500, 575
- (45) Irwin, M. J.& Hatzidimitriou, D. 1993 in ASP Conf. Ser. 48, The Globular Cluster-Galaxy Connection, eds. G. H. Smith & J. P. Brodie (San Francisco: ASP), 322
- (46) Kitayama, T., Yoshida, N., Susa, H., & Umemura, M. 2004 ApJ, in press, (astro-ph/0405280)
- (47) Klein, R. , McKee, C., & Colella, P. 1994, 420, 213
- (48) Kogut, A. et al. 2003, ApJS, 148, 161
- (49) Krauss, L. M., & Chaboyer, B. 2003, Science, 299, 65
- (50) Lacey, C. & Cole, S., 1993, MNRAS, 262, 627
- (51) Larsen, S. S., Brodie, J. P., Huchra, J. P., Forbes, D. A., Grillmair, C. J. 2001, AJ, 121, 2974
- (52) Launder, B. E., Reece, G. J., & Rodi, W. 1975, J. Fluid Mech, 68, 537
- (53) Li, Y., & Burstein, D., 2003, ApJ, 598, L103
- (54) Mac Low, M.-M., & Shull, J. M. 1986, ApJ, 302, 585
- (55) Mac Low, M.-M., & Ferrara, A. 1999, ApJ, 513, 142
- (56) Madau, P., Ferrara, A., Rees, M. J. 2001, ApJ, 555, 92
- (57) Marín-Franch, A., & Aparicio, A. 2003, ApJ, 585, 714
- (58) Marinoni, C., & Hudson, M. J. 2002, ApJ, 569, 101
- (59) Mashchenko, S. & Sills, A. ApJ, submitted
- (60) Mayer, L., Moore, B., Quinn, T., Governato, F., & Stadel, J. 2002, MNRAS, 336, 119
- (61) McKee, C. F., & Williams, J. P. 1997, ApJ, 476, 144
- (62) McLaughlin, D. E. 1999, AJ, 117, 2398
- (63) Moore, B. 1996, ApJ, 461, L13
- (64) Mori, M., Ferrara, A., & Madau P. 2002, ApJ, 571, 40
- (65) Murray, S. D., & Lin, D. N. C. 1992, ApJ, 400, 265
- (66) Nakasato, N., Mori, M., & Nomoto, K. 2000, ApJ, 535, 776
- (67) Navarro, J. F., Frenk, C. S., & White, S. D. M. 1997, ApJ, 490, 493 (NFW)
- (68) Ostriker, J. P. , Spitzer, L. & Chevalier, R. A. 1972, ApJ, 176, L51
- (69) Ott, J., Martin, C. L., & Walter, F. 2003, ApJ, 594, 776
- (70) Palla, F. & Zinnecker, H. 1988, in IAU Symposium 126: The Harlow Shapley Symposium on Globular Cluster Systems in Galaxies, eds. J. E. Grindlay & A.G. D, Philip (Doredrecht:Reidel), p323
- (71) Parmentier, G., Jehin, E., Magain, P., Noels, A., & Thoul, A. A. 2000, A &A, 363, 526
- (72) Peebles, P. J. E., & Dicke, R. H. 1968, ApJ, 154, 891
- (73) Peng, W. & Weisheit, J. C. 1991, PASP, 103, 891
- (74) Perlmutter, S. et al. 1999, ApJ, 517, 565
- (75) Peterson, J. R. et al. 2003, ApJ, 590, 207
- (76) Pettini, M., Steidel, C. C., Adelberger, K. L., Dickinson, M., & Giavalisco, M. 2001, ApJ, 528, 96
- (77) Press, W. H., & Schechter, P. 1974, ApJ, 187, 425 (PS)
- (78) Rees, M. 2003, in Star and Structure Formation: From First Light to the Milky Way. (available at http://www.exp-astro.phys.ethz.ch/ETH Astro 2003/Talks/rees t.pdf)
- (79) Renzini, A. 1997, ApJ, 488, 35
- (80) Scannapieco, E., Ferrara, A., & Broadhurst, T. 2000, ApJ, 536, L11
- (81) Scannapieco, E., Ferrara, A., & Madau, P. 2002, ApJ, 574, 590
- (82) Scannapieco, E., Schneider, R., & Ferrara, A. 2003, ApJ, 589, 35
- (83) Schweizer, F., Miller, B. W., Whitmore, B. C., & Fall, S. M. 1996, AJ,112, 1839
- (84) Searle, L., & Zinn, R. 1978, ApJ, 225, 357
- (85) Shapiro, P., R., & Kang, H. 1987, ApJ, 318, 32
- (86) Shapiro, P., R., Iliev, I. T., & Raga, A. C. 2004, MNRAS, 348, 753
- (87) Songaila, A. 2001, ApJ, 561, L153 (S01)
- (88) Spergel, D. N. et al. 2003, ApJS, 148, 175
- (89) Spitzer, L., & Thuan, T. X. 1972, ApJ, 175, 31
- (90) Strader, J., Brodie, J. P., & Forbes, D. A. 2004, AJ, in press (astro-ph/0403160)
- (91) Steinkamp, M., Clark, T., & Harlow F. (1999a), Int. J. of Multiphase Flow, 25, 599
- (92) Steinkamp, M., Clark, T., & Harlow F. (1999b), Int. J. of Multiphase Flow, 25, 639
- (93) Suntzeff, N. 1993, in ASP Conf. Ser. 48, The Globular Cluster-Galaxy Connection, ed. G. H. Smith & J. P. Brodie (San Francisco: ASP), 167
- (94) Sutherland, R. S., & Dopita, M. A. 1993, ApJS, 88, 253
- (95) Swaters, R. A., Madore, B. F., & Trewhella, M. 2000, ApJ, 531, L107
- (96) Swaters, R. A., Madore, B. F., van den Bosch, F. C., & Balcells, M. 2003, ApJ, 583, 732
- (97) Tegmark, M., Silk, J., & Evrard, A. 1993, ApJ, 417, 54
- (98) Thacker, R. J., Scannapieco, E., & Davis, M. 2002, ApJ, 581, 836
- (99) Tytler, D., Fan, X. M., Burles, S. et al., 1995, QSO Absorption Lines, Proceedings of the ESO Workshop Held at Garching, Germany, 21 - 24 November 1994, edited by Georges Meylan. Springer-Verlag Berlin Heidelberg New York. Also ESO Astrophysics Symposia, p. 289
- (100) Rauch, M., Sargent, W. L., Womble, D. S., & Barlow, T. A. 1996, ApJ, 467, L5
- (101) Uehara, H., & Inutsuka, S. 2000, ApJ, 531, L91
- (102) van Breugel, W., Filippenko, A. V., Heckman, T., & Miley, G. 1985, ApJ, 293, 83
- (103) van den Bosch, F. C., & Swaters, R. A. 2001, MNRAS, 325, 1017
- (104) Vorobieff, P., Mohamed, N.-G., Tomkins, C., Goddenough, C., Marr-Lyon, M., & Benjamin, R. F. 2003, Phys. Rev. E 68, 65301
- (105) Wang, L. & Zhou, H.-N. 2003, ChA&A, 27, 42
- (106) Whitmore, B. C., & Schweizer, F. 1995, AJ, 109, 96
- (107) Woosley, S. E. & Weaver, T. A. 1995, ApJS, 101, 81
- (108) Yoon, S.-J., & Lee, Y.-W. 2002, 297, 578
- (109) Zinn, R. 1985, ApJ, 293, 424
- (110) Zinn, R. 1993, Stellar Populations, eds. C. A. Norman, A. Renzini, & M. Tosi (Cambridge: Cambridge University Press, 73
- (111)