X-ray/Optical/Radio Observations of a Resolved Supernova Remnant in NGC 6822
Abstract
The supernova remnant (SNR), Ho 12, in the center of the dwarf irregular galaxy NGC 6822 was previously observed at X-ray, optical, and radio wavelengths. By using archival Chandra and ground-based optical data, we found that the SNR is spatially resolved in X-rays and optical. In addition, we obtained a resolution radio image of the SNR. These observations provide the highest spatial resolution imaging of an X-ray/optical/radio SNR in that galaxy to date. The multi-wavelength morphology, X-ray spectrum and variability, and narrow-band optical imagings are consistent with a SNR. The SNR is a shell-shaped object with a diameter of about (24 pc). The morphology of the SNR is consistent across the wavelengths while the Chandra spectrum can be well fitted with a nonequilibrium ionization model with an electron temperature of 2.8 keV and a 0.3–7 keV luminosity of . The age of the SNR is estimated to be years.
1 Introduction
Until recently, only supernova remnants (SNRs) in our Galaxy and the Magellanic Clouds were resolved at X-ray wavelength. However, studies of Galactic SNRs can be limited by the lack of reliable distance estimates, high interstellar absorption at optical and X-ray wavelengths, and the high level of confusion in many Galactic fields (Magnier et al. 1995). These limitations are overcome by studies of SNRs in nearby extragalactic systems such as the Large and Small Magellanic Clouds (see, e.g., Hughes 2001). More recently, Kong et al. (2002, 2003) and Williams et al. (2004) discovered five X-ray resolved SNRs in the nearest (780 kpc) spiral galaxy, M31. More importantly, these SNRs were also seen at optical and radio wavelengths. Such observations provide a rare opportunity to perform multi-wavelength morphological studies of SNRs beyond the Magellanic Clouds.
The question naturally arises whether there are X-ray resolved SNRs in some nearby dwarf galaxies at a distance between the Magellanic Clouds and M31. NGC 6822 is one of the nearest dwarf irregular galaxies in the Local Group beyond the Magellanic Clouds and has a rich history in observations (see, e.g., Perrine 1922; Hubble 1925). At a distance of about 500 kpc (McAlary et al. 1983; Gallart, Aparicio, & Vilchez 1996), NGC 6822 is sufficiently close that one can explore its SNRs with high resolution imaging. However, the relatively high absorption of NGC 6822 is a substantial problem (; Schlegel et al. 1998). Despite its proximity, there is only one known SNR in NGC 6822. The SNR Ho 12 was first identified as an emission-line object by Hodge (1969, 1977) but it was not clear if Ho 12 was an H II region or a SNR. Ho 12 was then confirmed as a SNR based on narrow-band imaging and optical spectroscopy (Smith 1975; D’Odorico, Dopita, & Benvenuti 1980; D’Odorico, & Dopita 1983). In the X-ray band, an X-ray source was found associated with Ho 12 from the Einstein HRI (Markert & Donahue 1985), and ROSAT PSPC (Eskridge & White 1997, EW97 hereafter). Although both Einstein and ROSAT observations indicated that the X-ray source is likely to be a SNR, they could not rule out that it may be an H II region or an X-ray binary. The only published radio detection near Ho 12 was from the Very Large Array (VLA) observations (Dickel et al. 1985). An extended source with an integrated flux density of mJy at 1.4 GHz was associated with Ho 12.
In this paper, we report on an archival Chandra observation of the luminous SNR, Ho 12, in NGC 6822. In addition, we present narrow band optical imagings from the Local Group Survey 111http://www.lowell.edu/massey/lgsurvey (LGS; Massey et al. 2001) and a new radio image of Ho 12 from combined VLA archival data sets. In section 2, we detail the observations and the results from observations in different wavelengths. A discussion about the nature of Ho 12 is presented in section 3.
2 Observations and Results
2.1 X-ray Data
NGC 6822 was observed with the Chandra Advanced CCD Imaging Spectrometer (ACIS-I)222http://asc.harvard.edu/proposer/POG/index.html on 2002 November 4 for 28 ksec. The ACIS data were telemetered in very faint mode (VFAINT). We reprocessed the X-ray data with the newest calibration (CALDB v2.26) and at the same time, we screened the raw data in order to utilize the VFAINT mode, and applied the charge transfer inefficiency correction to correct the loss of charge in a CCD as it is shifted from one pixel to the next during readout333http://asc.harvard.edu/ciao/threads/acisapplycti/. We also removed the 0.5-pixel randomization during the pipeline processing to improve the resolution of on-axis Chandra source444http://asc.harvard.edu/ciao/threads/acispixrand/ (see also Garcia et al. 2001). In order to reduce the instrumental background, we screened the data to allow only photon energies in the range of 0.3–7 keV. We also searched for periods of high background using source free regions but none was present. We therefore used all the data for analysis. Data were reduced and analyzed with the CIAO v3.0.2 package, and spectral analysis was performed with Sherpa v3.0.
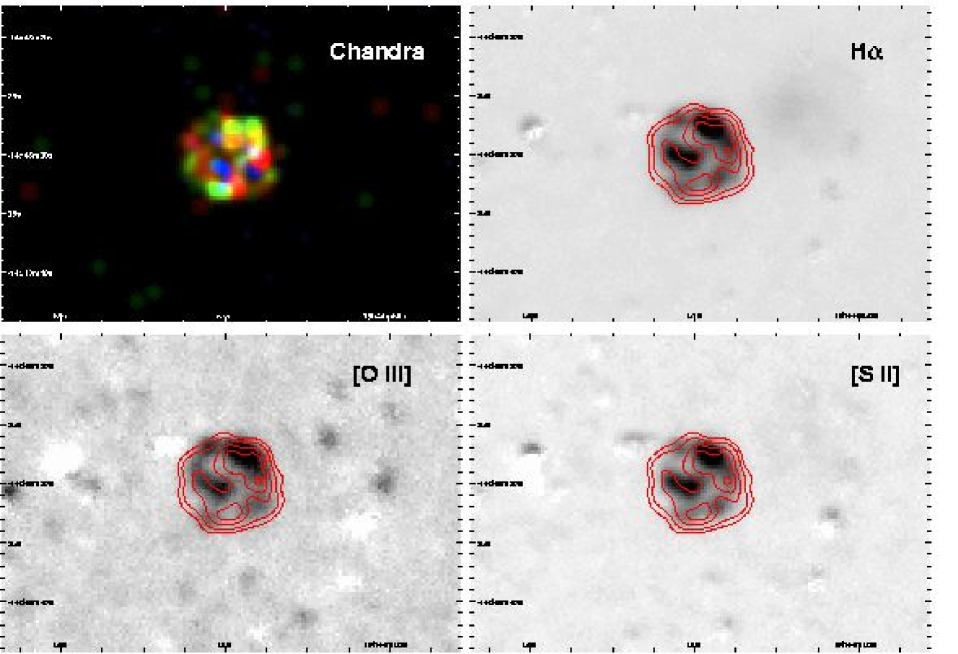
In the Chandra image, it is clear that a bright X-ray source is located at about from the aim-point of the observation. The position of this X-ray source is consistent with previous detections of Ho 12 by Einstein (Markert & Donahue 1985) and ROSAT (EW97). To improve the absolute astrometry of the Chandra data, we cross-correlated detected Chandra sources (by WAVDETECT in the CIAO) with the USNO-B1.0 catalog (Monet et al. 2003). Within of Ho 12, two X-ray sources were less than from bright USNO stars (, ); they are very likely to be foreground stars. We matched the Chandra positions with the USNO stars and shifted the Chandra image by and in right ascension and declination, respectively. After correcting for this aspect offset, the coordinates of the center of Ho 12 are found to be R.A.=19h 44m 56s.5, Decl.= 48′ 30′′ (J2000.0). The source is clearly extended with a diameter of ( pc at 500 kpc). To improve the spatial resolution of the image, we applied subpixel event repositioning (SER) techniques (Li et al. 2004; see also Tsunemi et al. 2001; Li et al. 2003). SER techniques are based on the premise that the impact position of events can be refined, according to the distribution of charge among affected CCD pixels. It is proven that SER techniques can improve the spatial resolution by as much as . We here employed an energy and charge-split dependent SER model on the Chandra image. All the results reported here are based on the reprocessed image. Figure 1 shows the smoothed “true color” X-ray image of Ho 12. The color scheme is defined as 0.3–0.9 keV (red), 0.9–1.5 keV (green), and 1.5–7 keV (blue). It is clear that most of the X-ray emission is from below 1.5 keV.
We extracted the energy spectrum from a radius and background from an annulus centered on the source; the total source counts are 211 while the background subtracted counts are 205.75. In order to allow statistics to be used, the spectrum was grouped into at least 20 counts per spectral bin. The fitting statistic was then used by Sherpa (with CHI DVAR) to find the model parameters that best fit the X-ray spectral data. Response files were created according to the CCD temperature with standard CIAO routines; quantum efficiency degradation of ACIS was also corrected by using the CALDB v2.26. We fitted the data with several single-component spectral models including absorbed power law, blackbody, Raymond-Smith, and nonequilibrium ionization (NEI) models. The Raymond-Smith model is a simple collisional equilibrium ionization model, while the NEI model is appropriate for modeling SNRs whose age is smaller than the time required to reach ionization equilibrium. The NEI model consists of an electron temperature () and an ionization timescale (), where and are the mean electron density and the elapsed time after the plasma was shock heated to a constant temperature . Both models are often applied to study X-ray emission from extragalactic SNRs (see, e.g., Wang 1999; Schlegel, Blair, & Fesen 2000; Hughes, Hayashi, & Koyama 1998). For the Raymond-Smith and NEI models, we fixed the chemical abundances in number of atoms relative to hydrogen (He: , C: , N: , O: , Mg: , Si: , S: ) which gave the best fit from optical spectroscopy (D’Odotico & Dopita 1983). The results of the spectral fits are given in Table 1 and Figure 2. It is clear that except for the NEI model, all models did not give a good fit (). The best-fit electron temperature of the NEI model is keV with cm-2. The Galactic absorption for NGC 6822 is cm-2, while the observed intrinsic column associated with this region of NGC 6822 is about cm-2 (Hodge et al. 1991). Therefore, the absorption derived by our spectral fit is consistent with the optical measurement. The 0.3–7 keV luminosity is ergs s-1.
| Model | a | kT | b | c | dof | |
|---|---|---|---|---|---|---|
| cm | (keV) | |||||
| Power-law | 196 | |||||
| Blackbody | 0.57 | |||||
| Raymond-Smith | 2.38 | |||||
| NEI | 1.60 |
NOTE — All quoted uncertainties are 90% confidence.
a Power-law slope.
b Ionization timescale in units of s cm-3.
c 0.3–7 keV luminosity ( ergs s-1), assuming a
distance of 500 kpc.

2.2 Optical Data
We obtained the H, [O III], [S II], -band, and -band images of NGC 6822 from the LGS. These images have been properly flat-fielded and the geometric distortions removed so that the coordinates in the images are good to and the images at the different bandpasses are registered with one another. We therefore were easily able to subtract the -band continuum from the [O III] image and the -band continuum from the [S II] and H images in order to make the line-emitting sources stand out. These images were then compared to the X-ray images of Ho 12, revealing similar X-ray and optical sizes and morphologies, as shown in Figures 1 and 3.
To provide convenient optical flux estimates for Ho 12 which compliment those from the X-ray and radio data, we roughly calibrated the LGS narrow-band images. The H calibration was done using the bright H II regions Hubble and Hubble (Hubble 1925). The published H fluxes of these objects are 4.8 and 3.8 ergs cm-2 s-1, respectively (O’Dell, Hodge & Kennicutt 1999). We measured the counts of these H II regions in an aperture with 30′′ radius in the star-subtracted LGS H image. These measurements provided a rough calibration for the LGS H image of 6 ergs cm-2 s-1 ct-1. This rough calibration contains a systematic error because the -band contains the H; however, the ratio of the broadband to narrow-band filter widths (1510/80) suggests that the nebular contamination in the broadband filters should be 10%.
We then measured the counts in the star-subtracted LGS narrow-band images of Ho 12 using a 4.5′′ radius aperture. Applying the calibration from Hubble and Hubble , the total H flux of Ho 12 is 6.9 ergs cm-2 s-1. This H flux is in good agreement with the surface brightness measured by Killen and Dufour (1982), which results in a total flux of 8 ergs cm-2 s-1 if a radius of 4′′ is applied.
The emission-line ratios for Ho 12 have already been spectroscopically measured by Smith (1975), who found [S II]/H = 0.5 and [O III]/H = 0.9. Using his reddening value of , we infer an observed [O III]/H = 0.2. These ratios provide [S II] and [O III] total flux estimates of 3.510-14 and 1.510-14 erg s-1 cm-2, respectively. Applying the measured source counts from Ho 12 in the LGS [S II] and [O III] images, rough calibrations for the LGS [S II] and [O III] images of NGC 6822 are 6.6 ergs cm-2 s-1 ct-1 and 1.2 ergs cm-2 s-1 ct-1, respectively. We note that these rough calibrations also contain a systematic error because the -band contains [O III] and the -band contains [S II]; however, the ratio of the broadband to narrow-band filter widths for these bandpasses (940/55 and 1510/81 for /[O III] and /[S II], respectively) suggest that the nebular contamination in the broadband filters should be 10%.
2.3 Radio Data
The radio data were obtained from the VLA archive. It includes the original Dickel et al. (1985) data set taken in 1984, as well as two longer observations taken by others for interests other than the SNR in 1985 and 1995. All three data sets were observed in VLA B-array, i.e., with a spatial resolution of about 5″ at 1.4 GHz. We did not use the 5 GHz observations included in the data as they had different phase centers and thus much less sensitivity on the position of the SNR. After some initial flagging of bad data points, all data sets were reduced with the new VLARUN procedure in NRAO’s AIPS package. The final image was made using the combined data after one iteration of self-cal on strong sources in the field.
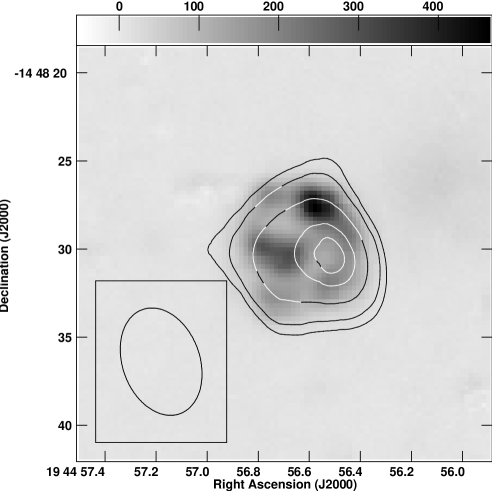
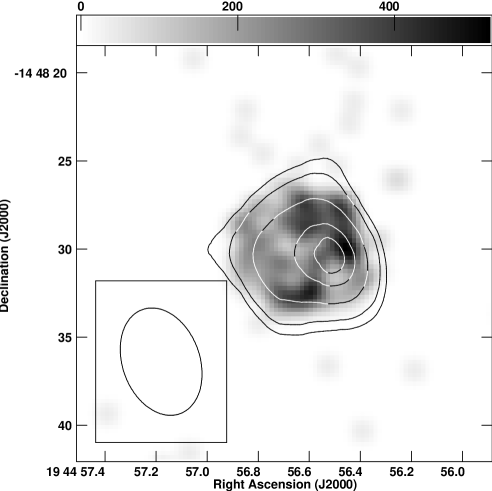
The resulting total effective on-source time of the combined 1.4 GHz observations is about 7 hours, yielding an image noise of about 60 Jy/beam. However, the archival VLA data sets were taken using different calibrators and different epochs. In addition, some of the calibrator positions have been corrected or updated to more acurate positions, resulting in small uncertainties in the radio positions of each individual archival data set. Compared to the NRAO VLA Sky Survey (NVSS555http://www.cv.nrao.edu/nvss/, Condon et al. 1998), we have measured an offset of 4.4″ in R.A. and 0.4″ in Dec. using seven bright radio sources in our final image. Given the measured shift, and the observation that the size and position of the radio source overlap in coordinates with the optical and X-ray source within one beam, we conclude that the radio, optical and X-ray source all are from the same remnant, Ho 12. We have shifted the radio data 3.9″ Westward to obtain the overlays shown in Fig. 3. With the correction in radio coordinates and this shift, this suggests that the Chandra/optical alignment (Sect. 2.1) and radio reference frame coincide within a fraction of 1″, i.e., about one pixel in the Chandra image. Also due to combining different data sets, the spatial resolution () and the deconvolved size of the SNR are different from the values measured by Dickel et al. (1985). The integrated flux of the SNR, 1.570.26 mJy, is nevertheless consistent. The radio data show a shell-type SNR, with a brighter region west of the center, and some asymmetric extentions toward the north and east rims, possibly related to the regions with the brighter H knots. Due to the low resolution, there is no clear correspondence between the radio emission and X-ray knots.
3 Discussion
Ho 12 is clearly resolved with Chandra into a shell-shaped object. The diameter of Ho 12 as measured by Chandra is about , corresponding to 24 pc. The size and the morphology of the X-ray remnant roughly agrees with its optical counterpart. It is therefore no doubt that the X-ray source is the SNR, Ho 12. The X-ray spectrum of Ho 12 can be fit with an absorbed NEI model although the uncertainties of the electron temperature are large due to the low count rate. Using this model, the 0.3–7 keV luminosity of the SNR is about ergs s-1, which is similar to some SNRs in the Magellanic Clouds (e.g., Hughes et al. 1998; Williams et al. 1999). The relatively high electron temperature (2.8 keV) is not unusual; for example, N132D in the Large Magellanic Cloud requires a two-component NEI model for which the temperatures are 0.8 and 2.7 keV (Favata et al. 1997). The usual explanation for the hot component is that it comes from the shock-heated swept-up circumstellar medium or it is due to the inhomogeneity of the interstellar medium (ISM). Assuming Ho 12 is in the adiabatic expansion phase, we can estimate its physical parameters through the Sedov solution. Using Equations (1) and (2) from Kong et al. (2002) and assuming an initial explosion energy of ergs (Blair, Kirshner, & Chevalier 1981), radius of 12 pc, and shock temperature of , we obtain an age estimate of years and a density estimate of cm-3.
The SNR nature of Ho 12 was called into question due to the X-ray variability as observed by Einstein and ROSAT (EW97). However, the Einstein HRI count rate quoted by EW97 was from Fabbiano et al. (1992) in which it was derived from the entire field of view. This is misleading since there is another bright source in the field as discussed by Markert & Donahue (1985). The count rate of Ho 12 measured by Markert & Donahue (1985) is about 33% of the rate used by EW97. If we take this into account, there is indeed no significant variation between the Einstein and ROSAT observations (see Table 1 of EW97). To compare the fluxes derived from different instruments, we converted the count rates into fluxes (0.2–2 keV) by using the best-fit NEI model with PIMMS666http://heasarc.gsfc.nasa.gov/docs/software/tools/pimms.html#user. For the Einstein HRI data (taken in 1979), we derived a background subtracted count rate of 0.0014 c/s which is consistent with Markert & Donahue (1985). We also checked the HRICFA database777http://heasarc.gsfc.nasa.gov/W3Browse/einstein/hricfa.html for which the count rate is corrected for vignetting, deadtime, mirror scattering, and quantum efficiency, the count rate of Ho 12 is 0.002 c/s and we used this value for calculating the flux. For the ROSAT PSPC (taken in 1992), our measured count rate is 0.011 c/s, consistent with the PSPC WGA catalog888http://wgacat.gsfc.nasa.gov. There are two ROSAT HRI datasets (taken in 1995 and 1996; see Zang & Meurs 2001) of Ho 12. From the Brera Multi-scale Wavelet HRI catalog (BMW-HRI; Panzera et al. 2003), Ho 12 was clearly detected with count rates of 0.0035 c/s (1995) and 0.0037 c/s (1996). Our own measurements of the archival data yield 0.0031 c/s and 0.0035 c/s; it was underestimated as we did not correct the count rate for the vignetting and point spread function. We therefore used the values from the BMW-HRI catalog for analysis. Using PIMMS, we derived the history of fluxes (in units of ) as follows: (Einstein HRI), (ROSAT PSPC), , and (ROSAT HRI). The 0.2–2 keV Chandra flux is . The difference among them is less than 20%. Therefore, we conclude that Ho 12 has not shown variability in the past two decades.
At optical wavelengths, Ho 12 is clearly detected as an extended object in the narrow-band LGS images (see Figure 1). The [S II]/H ratio (0.4; Smith 1975; D’Odorico et al. 1980) of Ho 12 is typical of SNRs (e.g. Levenson et al. 1995). The reddening-corrected spectroscopic [O III]/H ratio is low (0.3; Smith 1975). This ratio is about one fourth the ratio predicted for a typical Type IIa SNR shock in a medium with half the solar O abundance (Vancura et al. 1992). The low [O III]/H ratio is therefore reasonable considering the known O abundance of the NGC 6822 ISM (25% solar; Lequeux et al. 1979; Pagel et al. 1980).
Our analysis of archival VLA data provides a tighter constraint on the integrated 1.4 GHz flux density. Dickel et al. (1985) first detected this source as an extended () faint ( mJy at 1.4 GHz) object. However, the noise of their radio image was dominated by confusion due to nearby very bright objects. Therefore, the error of the flux is comparable with the observed value and it cannot be claimed to be a solid detection. We here obtained a more sensitive radio image by adding more observations. The resulting flux is mJy at 1.4 GHz, consistent with Dickel et al. (1985).
The morphology of Ho 12 is very similar across all wavelengths. There is a hint of brightening in the northwestern region from the narrow-band optical images and the Chandra image. Another “bright spot” located at the east side of the remnant in the optical images, however, corresponds to a breakout region in X-rays. There is no sinificant difference in morphology among the three narrow-bands images. In X-ray, although most of the emission is from below 1.5 keV (see Fig. 1 and 2), it is interesting that the distributions of the soft (0.3–0.9 keV) and medium (0.9–1.5 keV) photons are slightly different. The soft band elongates along the northeast-southwest direction, while the medium band tends to distribute along the northwest-southeast direction. Although the radio image of Ho 12 is in low resolution (), the morphology is consistent with the optical and X-ray images. In particular, the assymetry of the radio emission toward the north and east sides may assoicate with the H knots. However, because of the large uncertainty in astrometry and low spatial resolution, these spatial coincidences are difficult to determine and interpret. A high resolution radio image and spectral index measurement of Ho 12 are therefore required to further investigate the radio emission and multiwavelength morphology of the remnant.
References
- (1)
- (2) Blair, W.P., Kirshner, R.P., & Chevalier, R.A. 1981, ApJ, 247, 879
- (3) Condon, J. J., Cotton, W. D., Greisen, E. W., Yin, Q. F., Perley, R. A., Taylor, G. B., & Broderick, J. J. 1998, AJ, 115, 1693
- (4) Dickel, J. R., Silverman, A., & Dodorico, S. 1985, AJ, 90, 414
- (5) D’Odorico, S., Dopita, M. A., & Benvenuti, P. 1980, A&AS, 40, 67
- (6) D’Odorico, S. & Dopita, M. 1983, IAU Symp. 101: Supernova Remnants and their X-ray Emission, 101, 517
- (7) Eskridge, P. B. & White, R. E. 1997, AJ, 114, 988 (EW97)
- (8) Fabbiano, G., Kim, D.-W., & Trinchieri, G. 1992, ApJS, 80, 531
- (9) Favata, F., Vink, J., Parmar, A. N., Kaastra, J. S., & Mineo, T. 1997, A&A, 324, L45
- (10) Garcia, M. R., Kong, A. K. H., Primini, F. A., McDowell, J., & Murray, S. S. 2001, Bulletin of the American Astronomical Society, 33, 1178
- (11) Hodge, P.W. 1969, ApJS, 18, 73
- (12) Hodge, P.W. 1977, ApJS, 22, 69
- (13) Hodge, P.W., Smith, T., Eskridge, P.B., MacGillivray, H., & Beard, S. 1991, ApJ, 379, 621
- (14) Hubble, E. P. 1925, ApJ, 62, 409
- (15) Hughes, J. 2001, in AIP Conf. Proc. 565, Young Supernova Remnants, ed. S. S. Holt & U. Hwang (New York: AIP), 419
- (16) Hughes, J. P., Hayashi, I., & Koyama, K. 1998, ApJ, 505, 732
- (17) Levenson, N. A., Krishner, R. P., Blair, W. P., & Winkler, P. F. 1995, AJ, 110, 739
- (18) Lequeux, J., Peimbert, M., Rayo, J. F., Serrano, A., & Torres-Peimbert, S. 1979, A&A, 80, 155
- (19) Li, J., Kastner, J. H., Prigozhin, G. Y., & Schulz, N. S. 2003, ApJ, 590, 586
- (20) Li, J., Kastner, J. H., Prigozhin, G. Y., & Schulz, N. S., Feigelson, E. D., & Getman, K. V. 2004, ApJ, submitted (astro-ph/0401592)
- (21) Killen, R. M. & Dufour, R. J. 1982, PASP, 94, 444
- (22) Kong, A. K. H., Garcia, M. R., Primini, F. A., & Murray, S. S. 2002, ApJ, 580, L125
- (23) Kong, A. K. H., Sjouwerman, L. O., Williams, B. F., Garcia, M. R., & Dickel, J. R. 2003, ApJ, 590, L21
- (24) Magnier, E. A., Prins, S., van Paradijs, J., Lewin, W. H. G., Supper, R., Hasinger, G., Pietsch, W. & Trüemper, J. 1995, A&AS, 114, 215
- (25) Markert,T. H. & Donahue, M. E. 1985, ApJ, 297, 564
- (26) Massey, P., Hodge, P. W., Holmes, S., Jacoby, G., King, N. L., Olsen, K., Saha, A., & Smith, C. 2001, Bulletin of the American Astronomical Society, 33, 1496
- (27) Monet D. G., et al. 2003, AJ, 125, 984
- (28) O’Dell, C. R., Hodge, P. W., & Kennicutt, R. C. 1999, PASP, 111, 1382
- (29) Panzera M.R., Campana S., Covino S., Lazzati D., Mignani R.P., Moretti A., & Tagliaferri G. 2003, A&A, 399, 351
- (30) Perrine, C. D. 1922, MNRAS, 82, 486
- (31) Schlegel, D. J., Finkbeiner, D. P., & Davis, M. 1998, ApJ, 500, 525
- (32) Schlegel, E. M., Blair, W. P., & Fesen, R. A. 2000, AJ, 120, 791
- (33) Smith, H.E. 1975, ApJ, 199, 591
- (34) Tsunemi, H., Mori, K., Miyata, E., Baluta, C., Burrows, D. N., Garmire, G. P., & Chartas, G. 2001, ApJ, 554, 496
- (35) Wang, Q. D. 1999, ApJ, 517, L27
- (36) Williams, B. F., Sjouwerman, L. O., Kong, A. K. H., Gelfand, J. D., Garcia, M. R., Murray, S. S. 2004, ApJ, submitted
- (37) Williams, R., Chu, Y.-H., Dickel, J., Petre, R., Smith, R.C., Tavarez, M. 1999, ApJS, 123, 467
- (38) Zang, Z, & Meurs, E.J.A. 2001, ApJ, 556, 24
- (39)