[O i] 6300 Å Emission from Disks Around Herbig Ae/Be Stars 11institutetext: European Southern Observatory, Karl-Schwarzschild-Str. 2, D–85748 Garching bei München, Germany 22institutetext: Instituut voor Sterrenkunde, Katholieke Universiteit Leuven, Celestijnenlaan 200B, 3001 Leuven, Belgium 33institutetext: Max-Planck-Institut für Astrophysik, Postfach 1317, D–85748 Garching bei München, Germany
[O i] 6300 Å Emission from Disks Around Herbig Ae/Be Stars
Abstract
We present high spectral-resolution optical spectra of 49 Herbig Ae/Be stars in a search for the [O i] 6300.2 Å line. The vast majority of the stars in our sample show narrow (FWHM 100 km s-1) emission lines, centered on the stellar radial velocity. Some stars in our sample show double-peaked lines profiles, with peak-to-peak separations of 10 km s-1. The presence and strength of the [O i] line emission appears to be well correlated with the far-infrared energy distribution of each source: stars with a strong excess at 60 m have in general stronger [O i] emission than stars with weaker 60 m excesses. We interpret the [O i] 6300.2 Å line profiles as arising in the surface layers of the protoplanetary disks surrounding Herbig Ae/Be stars.
1 Observations
High-resolution optical spectra of 49 Herbig Ae/Be stars were obtained with the Coudé Echelle Spectrograph ( = 130,000) on the ESO 3.6 m telescope, the Echelle spectrograph on the Mayall 4m telescope at KPNO ( = 30,000) and the Utrecht Echelle Spectrograph on the William Herschel Telescope ( = 45,000). The spectra were examined for the presence of the [O i] 6300.2 Å line – the strongest forbidden emission line at optical wavelengths. We detect [O i] 6300.2 Å in emission in 39 out of the 49 sources in our sample. The vast majority of these sources show narrow (FWHM 100 km s-1) profiles, centered on the stellar radial velocity or slightly blue-shifted (centroid position up to 70 km s-1). In only three sources in which [O i] emission was detected, the feature is much broader ( 400 km s-1) and strongly blue-shifted ( 200 km s-1) with respect to the stellar radial velocity.

2 Analysis of Emission Lines
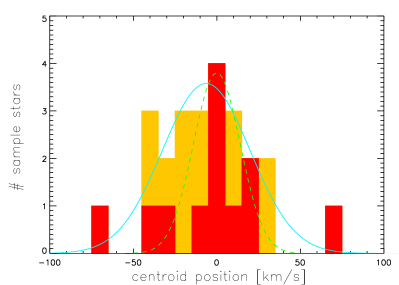
A more careful inspection of the centroid velocities of the detected [O i] emission lines shows that the vast majority of Herbig Ae/Be stars have centroid velocities that are close to the stellar radial velocity. Nevertheless, there appears to be a small minority of Herbig stars that show slightly (up to 70 km s-1) blue-shifted centroid velocities as well (Fig. 2).
In general, the lines – all of which are resolved at our spectral resolution – are narrow (FWHM 100 km s-1), without any obvious dependence of line width on line strength (Fig. 3). A noticeable exception to this general rule are the three embedded sources PV Cep, V645 Cyg and Z CMa, which show strong, much broader (FWHM 400 km s-1) and strongly blue-shifted [O i] emission lines.
Our high spectral resolution and high S/N spectra allow us to resolve the line profiles exhibited by the narrow emission components. Although the line profiles in most stars are single-peaked and symmetric, there are clear examples in our sample of stars showing double-peaked line profiles with peak-to-peak separations of 10 km s-1, with the wings of the spectral line extending to 40 km s-1. If we assume that these profiles are due to material that is in Keplerian rotation around the star, these lines would be formed at radii of 1–60 AU from the central star. These are exactly the types of profiles and radii that would correspond to a location in the protoplanetary disks surrounding Herbig Ae/Be stars.

3 Correlations with Other Properties
One of the more striking features of the [O i] emission exhibited by the stars in our sample is the large range in [O i] emission line strength. Although stars with higher luminosities display on average also stronger [O i] emission, for stars with [O i] 6300.2 Å line luminosities below a few times 10-6 L⊙ there are roughly equal numbers of stars in which we detect and do not detect significant [O i] emission, regardless of stellar luminosity. This behaviour is reminiscent of what was recently found for the infrared emission bands due to Polycyclic Aromatric Hydrocarbons (PAHs) (Acke & van den Ancker 2004). Remarkably, the correlation between PAH and [O i] luminosity appears fairly tight (Fig. 5).


4 Discussion and Conclusions
As shown above, the observed [O i] 6300.2 Å emission is believed to originate from the circumstellar disk. Typical disk temperatures are much too low to explain the strength of the observed lines through thermal emission. However, the chemical reaction OH + H O + H2 leaves a significant fraction of the produced Oxygen atoms in the state; the upper level of the 6300.2 Å line (e.g. Störzer & Hollenbach 2000). We suggest here that the bulk of the observed [O i] emission is non-thermal and produced by the photo-dissociation of OH. Since this latter process critically depends on the ability of stellar UV photons to reach the OH molecule, we expect disk geometry to have a significant effect on the strength of the [O i] 6300.2 Å line in Herbig Ae/Be stars.
The spectral energy distribution (SED) of Herbig stars can be roughly classified in two groups: group I are sources with a strong mid-IR (20–100 m) excess, group II have more modest mid-IR emission (Meeus et al. 2001). Dullemond (2002) interprets this classification in terms of disk geometry: group I sources have flared disks, group II self-shadowed disks (Fig. 6). The classification of the sources can be expressed in a diagram such as shown in Fig. 7. The strong mid-IR group I sources are redder than the group II sources and appear in the lower right part of this diagram. Group II sources are clearly more moderate [O i] emitters than group I sources. The flaring of the disk in group I sources makes that the surface layers of the disk directly see the stellar UV photons capable of photo-dissociating OH. In group II sources, the outer parts of the disk lie in the shadow of the puffed-up inner rim and hence receive almost no direct stellar radiation. The observed strong difference in [O i] 6300.2 Å emission properties is therefore consistent with our previous interpretation of the [O i] emission as being due to the photo-dissociation of OH.


References
- (1) Acke B., van den Ancker M.E., 2004, A&A, in press; astro-ph/0406050
- (2) Dullemond C.P., 2002, A&A 395, 863
- (3) Meeus G., Waters L.B.F.M., Bouwman J., et al., 2001, A&A 365, 476
- (4) Störzer H., Hollenbach D., 2000, ApJ 539, 751
- (5) van Boekel R., Waters L.B.F.M., Dominik C., et al., 2003, A&A 400, 21