11email: areiners@astron.berkeley.edu 22institutetext: Hamburger Sternwarte, Universität Hamburg, Gojenbergsweg 112, 21029 Hamburg, Germany 33institutetext: Observatoire de Genève, 51 chemin des Maillettes, 1290 Sauverny, Switzerland
33email: frederic.royer@obs.unige.ch 44institutetext: GEPI, CNRS UMR 8111, Observatoire de Paris, 5 place Janssen, 92195 Meudon cedex, France
Altair’s inclination from line profile analysis††thanks: Based on observations carried out at Observatoire de Haute-Provence (OHP), at the German-Spanish Astronomical Centre, Calar Alto, and retrieved from the Elodie Archive at Observatoire de Haute-Provence (OHP)
We present a detailed spectroscopic study of line broadening in the A7IV-V star Altair. In a wavelength region covering 690Å we reconstruct the overall broadening profile taking into account more than 650 spectral lines. From the broadening profile we determine the projected rotational velocity , derive an upper limit for the equatorial velocity from the shape of the profile and search for signatures of differential rotation. Our redetermined value of is () km s-1. Measuring the first two zeros of the Fourier transformed broadening profile yield no signatures of differential rotation. We derive that Altair is seen under an inclination angle higher than and it rotates at km s-1 or slower than 53% of breakup velocity on a level.
Key Words.:
stars: rotation – stars: early-type – line: profiles – stars: individual(Altair)1 Introduction
As the 12th brightest star in the sky, Altair ( Aql, HR 7557, HD 187 642) has been extensively studied in the literature. Recently Buzasi et al. (2004) list most of its physical parameters in their introduction. Altair is an A7IV-V main sequence star known to be a fast rotator with a projected rotational velocity km s-1 (Royer et al. 2002). At a distance of pc (ESA 1997), it is one of the nearest bright stars, allowing van Belle et al. (2001) to measure the oblateness of the star using interferometric observations. They derived an axial ratio and a value for the of km s-1. Interferometry also allows to make constraints on stellar inclination – a parameter usually not available from standard spectroscopic techniques. Their determination of the inclination of the rotational axis ranges from ° to ° within 1 (van Belle et al. 2001, Fig. 5).
Spectroscopic techniques are usually not sensitive for inclination in “classical” case of spherical stars. On the contrary, for fast rotators, the stellar surface is distorted by centrifugal forces and line profiles depend on the angle between the rotational axis and the line of sight. Moreover, in such objects effective temperature varies with gravity over the stellar surface: this is the gravity darkening (von Zeipel 1924).
Scrutinizing the shape of individual lines, Gulliver et al., (1994) determined the inclination angle of Vega from spectroscopic data. In a more general context, Reiners, (2003) shows the effects of inclination and gravity darkening on line profiles of fast rotators in the Fourier domain. He showed that in spectra of fast rotators the unprojected rotational velocity is measurable directly from the line shape. It is the aim of this paper to put stronger constraints in deriving the inclination of Altair from spectroscopic measurements by measuring its (unprojected) equatorial velocity and the .
2 Data
2.1 Altair data
Altair has been observed on October 1st 2003 with the ÉLODIE échelle spectrograph (Baranne et al. 1996) at Observatoire de Haute-Provence. The wavelength coverage spans from 3850 to 6800 Å, with a resolving power of . Five single exposures have been taken, details about the observational data are listed in Table 1.
The orders of the échelle spectrum have been merged using the method by Erspamer & North (2002). The barycentric radial velocity correction varies of about km s-1 in the short time interval of the observations, and meanwhile, the peculiar radial velocity of Altair is not expected to change significantly. The comparison of wavelength positions for telluric lines (O2) insures that no significant instrumental wavelength shift occurred between the consecutive exposures, and the merged spectra are therefore simply co-added.
| Object | Sp.Type | Instrument | HJD | S/N | ||
|---|---|---|---|---|---|---|
| Altair | A7IV/V | ÉLODIE | 2452914.2574 | 180 | ||
| 2452914.2600 | 200 | |||||
| 2452914.2628 | 280 | |||||
| 2452914.2655 | 230 | |||||
| 2452914.2683 | 250 | |||||
| HD 27 819 | A7IV/V | ÉLODIE | 2450499.4221 | 180 | ||
| Boo | A7III/IV | FOCES | 2452336.0736 | 300 | ||
| HD 118 623 | A7III | FOCES | 2452332.1416 | 300 |
2.2 Calibration data
We used spectra of three stars of similar spectral type to calibrate our measurements in Altair’s spectrum. Spectra observed with the FOCES spectrograph at the 2.2m telescope at the German-Spanish Astronomical Centre, Calar Alto, were taken in February 2002, for details on the reduction cf. Reiners & Schmitt, (2003). The spectrum of HD 27 819 was taken from the ÉLODIE Archive111http://atlas.obs-hp.fr/elodie/. The calibration stars are listed in Table 1.
3 Continuum normalization
Analyzing spectral line shapes severely depends on the determination of the continuum flux. In spectra of stars with rotation rates as high as Altair’s, spectral lines are severely blended and the flux hardly reaches the continuum in any spectral region. Thus, normalizing Altair’s spectrum by eye-guided continuum fitting would always assume too low a continuum which significantly affects the shape of the line profiles.
Thus we took high quality spectra of other stars of similar spectral types, some of them having considerably lower rotation rates; in their spectra the continuum is nicely visible. From the FOCES campaign we took two stars; HD 118 623 is an A7III with a rotational velocity very similar to Altair. Boo has a rotational velocity of km s-1, i.e. significantly lower than that of Altair and HD 118 623. In the spectrum of Boo flux reaches continuum level in some regions and continuum fitting is possible.
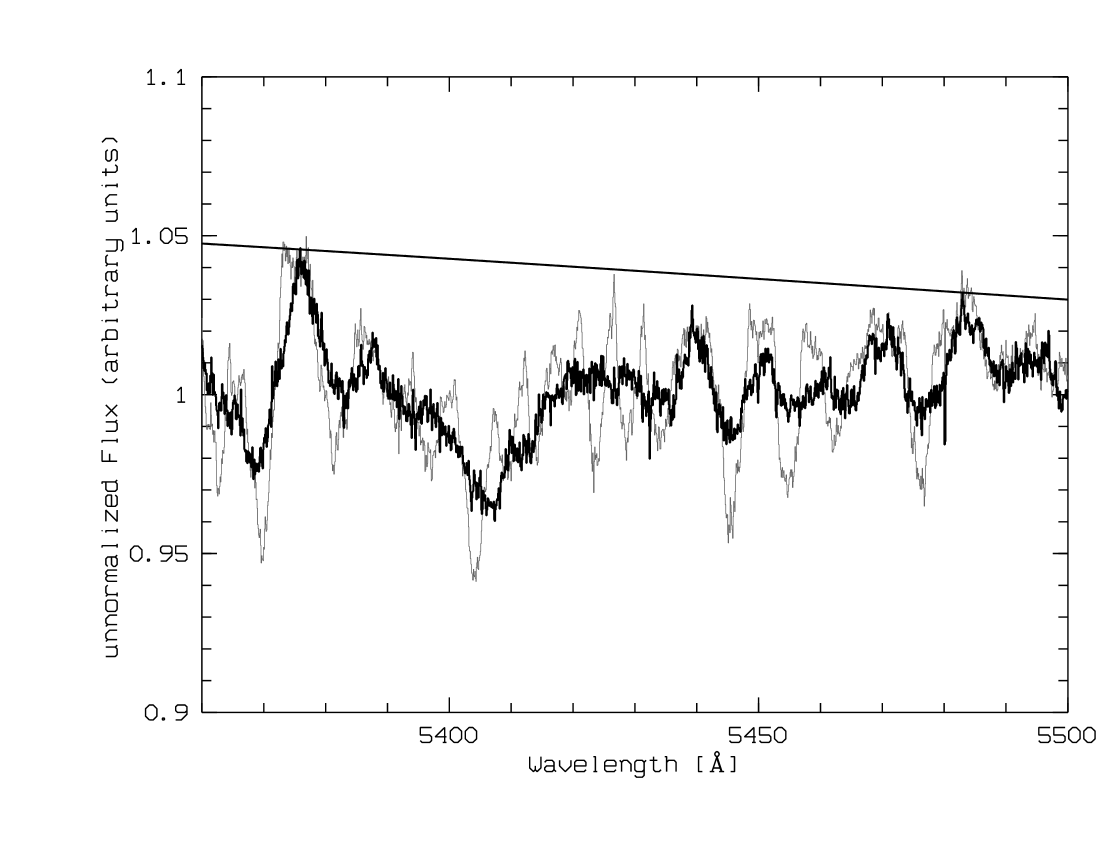
The spectrum of Boo was normalized by fitting the regions where flux reaches continuum level. We also used this spline fit to normalize the spectrum of HD 118 623 which was taken during the same observing campaign in the same instrument setup. The coincidence of their unnormalized spectra is shown in Fig. 1, giving reason for using identical normalization functions.
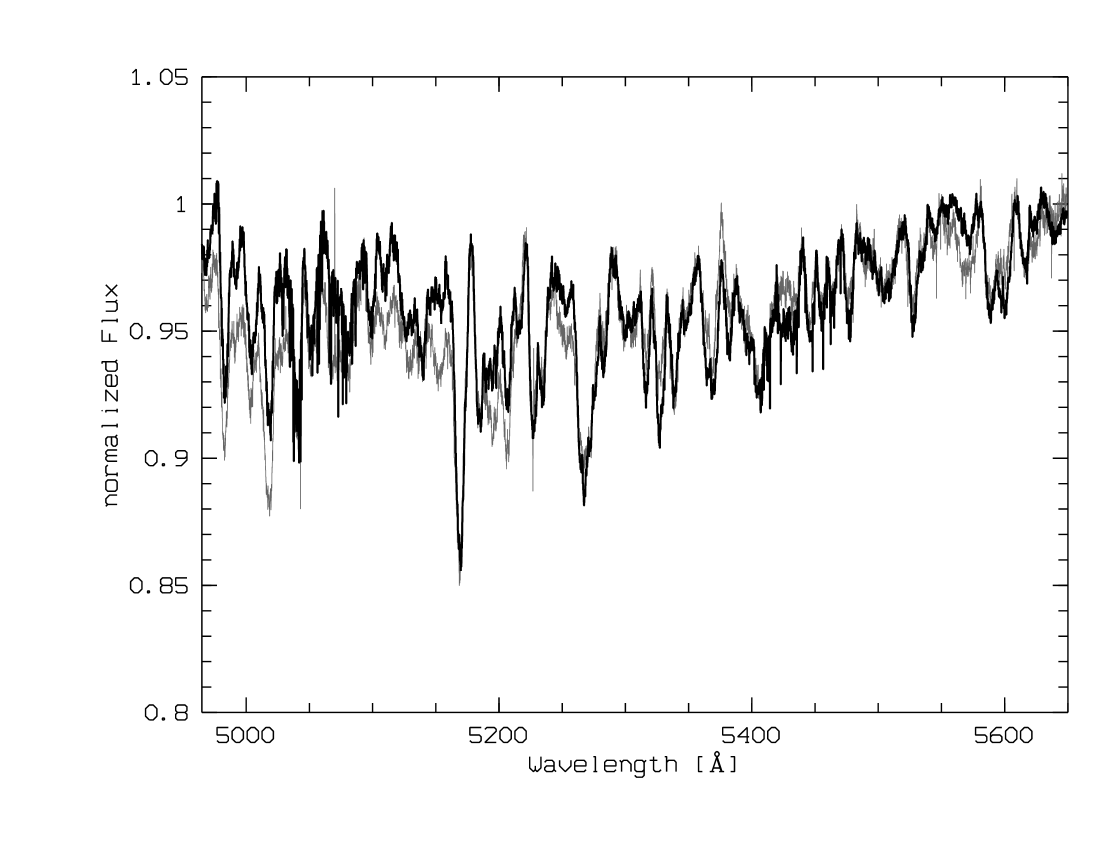
With a normalized spectrum of HD 118 623, a star being similar to Altair with respect to spectral type and projected rotational velocity, we could then normalize the spectrum of Altair by matching its overall spectral shape to that of HD 118 623. Both normalized spectra are shown in Fig.2 in the whole wavelength region we used in the following.
4 Reconstructing the global broadening function
Spectra of stars rotating as fast as Altair are completely dominated by rotational broadening. Temperature broadening and turbulent motions are about two orders of magnitude smaller than rotation. Rotation affects all spectral lines in the same characteristic manner. However, the assumption we have to make is that the line profiles of individual lines do not significantly (at least not systematically) vary across the stellar disk. For individual lines this is not true, but using hundreds of lines of different species, variations among different lines are expected to level out. What one gets is a profile which reflects the mean rotational broadening affecting all lines. This method is in contrast to studying individual lines (e.g., Gulliver et al., 1994) and line-specific variations with temperature or gravity are not taken into account. For the case of Altair, systematic effects are not expected to be as severe as, e.g., for the case of Vega. We will discuss that point in Sect. 5.1. However, individual line profiles are severely blended in Altair’s spectrum making studies of individual lines difficult and we think that recovering line broadening from as many lines as possible yields the most reliable information about stellar rotation.
The reconstruction of Altair’s mean broadening profile is done by a deconvolution algorithm. The algorithm searches the function that gives the best fit to the data when being convolved with a given template. Thus the template is required to be a precise spectrum of the star without rotation (neglecting other broadeners). Since no such template is available we usually try to simultaneously fit the line strengths, i.e., equivalent widths, of all spectral lines (cp. Reiners & Schmitt, 2003). In the case of Altair, however, blending of the large amount of spectral lines due to high rotational velocity is so severe, that simultaneously fitting the broadening function and line strengths is not possible. We thus did not determine the template from the spectrum of Altair but from a spectrum of a star of similar spectral type.
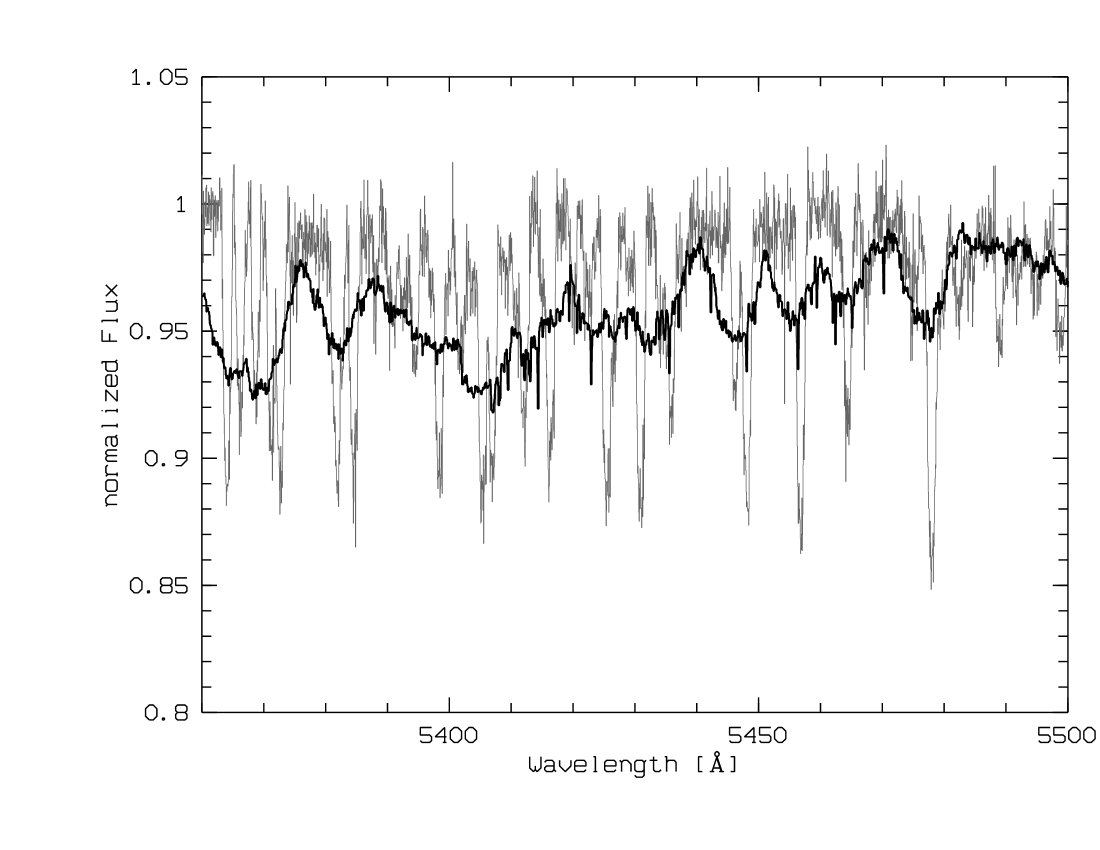
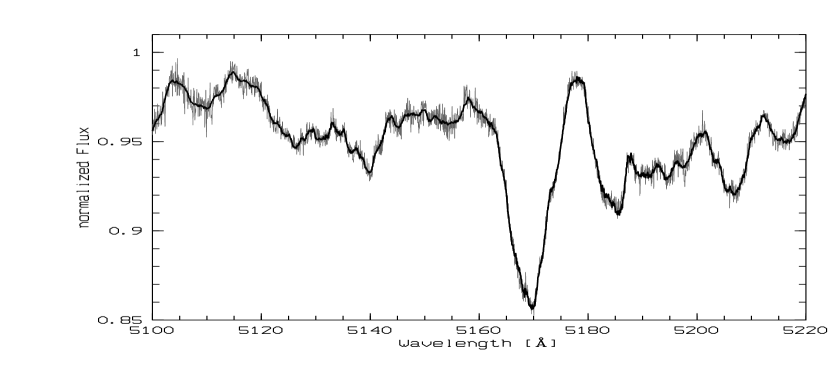
In spectra of slower rotators with less severe blending, simultaneously fitting the broadening function and line strengths is achievable. From the ÉLODIE-Archive we took a spectrum of HD 27 819, a A7IV-V star rotating at km s-1. Normalization was made by eye using the clearly visible continuum. A comparison of the normalized spectra of Altair and HD 27 819 is shown in Fig. 3; spectral similarity is clearly visible. For this “slow” rotator HD 27 819 the broadening function and line strengths were derived iteratively from the spectrum using our deconvolution algorithm (cp. Reiners & Schmitt, 2003). We used the whole wavelength region between Å and Å. In this spectral region all lines are dominated by rotation, i.e., hydrogen lines are not contained. Roughly 650 spectral lines were used in the fit. Wavelength information was taken from the Vienna Atomic Line Database (Kupka et al., 1999, VALD).
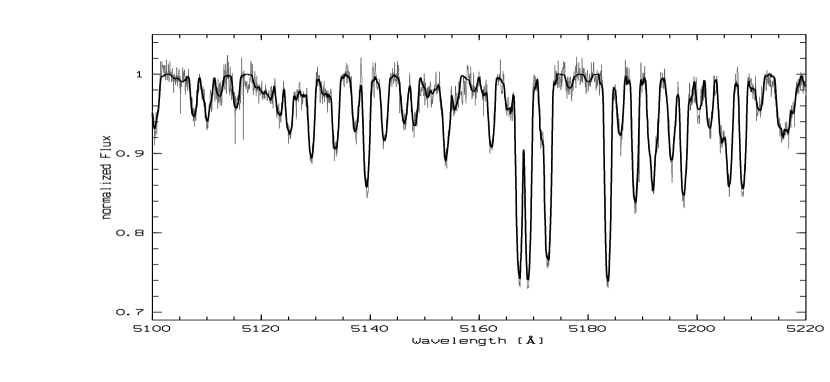
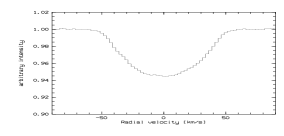
The result of this procedure is shown in Fig. 4 where we plot the result of convolving the recovered broadening function – shown in the inset – with the optimized template. Note that each pixel of the broadening function is a free parameter in the algorithm and that the broadening function resembles nicely symmetric rotational broadening (from the profile we derive a of 46 km s-1). The data (grey line) is reproduced in great detail; since individual lines are not severely blended ambiguities between the shape of the broadening function and line strengths are very small.
For the deconvolution of Altair’s broadening profile we now used the same optimized template, i.e., the same line strengths as derived for HD 27 819. Note that the observed spectrum of HD 27 819 could not be used as a template since it already is broadened by km s-1 and a convolution of two rotational broadening functions does not yield a third one. From the normalized spectrum of Altair we finally derived the profile that gives the smallest chi-square when convolved with this delta-like template.
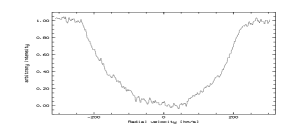
A small region of the result is shown in Fig. 5, fit quality is representative for the whole wavelength region. The derived broadening function is shown in the inset. Note that no additional changes were made to the continuum and that the broadening function is nicely symmetric. A small linear slope in the overall appearance might be visible. While this slope is likely due do tiny continuum mismatch, however, it does not significantly affect the line shape. The pixel size used is only a fraction of the instrument’s resolution and the small jitter in the broadening function is numerical. Taking the jitter as signal-to-noise ratio (S/N) yields values of several thousands. We calculated the variance of each pixel in the chi-square fit with regard to the two nearest neighbors of each pixel. This also yields a S/N of several thousands. Unfortunately, uncertainties in the broadening function are dominated by our knowledge of the continuum and by systematically incorrect line strengths (in detail, line strengths of Altair definitely differ to those of HD 27 819). For the calculation in what follows we estimate a rather conservative S/N of 1000 as the “”-level. Consequently we use a S/N of 500 for our calculations of borders. In the left panel of Fig. 6 the global broadening function of Altair is plotted with error bars according to a S/N of 1000.
The global broadening function shows small asymmetries. From our analysis we can not say whether these asymmetries are real or due to incorrect line strengths in the template. However, within the error bars the broadening function is symmetric, i.e. the broadening function mirrored at the center falls withing the error bars.
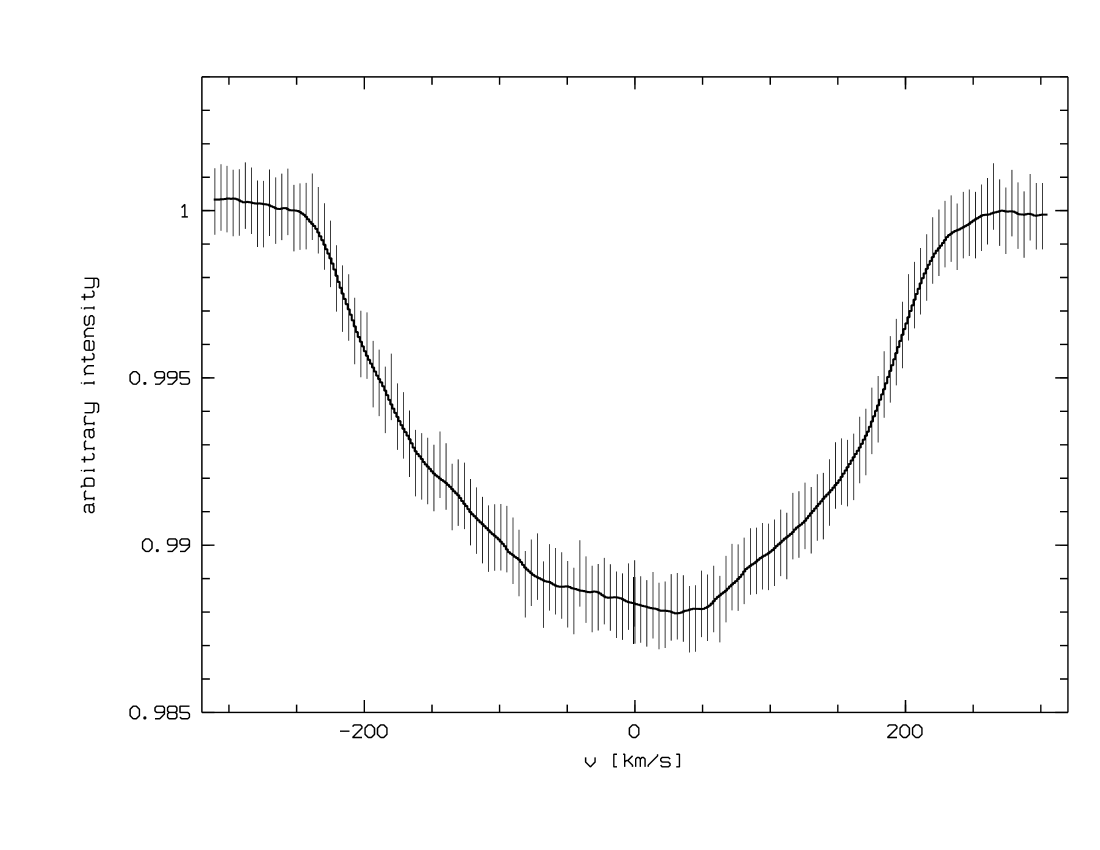
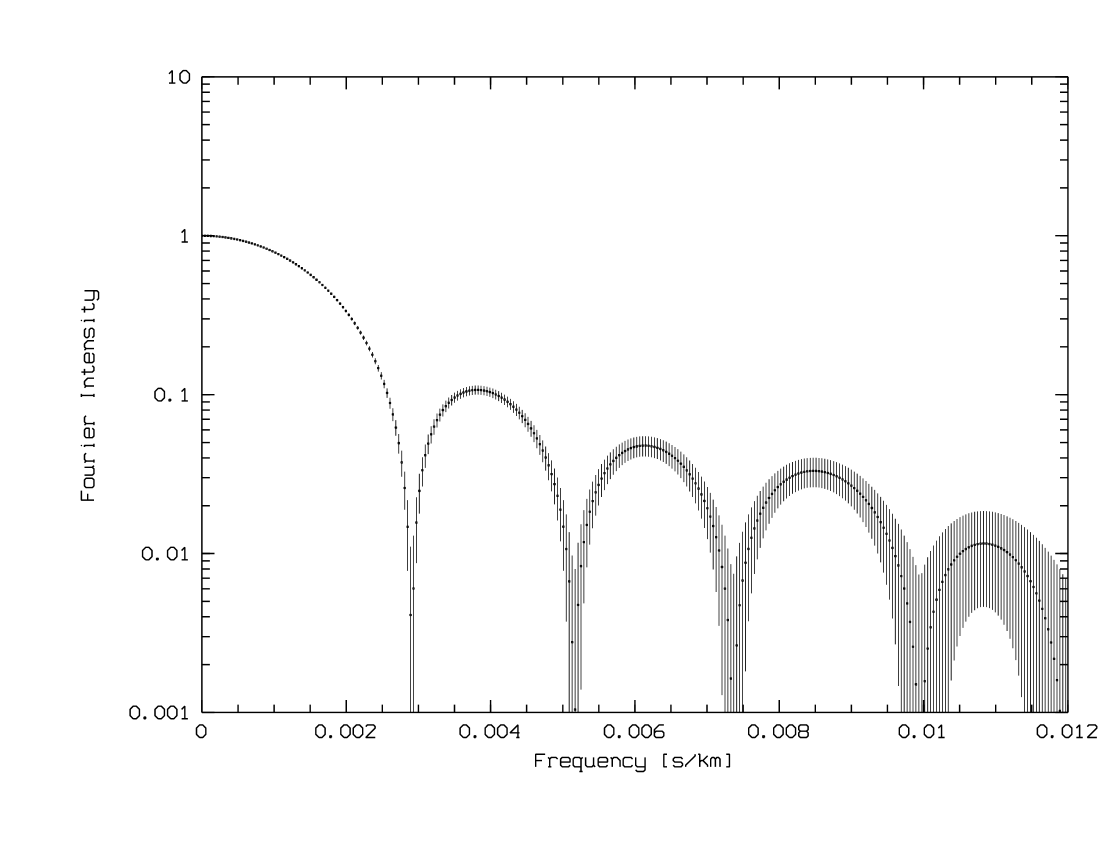
In the right panel of Fig. 6 the Fourier transform of the derived broadening function is shown with the respective error bars. The signal can clearly be followed up to the third sidelobe before it reaches noise level. In the calculation of and only the positions of the first two zeros are needed; apparently both are well defined.
5 Spectroscopic rotation and inclination
Studying the characteristics of rotational broadening, zeros of the broadening profile’s Fourier transform are convenient observables (cp. Gray, 1992). Since convolutions in Fourier domain become multiplications, especially zeros inferred from any broadening mechanism remain unchanged by other effects like turbulence etc.; the intensity is changed – the position of the zeros is not. In case of a star rotating as fast as Altair, no effects are expected inferring signatures at frequencies as low as those inferred by rotation. Thus, measuring Fourier transform zeros is a very robust method to access rotational broadening – and the zeros can easily and precisely be determined. The first zero is frequently used to determine stellar projected rotational velocities , as shown in Dravins et al., (1990) for the case of linear limb darkening.
Effects of rotation and inclination on absorption line profiles have been studied by Reiners, (2003). He shows that the ratio of the first two zeros and is sensitive for very fast rotation. He concludes that the ratio does not depend on the value of , but on the equatorial velocity regardless of the inclination angle (and on the rotation law, see Sect. 5.2). Thus measuring from and from the ratio yields the value of the inclination angle !
By modeling absorption profiles of fast rotators, Reiners, (2003) finds that the ratio can be expressed as
| (1) |
Values of and are given for different stellar models in Table 1 of that paper. The mechanism determining the values of and is gravity darkening described by the parameter in
| (2) |
with the stellar surface gravity. For Altair we get a value of from the tables given in Claret, (1998), i.e. the results calculated by Reiners & Schmitt, (2003) for the case of an F0 star are directly applicable to Altair. Thus, for the parameters in Eq. 1 we find and .
Our measurements of the first two zeros and of the broadening profile’s Fourier transform are given in Table 2. Assuming a linear limb darkening law with a limb darkening parameter we calculate Altair’s projected rotational velocity as km s-1. Note that the formal error due to the uncertainty of is given. We estimate the systematic error in to be about 5% due to continuum and line strength uncertainties (cp. Reiners & Schmitt, 2003). From Eq. 1 we can calculate Altair’s equatorial velocity from the ratio .
In the left panel of Fig. 7 is plotted as a function of with our measurement of overplotted as a horizontal line, and the measurement of overplotted with its and error levels as vertical lines. The plot shows, that is generally expected being smaller than 1.765, i.e. the measured value of is not expected for any possible inclination angle. However, within the region we find possible values of which are also consistent with the measured value of .


Calculating Altair’s inclination angle from the measured and we find . We plot in the right panel of Fig. 7. and confidence levels in and systematic errors of 5% in are indicated by dashed lines. We find that our measurements of and are consistent within the level for values of .
5.1 Intrinsic line variations
Variations of line profiles and line strengths have not been taken into account in our procedure of line profile reconstruction. For the case of Vega (A0V), Gulliver et al., (1994) showed that for the two lines they used line intrinsic effects dominate the line profile; they observe a flattened profile instead of a cuspy shape. The difference to our method is twofold: (i) gravity darkening as expressed in terms of the parameter (Eq. 2) is only 0.09 for our case of Altair while it is 0.25 for the case of Vega. Temperature variations with gravity are thus much weaker in the case of Altair; (ii) our reconstruction procedure uses about 650 lines to determine the shape of the line profile; we get a weighted mean of 650 line profiles. Although we do not know specific temperature dependencies for all lines, we do not expect them to be systematic. Studying temperature and gravity dependence of line strengths and shapes for different spectral types would significantly reduce the systematic errors but is beyond the scope of this paper. For this study we estimate the systematic errors as given below and leave the detailed study for a forthcoming publication.
5.2 Differential rotation?
It has been argued that Altair might undergo substantial surface differential rotation since it was found to be an X-ray source (Ferrero et al. 1995). The parameter is also a sensitive indicator for solar-like surface differential rotation with the equator rotating at higher velocity than the polar regions do. In the case of differential rotation, is expected to be significantly smaller that 1.75 which is not the case for Altair. We thus conclude that no signatures of solar-like differential rotation could be found in the line profiles of Altair, i.e. solar-like differential is not stronger than 10% (Reiners & Schmitt 2002). However, Altair is at least two orders of magnitude fainter in X-rays than active F-stars are. Even if a magnetic dynamo was the source for this faint X-ray flux, differential rotation may be below the detection limit.
6 Conclusions
| Parameter | Value |
|---|---|
| s km-1 | |
| s km-1 | |
| km s-1 | |
| km s | |
| km s | |
We have spectroscopically determined constraints on Altair’s inclination angle and differential rotation from the global rotational broadening profile derived from about 650 spectral absorption lines. The measured observables and our results are summarized in Table 2 where values of equatorial velocity and inclination angle are given with their respective and levels.
No signatures of surface differential rotation were detected, i.e. solar-like differential rotation can be ruled out to be stronger than 10% (Reiners & Schmitt 2002).
From the measured zeros of the Fourier transformed broadening profile we conclude that Altair’s equatorial velocity is not faster than 245 km s-1 (305 km s-1) or 53 % (72 %) of breakup velocity km s-1 (van Belle et al. 2001). Thus its rotation axis is seen under an inclination angle larger than on a -level ( on a -level). These results put additional constraints on the possible rotation rate and inclination angle of Altair as determined from interferometric data (van Belle et al. 2001).
References
- Baranne et al. (1996) Baranne, A., Queloz, D., Mayor, M., Adrianzyk, G., Knispel, G., Kohler, D., Lacroix, D., Meunier, J.-P., Rimbaud, G., & Vin, A. 1996, A&AS, 119, 373
- Buzasi et al. (2004) Buzasi, D. L., Bruntt, H., Bedding, T. R., et al. 2004, ArXiv Astrophysics e-prints
- Claret, (1998) Claret, A., 1998, A&AS, 131, 395
- Dravins et al., (1990) Dravins, D., Lindegren, L., Torkelsson, U., 1990, A&A, 237, 137
- Erspamer & North (2002) Erspamer, D. & North, P. 2002, A&A, 383, 227
- ESA (1997) ESA. 1997, The Hipparcos and Tycho Catalogues, ESA-SP 1200
- Ferrero et al. (1995) Ferrero, R. F., Gouttebroze, P., Catalano, S., Marilli, E., Bruhweiler, F., Kondo, Y., van der Hucht, K., & Talavera, A. 1995, ApJ, 439, 1011
- Gray, (1992) Gray D.F., 1992, The observation and analysis of stellar photospheres, Cambridge Univ. Press, Cambridge
- Gulliver et al., (1994) Gulliver, A. F., Hill, G., & Adelman, S. J., 1994, ApJ, 429, L81
- Kupka et al., (1999) Kupka, F., Piskunov, N.E., Ryabchikova, T.A., Stempels, H.C., & Weiss, W.W., 1999, A&AS, 138, 119
- Reiners, (2003) Reiners, A., 2003, A&A, 408, 707
- Reiners & Schmitt (2002) Reiners, A. & Schmitt, J.H.M.M. 2002, A&A, 384, 155
- Reiners & Schmitt, (2003) Reiners, A., & Schmitt, J.H.M.M., 2003, A&A, 412, 813
- Royer et al. (2002) Royer, F., Grenier, S., Baylac, M.-O., Gómez, A. E., & Zorec, J. 2002, A&A, 393, 897
- van Belle et al. (2001) van Belle, G. T., Ciardi, D. R., Thompson, R. R., Akeson, R. L., & Lada, E. A., 2001, ApJ, 559, 1155
- von Zeipel (1924) von Zeipel, H. 1924, MNRAS, 84, 665