11email: mschrei@astro.u-strasbg.fr, hameury@astro.u-strasbg.fr 22institutetext: Institut d’Astrophysique de Paris, 98bis Boulevard Arago, 75014 Paris, France
22email: lasota@iap.fr
Delays in dwarf novae II: VW Hyi, the tidal instability and enhanced mass transfer models
We discuss the multi–wavelength predictions of the two models proposed for SU UMa stars, i.e the enhanced mass transfer (EMT) and the tidal thermal instability (TTI) models. We focus on the systematic differences of the suggested scenarios before discussing the model predictions together with the observations of the best-studied SU UMa system, VW Hyi. We find that assuming the standard form of the viscosity parameter , both models predict only outbursts being triggered at the inner edge of the accretion disc. In the TTI model the superoutbursts are triggered when the outer radius of the disc reaches a certain value, i.e. the 3:1 resonance radius. In contrast, the EMT scenario predicts superoutbursts when the disc mass exceeds a critical value. This causes the EMT model to be much more sensitive to mass transfer variations than the TTI model. In both models we find the predicted UV and EUV delays in agreement with the observations of VW Hyi for . In addition both models can generate precursor outbursts which are more pronounced at short wavelengths, in agreement with observations. Variations found in the observed light curve of single systems (e.g. VW Hyi) as well as the difference between ordinary SU UMa stars and ER UMa systems are a natural outcome of the EMT model while the TTI model fails to explain them.
Key Words.:
accretion, accretion discs – instabilities – (Stars:) dwarf novae, cataclysmic variables – (stars:) binaries : close1 Introduction
SU UMa stars (e.g. Warner, 1995, for a review) are short-period, i.e. hr111CVcat (Kube et al., 2003) lists five exceptions: MN Dra ( hr), NY Ser ( hr) ,TU Men ( hr), V405 Vul ( hr), and ES Dra ( hr). dwarf novae whose light curve consists of two types of outburst: normal dwarf nova outbursts and 5-10 times longer as well as mag brighter superoutbursts. SU UMa stars can be divided in three subgroups: ordinary SU UMa stars show several normal outbursts between two superoutbursts and the whole supercycle proceeds on a timescale of several d; WZ Sge systems are SU UMa stars with extremely long recurrence times of superoutbursts (several d) and no normal outbursts in between; finally ER UMa stars are defined by their very short supercycles ( d) and frequent normal outbursts. In fact ER UMa systems are hardly ever in a quiescent state.
Superoutbursts differ from the normal ones not only in their length and amplitude but also in pronounced periodic humps found in the orbital light curve. The period of these so–called superhumps is a few percent longer than the orbital one and the phenomenon is generally thought to result from disc deformations when the radius of the disc reaches the 3:1 resonance radius (Whitehurst, 1988; Whitehurst & King, 1991; Hirose & Osaki, 1990; Lubow, 1991). The resonance is possible only if the mass ratio of the components is small, i.e. . Often superhumps are considered as a defining feature of superoutbursts but we advocate caution with this definition because e.g. the dwarf nova U Gem showed (during more than 100 years of observations) a single superoutburst without a superhump (see Lasota, 2001; Smak, 2000, for a detailed discussion).
Normal outbursts of SU UMa stars are thought to be the usual dwarf-nova outbursts described by the disc instability model (DIM) (see Lasota, 2001, for a recent review). This model is based on the existence of a thermal-viscous instability in regions where hydrogen is partially ionized, and the opacities depend strongly on temperature. If one plots the effective disc temperature at a given radius (or equivalently the mass transfer rate ) as a function of the disc surface density , one obtains the well known S-curve, in which the upper and lower branches are stable and the intermediate one is unstable. These branches are delimited by two critical values of , above which no cool solution exists, and below which no hot solution is possible.
Although there is general agreement that the mechanism causing normal outbursts is the thermal-viscous instability and that superhumps are due to the 3:1 resonance, whether superoutbursts are also caused by the 3:1 resonance or if conversely superoutbursts trigger the superhump phenomenon remains an unanswered and intensively discussed question (see e.g. Smak, 1995). In the DIM framework, superoutbursts occur if sufficient mass is accumulated in the supercycle and if during the (super)outburst itself the onset of the cooling front can be sufficiently delayed. Currently two scenarios for SU UMa superoutbursts are debated:
1. Osaki (1989) generalized the DIM by adding a “tidal instability” thereby developing the thermal tidal instability model (TTIM) (see Osaki, 1996, for a review). In this model an enhanced tidal torque is assumed to arise when the outer radius of the disc reaches the 3:1 resonance radius. The additional torque leads to enhanced tidal dissipation which prevents the onset of a cooling front. After superoutbursts, the disc is very small and contains not much mass. Therefore, before the next superoutburst starts, the disc goes through a cycle of several small outbursts during which its outer edge does not reach the 3:1 resonance radius and only a very small fraction of the disc mass is accreted onto the white dwarf. In the TTI scenario, the superoutbursts are caused by the 3:1 resonance.
2. An alternative scenario has been put forward by Vogt (1983), Smak (1984), and Osaki (1985). These authors suggested that superoutbursts are caused by enhanced mass transfer (EMT) from the secondary. Indeed, Hameury et al. (2000) showed that relating the mass transfer rate to the accretion rate, i.e. assuming that irradiation of secondary is somehow increasing the mass transfer rate, allows to reproduce the observed visual light curves. In the EMT model (EMTM) the high accretion rates during superoutburst are expected to force the disc to expand beyond the 3:1 resonance radius thereby accounting for superhumps. In the EMTM superoutbursts are caused by the enhanced mass transfer and only superhumps are related to the 3:1 resonance.
It appears difficult (if not impossible) to decide which model should be preferred based on the analysis of the optical light curves only: both models introduce a new so far rather unconstrained parameter (defining either the strength of the tidal instability or enhanced mass transfer) and both models are more or less successful in reproducing the light curve as well as the superhump phenomenon. In addition, the claimed observational evidence for enhanced mass transfer during outburst (Vogt, 1983; Smak, 1991, 1995; Patterson et al., 2002) has recently been questioned by Osaki & Meyer (2003).
Additional information which may help us to constrain the models comes from simultaneous multi-wavelength observations. In a first paper (Schreiber et al., 2003, hereafter paper I) we analyzed the predictions of the DIM concerning the time lags between the rise to outburst at different wavelength observed in the dwarf nova SS Cyg. In this paper we use the same version of the DIM and approximation of the boundary layer to investigate the multi-wavelength predictions of the two competing SU UMa scenarios by including into the model either EMT or a version of the TTI. Finally we discuss our numerical results in the light of the observationally best studied SU UMa system, i.e. VW Hyi. The structure of the paper is as follows: we start with a careful review of the observational constraints available (Sect. 2) before presenting the predictions of our simulations (Sect. 3). In the last two sections we discuss our results in the context of the observations (Sect. 4) and earlier findings (Sect. 5).
2 Reviewing the observations
The long term light curves of SU UMa dwarf novae show outburst cycles consisting of several short outbursts followed by a long and relatively bright superoutburst. The phenomenology of the three SU UMa subclasses has been outlined in the introduction. In this section we briefly review multi-wavelength observations of SU UMa systems with particular emphasis on VW Hyi.
2.1 Visual long-term light curve
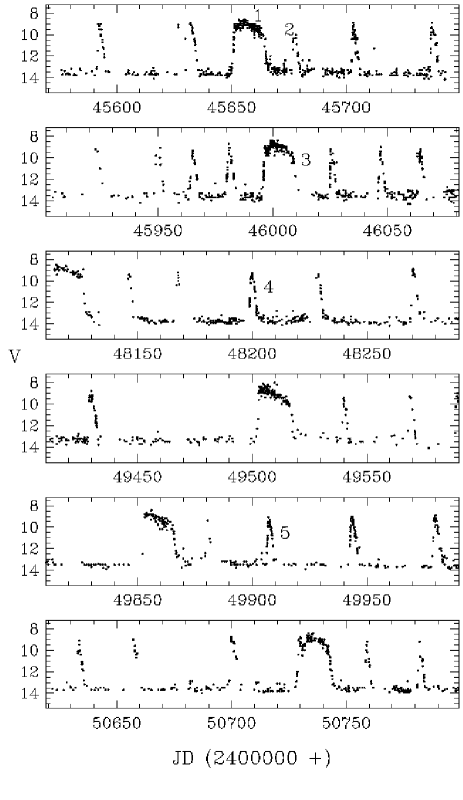
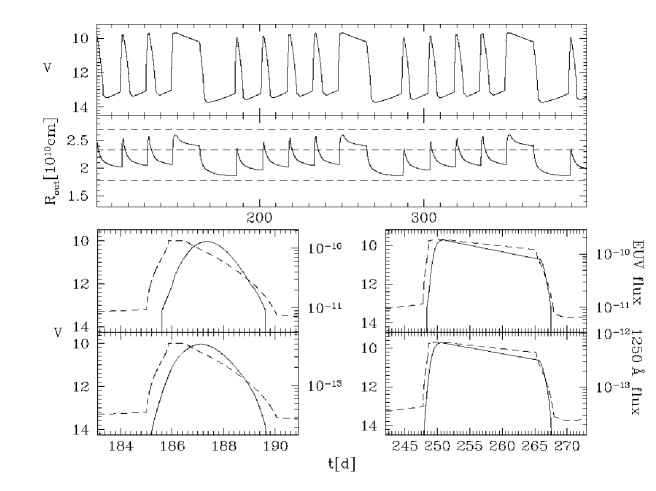
Fig. 1 shows parts of the long term light curve of VW Hyi. While the duration of normal outburst is around days, superoutbursts last essentially longer ( days222As in Mohanty & Schlegel (1995) the length has been measured at ). The single outbursts as well as the outburst cycles are not strictly periodic. Bateson (1977) classified the superoutbursts of VW Hyi into basically two types: S1-S5 with a single superoutburst (hereafter type 1) and S6-S8 where a precursor outburst is separated from the superoutburst (type 2). In addition the number of normal outbursts observed between two superoutbursts varies from three to seven and the supercycle duration is ranging from to days (e.g. Bateson, 1977; Mohanty & Schlegel, 1995). Such variations of the supercycle length and the frequency of normal outbursts can be considered as typical for ordinary SU UMa stars. Similarly, precursor outbursts have been observed not only in VW Hyi but also in other SU UMa stars, e.g. T Leo (Howell et al., 1999).
2.2 The delayed UV and EUV rise
Plotting normalized multi-wavelength light curves of dwarf novae, one finds a delay between the optical rise and the rise at shorter wavelengths. For VW Hyi the delay of the UV and EUV rise has been observed for several outbursts. Table 1 lists the obtained time lags. We use the same notation as in paper I: the index “0.5” denotes the time lags measured at half the maximum optical light whereas quantities with index “0” have been measured at the onset of the outbursts. The snapshots of the light curve we present in Fig. 1 contain the outbursts for which multi-wavelength observations exist. These outbursts are marked with numbers which correspond to those of column 1 in Table 1. The fourth and last panel from the top show the optical superoutburst for which Mauche et al. (2001) detected an EUV precursor and a superoutburst with clear optical precursor.
2.3 UV and EUV precursor
The above described delays are not the only important multi–wavelengths phenomenon of SU UMa stars. One additionally finds precursors at short wavelength which are often correlated with an optical precursor outburst (type 2 superoutburst of VW Hyi). However, the October 1984 superoutburst of VW Hyi shows a UV precursor while the optical emission remains nearly constant. This UV precursor outburst resembles very much a normal outburst until the UV rebrightens (Polidan & Holberg, 1987, their Fig. 3). At EUV wavelength, a similar behavior has been measured: during superoutburst, the EUV count rates of VW Hyi, OY Car and SW UMa are reaching a local minimum d after the optical rise (Mauche et al., 2001; Burleigh et al., 2001).
2.4 X-rays
Although a detailed X-ray light curve as for SS Cyg (Wheatley et al., 2003) is not available for any SU UMa system, the existing X-ray data of VW Hyi contain important information. Recently Pandel et al. (2003) recorded X-ray spectra with XMM during quiescence and estimate a “boundary layer” luminosity of erg s-1 which corresponds to an accretion rate of yrgs-1, in agreement with earlier findings (Belloni et al., 1991). These values have to be considered as lower limits for the real accretion rate as the X-ray luminosity might not represent the total luminosity of the accretion flow onto the white dwarf (see again Pandel et al., 2003).
The evolution of the X-ray emission is given by Hartmann et al. (1999b) who report six BeppoSAX X-ray observations covering an outburst cycle. They find that the X-ray emission significantly decreases during the optical outburst but remains constant during quiescence.
2.5 Delayed superhumps
Since the first detection of superhumps in December 1972 (Vogt, 1974; Warner, 1975) many SU UMa stars have been observed using high-speed photometry and – apart from the U Gem outburst mentioned in the introduction – superhumps appear in coincidence with superoutbursts. Superhumps develop from one night to the other (Semeniuk, 1980) but appear in general 1–2 days after the superoutburst has reached its optical maximum (e.g. Warner, 1995).
3 Simulations
| /hr | 1.75 | ||
|---|---|---|---|
| 20 000 K | |||
| 2750 K | |||
| 0.63 | 0.86∗ | ||
| 0.11 | |||
| / cm | 8.4 | 6.6∗ | |
| i/ | |||
| d/pc | |||
| / cm | 2.36 | 2.70∗ | |
| / cm | 2.14 | 2.33∗ | TTIM |
| / cm | 1.63 | 1.78∗ | TTIM |
| 30 | TTIM | ||
| cm | 2.1 | 2.29∗ | EMTM |
| 0.3 | 0.25∗ | EMTM |
∗ Masses of white dwarfs estimated from observations are notoriously uncertain. For VW Hyi Schoembs & Vogt (1981) estimate but more recent studies indicate a larger value, i.e. (Sion et al., 1997). This leads to uncertainties in other parameters as listed above. For the larger mass we assumed a smaller value of to keep the length of the predicted superoutbursts similar to the observed ones. Fortunately, the conclusions of this paper are not affected by these uncertainties. Except if otherwise stated, we use the parameter according to .
We use the DIM-code described in detail in Hameury et al. (1998) in which tidal dissipation and stream impact heating have been included (Buat-Ménard et al., 2001a).
Recently Smak (2002) analyzed the structure of the outer regions of accretion discs in dwarf novae and arrived at the conclusion that neither tidal dissipation nor the stream impact can play an important role for the disc heating. He argues that (i) most of the impact energy is radiated away by the hot spot so that not much is left for heating the disc and (ii) the tidal dissipation affects only a very narrow region of the outer disc and is (iii) emitted by the edge of the disc. Smak is certainly right in pointing out that the radiation of the disc’s edge should not be neglected. His arguments against the importance of the stream-impact heating result from comparing the system luminosity and the hot spot luminosity of the nova-like system UX UMa. Although in principle correct his study is probably based on a too simple model. In addition, Smak’s conclusion becomes doubtful due to observational uncertainties. As an example we note that even the orbital system parameter for UX UMa derived by Baptista et al. (1995) have recently been questioned by Froning et al. (2003). Throughout this paper, we assume that one half of the stream impact energy is thermalized in the accretion disc. In any case in our code the tidal heating is more important. As far as this effect is concerned Smak’s result is based on the calculations of Ichikawa & Osaki (1994) who considered simple periodic particle orbits in the binary potential. In contrast, 2D-SPH simulations indicate that a large fraction of the outer disc is strongly affected by tidal effects (Truss et al., 2001). One should also note that the additional heating of the outer disc seems to be a crucial ingredient for the DIM to be able to explain dwarf nova light curves (Buat-Ménard et al., 2001a) and in particular the Z Cam phenomenon (Buat-Ménard et al., 2001b). We therefore keep the tidal heating in our calculation, especially as we wish to test the tidal-thermal instability model which, if Smak were right, could not be operating in dwarf novae.
For the emission from the boundary layer we use the simple but reasonable model presented in paper I: the boundary layer is optically thin and emits X-rays for low accretion rates, but becomes optically thick when the accretion rate exceeds the critical value gs-1. The optically thick boundary layer emission is approximated by a black body and assumed to expand with increasing mass accretion rate. It is this optically thick boundary layer which is the main source of EUV emission during outburst. In addition we take into account the contributions of the (irradiated) secondary (using spectra from Kurucz (1993)), the hot spot (assuming a black body of K), and the white dwarf (black body, K).
In quiescence the hot spot emission and the stream-impact heating contribute significantly to the optical emission whereas the UV emission is dominated by radiation from the white dwarf. The effective temperature of the disc is nearly constant around K. The optically thin boundary layer is assumed to be the only source of X-ray emission.
During outburst the effective temperature of the disc is following the classical law ( (see e.g. Lasota, 2001)) with effective temperatures of K. In this high state the disc is the main source of optical (outer parts of the disc) and UV (inner regions) emission. Our approximation of the optically thick boundary layer (see paper I Eqn. (1)-(3)) gives a fractional emitting region of and a temperature of K for an accretion rate of g s-1. This approximation is probably not very good as the observed EUV-spectra indicate lower temperatures and are hardly fitted with a black body (Mauche, 1997). However, as the goal of this paper is to analyze the chronology of SU UMa star outbursts using different theoretical models (and not to fit the observed EUV spectra) our conclusions are not affected by this disagreement. The binary parameter of VW Hyi are given in Table 2 and paper I contains a more detailed description of the modeling.
We present the light curves predicted by the model for four different bands: the optical V band, the 1250 Å flux density representing the UV light curve, the integrated 70–130 Å flux333The EUV flux is calculated by integrating the Å spectrum using the cross-sections as a function of wavelength from Morrison & McCammon (1983). assuming cm-2, and finally the accretion rate below as a measure for the X-ray emission. (Polidan et al., 1990). The parameters required in the context of the TTI and the EMT models are also given in Table 2. The time lags predicted by the models between the rise at different wavelength are compiled in Table 3.
We present the calculations of the TTIM as well as the EMTM and consider the dependence of the predictions on the mass transfer rate and the inner boundary condition.
3.1 The TTI model
Angular momentum conservation in an accretion disc is described by:
| (1) | |||||
where is the surface density, , the mass transfer rate, the radial velocity, and the specific angular momentum of the disc and of the material transferred from the secondary respectively, and the kinematic viscosity coefficient (see also Hameury et al., 1998). The tidal torque () can be approximated by
| (2) |
(Smak, 1984; Papaloizou & Pringle, 1977) where is the angular velocity of the binary orbital motion, the binary separation and a numerical constant taken so as to give an average disc size equal to a chosen value.
As mentioned in the introduction, accretion discs in dwarf novae with small mass ratios () can expand beyond the 3:1 resonance radius and become eccentric. In the framework of the TTIM this is assumed to cause a strongly increased tidal torque which is usually approximated by increasing the “constant” by a factor of 20-50. When the radius of the disc becomes smaller than , the disc returns to a circular shape and decreases to its previous value. As the tidal instability mainly affects the outer parts of the accretion disc, we also include a radial dependence of . When the model predicts the disc to be eccentric, we use for , for , and a linear interpolation in between. The tidal instability will certainly not set in instantly. We therefore assume that varies linearly on short timescales during the development and decay of the tidal instability. It takes the disc at least a dynamical time444Assuming cm the dynamical time is several hundred seconds. to change its shape. We assume for the full development of the tidal instability s. The time scale of the decay of the tidal instability is at least the time it takes the disc to dissipate its excess energy. Buat-Ménard & Hameury (2002) estimated it to be a few percent of the viscous time in the outer parts of the disc, i.e. s which we assume throughout this paper.
3.1.1 The standard TTIM
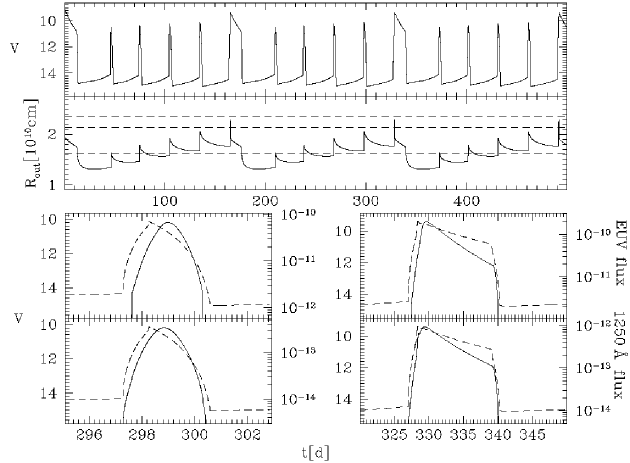
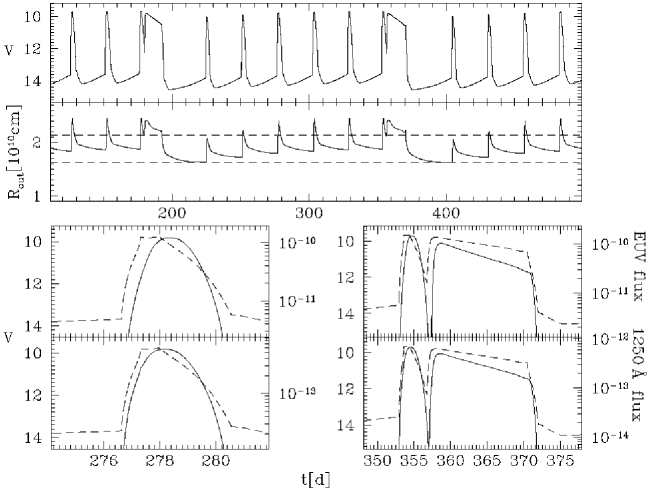
Fig. 2 shows the light curves at different wavelength for the standard TTIM. All outbursts are of the inside–out type i.e. the heating front starts close to the white dwarf. The cooling fronts of the small outbursts start immediately after the heating front has reached the outer disc. Between superoutbursts, the duration and brightness of the small outbursts slightly increases with time. The final expansion of the disc due to the tidal instability is simultaneous with the final optical rise of the superoutbursts.
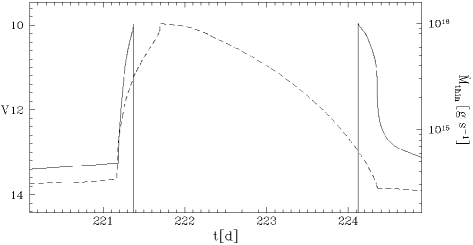
The UV and the EUV rise are delayed with respect to the optical rise by 0.2-0.3 and 0.4-0.5 days respectively. For normal outbursts we find that both the UV and the EUV delay tend to be d longer close to maximum. During superoutbursts, the UV-delay measured at the beginning of the optical rise does not change but becomes shorter close to maximum. This is (1) because the tidal instability is assumed to set in immediately and to develop on a short timescale (s) when the outer radius of the disc is reaching the 3:1 resonance radius and (2) because the enhanced tidal dissipation affects simultaneously large parts of the outer disc (). The almost simultaneous steepening of the final optical and UV rises of the superoutburst significantly reduces the predicted UV-delay close to maximum ().
Another general prediction of the standard TTIM which is worth mentioning is the drastic (i.e. by a factor of ) decrease of the UV and EUV luminosities during superoutbursts. At the same time the optical emission decreases by only magnitudes. As long as the disc is eccentric, the enhanced tidal dissipation keeps the disc in the outburst state although the mass accretion rate decreases significantly. Compared to the high energy radiation, the optical emission decreases only slightly as the outer parts of the disc are kept in the high state. In contrast, the boundary layer and the inner parts of the disc cool down as the mass accretion rate decreases.
3.1.2 The timescale of the tidal instability
In the standard TTIM, the time it takes the disc to become eccentric and the enhanced tidal dissipation to be efficient is very uncertain. So far we assumed the instability to set in immediately and to develop rapidly when . The general coincidence of superoutburst and superhumps has often been claimed as an advantage of the TTI model (e.g. Osaki, 1996). Almost as often, the measured 1–2 day delay between the superhump phenomenon and the superoutburst rise (see Sect. 2.5) has been quoted as the principal weakness of the model (e.g. Smak, 1996, 2000). Indeed, the sequence of events predicted by the standard TTIM does not match the observed one. According to the TTIM, superhumps should appear simultaneously with the enhanced tidal dissipation, i.e. together with the final optical rise, but this is not the case (see Sect. 2.5).
In this section we modify the synchronization of the enhanced tidal dissipation and the observed appearance of superhumps by including a time lag between the moment when the outer radius reaches and the onset of enhanced tidal dissipation due to the instability. Such a revision of the model has been proposed recently by Osaki & Meyer (2003). We use d which accounts for the observed delay between the optical rise and the appearance of Superhumps (see Sect. 2.5) .
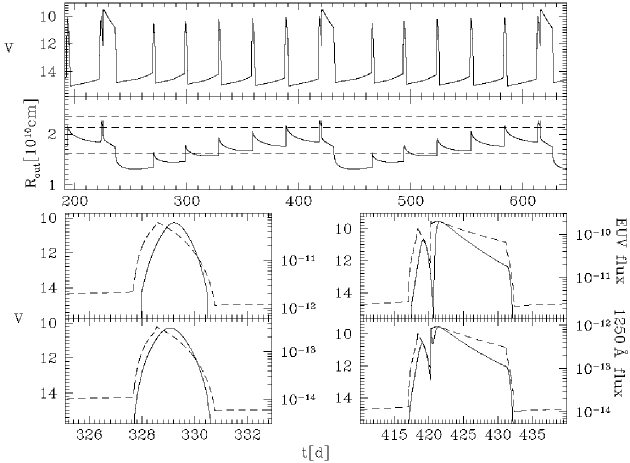
Fig. 3 shows the light curves predicted by this revised TTIM for the relevant wavelengths. Clearly, due to the revision of the timescale of the tidal instability we obtain more small outbursts because the outer radius of the disc needs to be larger than for longer than before the enhanced tidal dissipation sets in. The short time lag introduced between the expansion of the disc beyond and the tidal instability leads also to the formation of a cooling front before the enhanced tidal dissipation can cause an outside–in heating front and trigger a superoutburst 555To avoid confusion concerning our previous statement that all predicted outbursts are of the inside–out type we want to stress that this is only true if one considers the precursors being a part of the superoutbursts – the rebrightening following the precursor is always of the outside–in type. Hence, as predicted by Osaki & Meyer (2003), the introduced time lag forces the model to produce precursor outbursts. However, Osaki & Meyer additionally argue that in the revised scenario the outer radius of the disc may reach the tidal truncation radius. In contrast, our calculations show that the disc remains essentially smaller than even during superoutburst (Fig. 3) unless the mass transfer rate is very close to the value required for stable accretion (see next section). Moreover, if we assume the parameter corresponding to , the difference between and increases significantly (see Table 2) and the scenario put forward by Osaki & Meyer becomes even more implausible.
The predicted delays of the revised TTI scenario are identical to those of the standard TTIM which is not at all surprising as the rise of the normal outbursts and the precursor are not affected by the revision. Concerning the rebrightening following the precursor, the predicted UV delay is very short () while for the EUV delay the value of d still holds. Once the rebrightening is triggered, the rapidly increasing tidal dissipation affects large parts of the outer disc and leads to the formation of a fast heating front which overwhelms the cooling front of the precursor outburst. As this heating front starts in outer disc regions, the outburst is of the outside–in type. As analyzed in detail in paper I, outside–in heating fronts produce shorter delays than inside–out outburst because the delays depend mainly on the time it takes the disc to reach high accretion rates which is – contrary to what one might naively think – not at all identical to the time it takes the heating front to reach the inner edge of the disc. This important result is also true in the case of the rebrightening. Moreover, the situation is even more drastic as the tidal instability is assumed to develop quickly (as superhumps do (Semeniuk, 1980)) and to affect simultaneously large parts of the outer disc. Therefore, the predicted optical and UV emission rise almost together (as in the standard TTIM picture). depends mainly on the viscous time scale and hence remains unchanged.
3.1.3 Dependence on the mass transfer rate
As outlined in the introduction and Sect. 2, SU UMa stars show a large variety of features in their light curves ranging from different supercycle durations to precursor outbursts at optical and short wavelength. In this context VW Hyi is of vital importance as one finds many of the general SU UMa properties in this particular system: the light curve contains superoutbursts with and without optical precursor outburst, EUV and UV precursors have been observed while the optical emission remained almost constant, and finally the number of normal outbursts between superoutbursts varies from three to seven. All these variations should be related to time variations of the mean mass transfer rate.
We present here the predictions of the revised TTIM for different mass transfer rates. Fig. 4 shows the predicted visual light curves assuming d and two values of the mass transfer rate, and gs-1. The latter value is very close to the mass transfer rate above which the disc would be stable. The diffusion time scale is independent of the mass transfer rate (see e.g. Lasota (2001)). The recurrence time for inside-out outbursts should therefore in principle not be affected by changing the mass transfer rate. However, additional effects like stream-impact heating (proportional to ) and tidal dissipation (proportional to ) which are not included in the analytical formula of Lasota (2001) are causing a somewhat reduced recurrence time for significantly increased mass transfer rate (Fig. 4). We also obtain longer superoutbursts and the increased stream-impact heating, tidal dissipation and hot spot brightness lead to a slightly brighter quiescence. The general behavior of several small outbursts followed by a superoutburst, however, does not change even for the drastically increased mass transfer rate. Superoutbursts are still separated by several small eruptions. The precursor outburst becomes less pronounced but always remains visible.
In order to understand the little influence that even very strong variations of the mass transfer rate have on the predicted light curve, we have to throw a glance at the triggering condition for superoutbursts: in the TTIM, a superoutburst starts when . Increasing the mass transfer rate during quiescence leads to a shrinkage of the disc. To reach the disc therefore needs to contain more mass (compare the lower panels of Fig. 4). This cancels out to some extent the effect of the increased mass input, and we find the light curve between superoutburst are rather insensitive to variations of the mean value of the mass transfer rate. The main effect of the increased mass transfer rate is that superoutbursts become brighter and longer due to the increased mass of the disc when such an outburst is finally triggered. Whether a precursor is visible or not is also independent of the mean mass transfer rate. It depends only on the introduced time lag if a cooling front starts before enhanced tidal dissipation sets in.
A final note concerns the evolution of the outer radius of the disc (second panels of Fig. 4). The disc can reach the tidal truncation radius only for mass transfer rates very close to the value required for stable accretion and only if the white dwarf mass is not much larger than .
3.2 Enhanced mass transfer
As outlined in the introduction, competing with the TTIM is the enhanced mass transfer scenario. In this picture it is assumed that the mass transfer rate from the secondary is related to the flux irradiating the secondary. In our model light curves, we have already included the contributions of irradiation of the secondary by the boundary layer and the white dwarf (see paper I). Here we slightly modify this relation by taking into account the fact that the accretion luminosity is not entirely radiated away immediately but that a fraction of it heats the white dwarf and is released when the white dwarf cools. The cooling of the white dwarf in VW Hyi after outburst has been estimated e.g. by using UV–spectra during early decline and quiescence (Gänsicke, 1997). The white dwarf returns to its pre-outburst temperature days after normal and days after superoutbursts. We take these results into account by relating the mass transfer rate to an average (over days) of the accretion rate. The mass transfer rate is then determined by
| (3) |
with
| (4) |
(see also Buat-Ménard & Hameury, 2002). This is an apparently arbitrary prescription but – as we will see – the general conclusions of this paper are independent of the detailed modeling of enhanced mass transfer.
3.2.1 General predictions
| model | n | |||||||||
|---|---|---|---|---|---|---|---|---|---|---|
| [d] | [d] | [d] | [d] | [d] | ||||||
| TTIM | 1 | 0 | 0.04 | 0.2 | 160 | 4 | 0.4 | 0.5 | 0.2 | 0.3 |
| TTIMrev | 1 | 0 | 0.04 | 0.2 | 200 | 5 | 0.4 | 0.5 | 0.2 | 0.3 |
| TTIMrev | 2.5 | 0 | 0.04 | 0.2 | 130 | 4 | 0.4 | 0.5 | 0.2 | 0.3 |
| EMTM | 1.25 | 0 | 0.04 | 0.2 | 180 | 5 | 0.4 | 0.5 | 0.2 | 0.3 |
| EMTM | 1.62 | 0 | 0.04 | 0.2 | 120 | 3 | 0.4 | 0.5 | 0.2 | 0.3 |
| EMTM | 1.5 | 0 | 0.045 | 0.195 | 200 | 7 | 0.6 | 0.5 | 0.4 | 0.3 |
| EMTM∗ | 1.5 | 2 | 0.04 | 0.2 | 160 | 6 | 0.4 | 0.5 | 0.2 | 0.3 |
| EMTM∗ | 1.85 | 2 | 0.05 | 0.185 | 100 | 4 | 0.6 | 0.7 | 0.4 | 0.5 |
| EMTM | 1.25 | 2 | 0.04 | 0.2 | 170 | 4 | 0.3 | 0.5 | 0.2 | 0.3 |
∗ Calculations performed with the parameters according to (see Table 2).
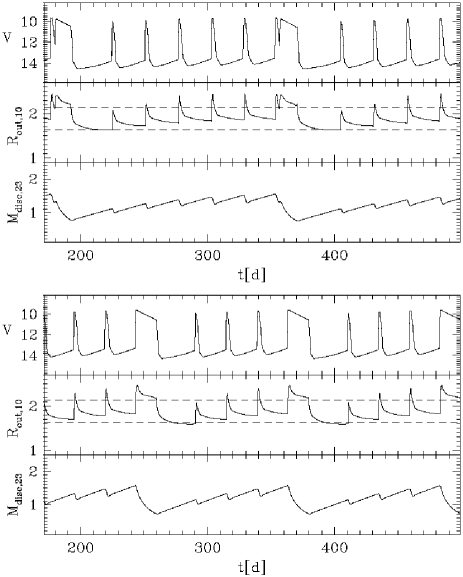
Fig. 5 shows the resulting light curves and the evolution of . The model predicts five small outbursts between the longer ones. As in the case of the revised TTIM all outbursts except the rebrightening following the precursor are of the inside–out type. The brightness difference between superoutbursts and normal outbursts is smaller because the mechanism which is causing the long superoutbursts (enhanced mass transfer) is also present in normal outbursts. The predicted light curve clearly shows a precursor outburst which is much more pronounced in the UV and EUV light curve than in the optical. The optical - UV and optical - EUV time lags (defined by the rise time) are identical to those obtained in the previous sections (see Table 3). On the other hand, the predicted superoutbursts are somewhat different: in the EMTM the decrease of the optical and even more so the UV and EUV flux during superoutburst is less drastic than in the TTIM.
The similarity of the obtained delays is not surprising as they depend on the mass accretion rate after the heating front has reached the inner edge of the disc and on the viscous time scale. Both quantities depend mainly on the values of which we did not change. The predicted precursor is caused by the fact that the maximum accretion rates are delayed with respect to the optical rise. Thus, when the heating front reached the outer edge of the disc, the mass accretion rate (and hence also the mass transfer rate) are still rather low so that a cooling front starts. At this time, the mass accretion rate is still increasing. Once the maximum mass transfer has been reached, an outside–in heating front which overwhelms the precursor cooling front is triggered by an EMT.
3.2.2 Dependence on the mass transfer rate
In Fig. 6 we present light curves predicted by the EMTM for different mass transfer rates. In contrast to Sect. 3.1.3 we use only slightly different mass transfer rates. The EUV and UV delays remained nearly unchanged (see Table 3) and the predicted durations of the superoutbursts do not change with the mass transfer rate. However, increasing the value of the mean mass transfer rate () significantly alters the predicted light curve: short outbursts become less frequent and the duration of the supercycle is significantly reduced. In addition, the precursor vanishes even for slightly increased mean mass transfer rates (Fig.6).
The reason for the completely different responses of the EMTM to mass transfer variations lies in the triggering conditions for superoutbursts. Whether an outbursts becomes a superoutburst or not is independent of the outer radius reached during the expansion. It depends on the maximum accretion rate during outburst which increases with the mass of the disc. Hence, the irradiating flux and the maximum mass transfer rate also depend on how much mass has been stored in the disc. Increasing the mean mass transfer rate therefore shortens the time between superoutbursts. Indeed, as the mass accreted during superoutbursts remains constant666The duration of superoutbursts depends on the strength of enhanced mass transfer, i.e. (see Eq. (3)) we find for the duration of a supercycle
| (5) |
when neglecting the mass accreted during normal outbursts. The variations in the appearance of the precursor outburst are also easy to understand considering the conditions causing a superoutburst. As the mass of the disc remains unchanged, the disc is smaller for higher mass transfer rates. The critical mass accretion rate above which the disc is in the high state depends sensitively on the radius (i.e. (Hameury et al., 1998)). Thus whether the disc stays long enough in the hot state to avoid a precursor cooling front depends sensitively on . In the case of high mass transfer, the hot disc expands slowly while the accretion rate – and hence the irradiating flux as well as the mass transfer rate – increase until the latter keeps the disc in the hot state. For lower mass transfer rates, the disc is larger during quiescence and the cooling front develops shortly after the heating front has reached the outer edge (before the enhanced mass transfer will cause an outside–in heating front and the rebrightening).
3.3 Truncation of the inner disc
So far we concentrated on the predictions of the TTIM and the EMTM in the UV and EUV wavelength range. As mentioned in Sect. 2.4 the observed X-ray emission is also very important when discussing multi-wavelength properties of SU UMa systems. The differences between the EMT and the TTI models concern the outer disc regions during outburst when the accretion rate is high and the boundary layer optically thick. The evolution of the mass transfer rate below (representing the X-ray light curve) is therefore identical for both models. In contrast, as shown in paper I, truncation of the inner disc during quiescence significantly affects the results. In this section we present the evolution of the mass transfer rate when the boundary layer is assumed to be optically thin for the EMT scenario and focus on the role of truncation of the inner disc – an important ingredient of the DIM.
The idea of truncation arose when the significant discrepancy between calculated accretions rates and those derived from X-ray observations became apparent. Indeed, in paper I we showed that the DIM agrees essentially better with the observed optical light curve as well as the X-ray luminosity if the inner disc is truncated. During the last decade various mechanisms that can lead to disc truncation have been proposed to bring into agreement theory and observations (e.g. truncation by a magnetic field (Lasota et al., 1995) and evaporation (Meyer & Meyer-Hofmeister, 1994)). Pandel et al. (2003) detected orbital modulations in the light curve of VW Hyi indicating the presence of a weak magnetic field. However, analyzing in detail which mechanism truncates the inner disc is beyond the scope of this paper. In the framework of the DIM it is sufficient to assume the formation of an inner hole during quiescence (see also Sect. 4.2 of paper I).
In this section we present EMTM calculations including truncation of the inner disc during quiescence by a weak magnetic field:
| (6) |
where is the magnetic moment of the white dwarf in units of G cm3 (see e.g. Hameury & Lasota, 2002).
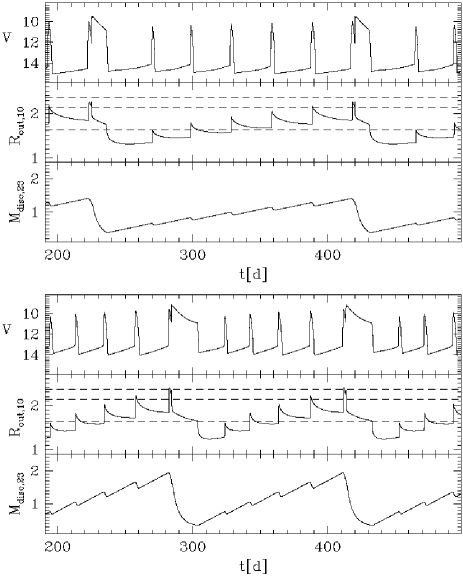
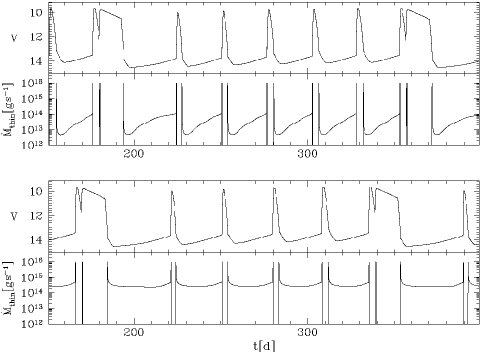
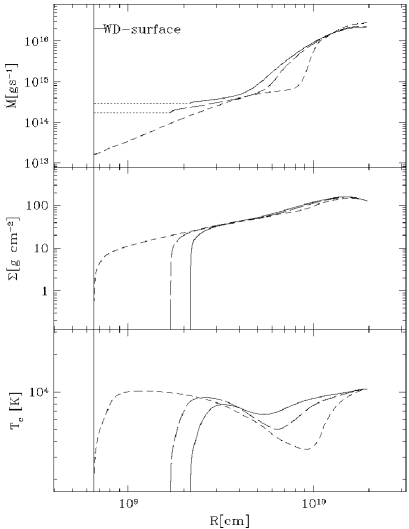
Fig. 7 compares the evolution of the accretion rate when the boundary layer (or the hot inner flow) is assumed to be optically thin. If the inner disc is truncated, the accretion rate in this region is significantly higher and remains nearly constant. This is easy to understand considering the fact that the disc is not in a stationary state during quiescence. Instead matter accumulates and the mass flow rate in the disc increases with radius. In Fig. 8 we present the radial structure of the disc for truncated and non-truncated discs using the higher estimate for the white dwarf mass, i.e. . At first we consider the case without truncation (dashed line in Fig. 8). We find a small accretion rate onto the white dwarf ( gs-1) but a strong dependence of the mass flow through the disc on the radius, i.e. . (top panel of Fig. 8). Concerning truncated discs (long dashed and solid line in Fig. 8) the immediate consequence of this result is: the larger the truncation radius the larger is the mass supplied to the inner (X-ray emitting) flow by the disc. The remaining outer disc is clearly not affected by truncation during quiescence (middle and bottom panels of Fig. 8).
Once enough mass has been accumulated in the disc and the heating front starts, the model predicts a sudden increase of the X-ray emission. The magnetospheric radius decreases until the disc has filled the inner hole and the boundary layer is assumed to become optically thick, i.e. when (see Fig.9). As we obtain only inside–out outbursts for the standard form of the viscosity prescription, we predict that the sudden X-ray flares at the onset of an optical outbursts are not delayed with respect to the optical rise. Because we assumed the inner region to switch instantaneously between the optically thin and the optically thick state when the accretion rate is passing , we obtain also increased X-ray emission at the end of pronounced precursor outbursts (Fig. 7) which is probably not a very realistic prediction.
Concerning the UV and EUV delay we note that truncation slightly shortens the delays at the onset of the outburst, i.e. by d () and d () respectively as the heating front is forced to start at a somewhat larger radius (cm instead of cm, see also paper I).
4 TTIM or EMTM: comparison with observations
It is well known that both models are able to produce a cycle of several small outbursts between superoutbursts which more or less resembles the observed one. In the previous sections of this paper we additionally present multi-wavelength predictions of the TTIM and the EMTM in order analyze the systematic features of the models. Now we want to relate their characteristics to the observed phenomena to see if we can decide which model has to be preferred.
4.1 Delays in normal outbursts
Both models predict at the onset of the outbursts too short delays (, days) when compared with the observed ones (, days). In earlier publications it has been claimed that the outbursts in VW Hyi must be of the outside–in type in order to explain the observed long delays (e.g. Smak, 1998). However, as shown in paper , the delays calculated for outside–in outbursts are even shorter than those of inside–out outbursts. Moreover, using the TTIM or EMTM and the standard form for the viscosity, we did not obtain outside–in normal outbursts even for the highest mass transfer rates.
Nevertheless the discrepancy obtained between the observed and predicted delays does not represent a serious problem for the models. As mentioned in paper (Sect. 4.3), the delays measured during the early rise represent the time it takes the disc to reach high accretion rates. After a heating front has passed, the mass accretion rate of the disc sensitively depends on . In the calculations presented in Sect. 3 we always used . To demonstrate the influence of the viscosity parameter on the predicted delays we additionally performed simulations with reduced values of (see Table 3). In Fig. 10 we show the multi-wavelength predictions of the EMTM for . Both (0.4 days) and (0.6 days) are significantly longer and in better agreement with the observations. Hence a small change of the parameter can bring into agreement model and observations. The change of also leads to shorter quiescence times as the viscous time scale during quiescence decreased.
The calculations presented in Fig. 10 are also calculated with the larger mass of the white dwarf given in Table 2. The increased mean outer radius requires an increased mass transfer rate, the superoutbursts are slightly longer (as a larger disc contains more mass), and the tidal truncation radius as well as the 3:1 resonance radius are larger. Nevertheless, the delays and the general predictions of the model do not depend on the uncertainties related to the mass of the white dwarf which becomes evident when inspecting Table 3.
Concerning the EUV light curve we additionally wish to stress the influence of the critical accretion rate above which the boundary layer is assumed to become optically thick. Throughout this paper we used the same value as in paper , i.e. g s-1. This is justified for SS Cyg by the observed hard X-ray emission. However, we have to be aware of the fact that might be different in VW Hyi as it depends on the mass and rotation of the white dwarf as well as on the value of assumed for the boundary layer (Popham & Narayan, 1995). The assumed value of is essential for the predicted EUV delay at the onset of the outburst: a higher value would increase and steepen the predicted EUV light curve while a value significantly smaller than g s-1 would cause essentially too short delays.
4.2 X-rays and truncation
The X-ray predictions of the TTIM and the EMTM are identical as the differences of the models concern the outburst state and the outer disc whereas X-ray emission is expected only during quiescence, the very early optical rise and the late decline (Figs. 7, 9). Clearly, our approximation of the X-ray emission agrees with the observed suppression of X-rays during outburst.
Concerning the possible truncation of the inner disc during quiescence we come to the same conclusion as in paper I: assuming truncation leads to much more promising results as the predicted accretion rate is equal to the one derived from observations ( gs-1) and remains almost constant during quiescence (Fig. 7) as it is observed (Hartmann et al., 1999a). We want to underline here again that this is because during quiescence the mass flow is increasing with radius in the non-stationary disc. Therefore disc truncation leads to an increased accretion rates in the inner X-ray emitting region (Fig. 8). As a final but important note on this subject we would like to stress that good fits of quiescent dwarf-nova discs with stationary disc models contradict the DIM.
Independent of truncation is the prediction of X-ray flares at the beginning (simultaneously to the optical rise) and end of an outburst. It has not yet been confronted with observations but to fill this gap of observational evidence for the DIM is certainly an interesting topic for future X-ray proposals.
4.3 Superoutbursts
We consider here the general characteristics of the predicted superoutburst light curves. The precursor phenomenon will be discussed in the next section.
Broadly speaking, the superoutbursts predicted by the TTIM and the EMTM are quite similar. The superoutburst brightness relative to the normal outbursts obtained with the EMTM is smaller than that predicted by the TTIM. Both models predict during superoutburst a decreasing flux at all wavelengths but this effect is less drastic in the EMTM than in the TTIM (compare Fig. 3 and Fig. 5). Although the details of the above predictions depend on the arbitrary assumptions related to the modeling of the tidal instability and the enhanced mass transfer, these features are due to the fundamental differences between both types of models:
(1) while the enhanced mass transfer also brightens small outbursts the thermal-tidal instability appears only in superoutbursts;
(2) whereas the TTI superoutburst is mainly fed by the mass accumulated in the disc, the enhanced mass transfer provides additional fuel during EMT superoutbursts.
We list the available observations concerning these differences together with the values derived from our calculations in parentheses:
-
1.
superoutbursts are 0.5–1 mag brighter than normal outbursts (TTIM:; EMTM:) in the optical; at UV wavelengths the maximum of normal and superoutbursts has been measured with a single instrument only for an exceptionally faint normal outburst (Polidan & Holberg, 1987); and finally for the EUV we can just mention the background subtracted deep survey EUVE (DS) count rates given by Mauche et al. (2001) which are somewhat larger (by a factor of ) for superoutbursts (EMTM: ;TTIM:).
-
2.
The measured decline during superoutburst is ranging from to mag (TTIM:mag; EMTM: mag)) in the optical; and by a factor of at DS count rates (EMTM:; TTIM:).
The EMTM seems to match the observations slightly better but, because of the arbitrariness of the detailed modeling and the involved simplifications we cannot exclude the TTIM so far.
4.4 Precursors
The TTIM as well as the EMTM predict precursor outbursts if the enhanced tidal dissipation or respectively the enhanced mass transfer are delayed by 1-2 days with respect to the optical rise of the superoutbursts. At short wavelength, the predicted precursor outbursts are more pronounced but in both models a cooling front is required to cause a significant decrease of the EUV and UV emission. We wish to stress that without the onset of a cooling front, both models predict only a slow decrease at short wavelength and no rebrightening (see Sect. 3.1.1 about the standard TTIM). Reproducing the precursor phenomenon requires a cooling front. This is further confirmed by the observed local minima of precursor outbursts which appear 4-5 days after the initial optical rise in very good agreement with our calculations (see Fig. 3 and 5). In addition, the shape of the observed UV precursor light curve presented by Polidan & Holberg (1987) (see also Sect. 2.3) is identical to the UV light curve of a normal outburst just until the re-brightening.
However, both models predicting a cooling front causes a precursor at all wavelength; it is impossible to get a clear UV or EUV precursor without at least a small decrease of the V–band emission. The calculations we presented always show either pronounced (1.5-2 mag, Fig. 3) or no optical precursors (Fig. 6). Nevertheless, it is certainly possible to construct light curves in which a UV and EUV precursor is clearly visible although the predicted decrease of the optical emission remains quite small. Concerning the EMTM we carried out this fine-tuning by searching a value of close to the value avoiding the precursor’s cooling front. For g s-1 (within of the critical value) we obtain a decrease of mag in the optical light curve while the EUV and UV dips are essentially deeper and comparable to the observed ones. Hence, according to the models every clear precursor at short wavelengths should be accompanied by an optical decrease of mag. So far the observed visual light curve does not clearly constrain this prediction.
Although the predicted precursor outbursts are quite similar to the observed ones, we should be aware that the detailed modeling is rather arbitrary. Enhanced tidal dissipation as well as enhanced mass transfer are based on assumptions which are reasonable but artificially implemented in the standard DIM. In 1-D simulations the tidal instability must be represented by a simple parameterization and the response of a low mass star to irradiation is still uncertain (see Sect.5). In view of this uncertainties it is rather pointless to discuss whether the precursor outbursts predicted by the revised TTIM or the EMTM resembles more the observed precursor outbursts. Nevertheless, our numerical investigation provides a decisive conclusion which is independent of the uncertainties associated with modeling details: while the precursors predicted by the TTIM are insensitive even to very strong mass transfer variations the EMTM predicts that for even small mass-transfer variations precursors might disappear. Considering the variety of superoutbursts found in one single system, i.e. VW Hyi (see Sect. 2 and/or Bateson, 1977), this represents a clear advantage of the EMTM.
4.5 Optical light curves and variations of the mean mass transfer rate
In dwarf novae the accretion disc always acts as a mass buffer and it is difficult to directly derive the strength of mass transfer variations from observed light curves. According to state–of–the–art disc models the mass transfer rate must vary dramatically in particular systems. The observed low states of VY Scl stars (Hameury & Lasota, 2002) clearly indicate a considerable decrease of the mass transfer rate, and in RX And additional fluctuations are expected (Schreiber et al., 2002). If, as in most dwarf novae rather regular outbursts are observed, only small mass transfer variations are required. Indeed, assuming variations of the mean mass transfer rate of
(i) allows to reproduce the change from normal to anomalous as well as long to short outbursts in SS Cyg (paper I);
(ii) is sufficient to explain Z Cam standstills (Buat-Ménard et al., 2001b);
(iii) can within the EMTM account for the different supercycle durations in single SU UMa systems e.g. VW Hyi;
(iv) and finally – according again to the EMTM – can explain why precursors appear and vanish in the light curve of VW Hyi.
Another argument for the EMTM concerns the SU UMa subclasses: within the EMTM a dispersion of the mean mass transfer rates can account for the different supercycle timescales in ER UMa and ordinary SU UMa stars but one has to change the condition for the tidal instability for different subclasses in the framework of the TTIM (Buat-Ménard & Hameury, 2002; Osaki, 1995a, b).
5 Notes on earlier calculations
5.1 Delays
Smak (1998) analyzed the UV delay in dwarf novae and concluded that the alleged problem of the UV delay is not a problem if one uses the correct outer boundary condition and the correct disc’s size. For VW Hyi, Smak proposed outside–in outbursts in order to bring into agreement the predictions of his calculations and the observed delays. Cannizzo (2001) comes to the same conclusion when analyzing the EUV delay. We note the following:
1. Neither the UV nor the EUV delay are good indicators for the ignition radius of the heating front (see also paper I);
2. Both the TTI and EMT models predict outbursts of the inside-out type except if a special form of viscosity and an explicit radial dependence of is assumed (Ichikawa & Osaki, 1992).
3. The UV delay depends on the ratio of while for the EUV delay the absolute value of (the viscous timescale in the hot state) is also important.
Thus, in contradiction to earlier publications we stress that outside–in outburst are not required to reproduce the delays observed for VW Hyi.
5.2 Irradiation of the secondary
Finally we have to relate our results to the recent works of Osaki & Meyer (2003) and Smak (2004) discussing the possible role of enhanced mass transfer during outbursts of SU UMa systems.
In their Sect. 3 Osaki & Meyer theoretically analyze the effects of irradiation on the secondary and come to the conclusion that the EMT scenario has to be abandoned because the point lies deep in the shadow of the accretion disc and heat transport from irradiated parts cannot be fast enough. First Osaki & Meyer claim that Coriolis forces prevent hot matter to flow towards . In contrast they allege the formation of a so-called “geostrophic” flow, i.e. a flow at right angle to the driving pressure gradient. Finally Osaki & Meyer argue that diffusion as the remaining mechanism transporting heat towards is much too slow. Both results are incorrect because only the vicinity of the point has been considered, where the normal component of the rotation frequency is indeed not small. We note, however, that even at small distance from , this is no longer true and the same holds for the arguments of Osaki & Meyer.
Indeed Smak (2004) presented a much more reliable approach of calculating the effects of irradiation of the secondary. He simplifies the problem by making the reasonable assumption of isothermal layers inside and outside the shadow zone and solves the equation of motion. He finds that the enhanced mass transfer due to irradiation of the secondary appears efficient in systems with short orbital periods, i.e. hr. Interestingly, the amount of mass transfer enhancement derived by Smak for typical SU UMa parameter (/) is very similar to the one assumed in our calculations. During outburst we obtain accretion rates of gs-1. With an efficiency of (Eq. (4)) and gs-1 this leads to a mass transfer enhancement of /. In addition, the values derived from observations are also similar, e.g. Vogt (1983) derived / for VW Hyi.
To summarize the above, we conclude that irradiation induced enhanced mass transfer is most likely present in SU UMa systems.
6 Conclusion
Using the disc instability model (DIM) and simple approximations for the emission from the boundary layer we investigated the systematics of the two scenarios proposed for SU UMa stars, i.e. the tidal thermal instability (TTI) and the enhanced mass transfer (EMT) models. We related the predictions of the model to multi-wavelength observations of VW Hyi and SU UMa stars in general. The results from this study are:
-
1.
As shown previously, both models predict light curves consisting of several small outbursts between longer and brighter ones. Within the TTIM, long outbursts are triggered when the disc reaches a critical outer radius () and the mass of the disc at this time depends on the assumed mean mass transfer rate. The EMTM predicts long outbursts when the disc mass reaches a critical value. The outer radius of the disc at this very moment depends on the assumed mass transfer rate during quiescence.
-
2.
Using the standard prescription for the viscosity, both models predict only inside–out outburst. The predicted UV and EUV delays sensitively depend on and agree with the observed ones for .
-
3.
The calculated accretion rates during quiescence agree with those derived from X-ray observations only if the inner disc is truncated. The model also predicts X-ray flares at the beginning and at the end of the outbursts similar to those observed for SS Cyg. As we obtain for the EMTM as well as for the TTIM only inside–out outbursts, both models predict no delay of the X-ray flare with respect to the optical rise.
-
4.
Both models predict precursor outbursts if the mechanism which triggers the long outbursts, i.e. the tidal instability or the enhanced mass transfer, is delayed with respect to the optical rise. The predicted precursor outbursts are more pronounced at shorter wavelength as observed. At all wavelength a precursor outburst is obtained only if a cooling front has started and every clear UV or EUV precursor should be accompanied by a small ( mag) decrease of visual emission.
-
5.
The light curves predicted by the TTIM are rather insensitive to even strong mass transfer variations. In contrast, within the EMT scenario, the number of small outbursts, the recurrence time of superoutbursts, and the appearance of precursor outbursts sensitively depend on the mean mass transfer rate.
Clearly, because of the approximative description of enhanced mass transfer and the tidal instability we have not proven the EMTM to be correct or the TTIM not to work. However, especially because of point 5. the EMTM is currently the most promising scenario: the observed variations in the optical light curve of VW Hyi are naturally explained by mass transfer variations similar to those predicted for Z Cam systems. In addition, within the EMTM the different supercycle timescale of ordinary SU UMa stars and ER UMa systems also has a simple explanation which we already know from long orbital period dwarf novae: a dispersion of the mean mass transfer rate at similar orbital periods.
Acknowledgements.
MRS acknowledges funding by an individual Marie–Curie fellowship; JMH and JPL were supported in part by the GDR PCHE. We thank Joe Smak for sending us his article prior to publication and we are gratefult to F. Bateson (VSS RASNZ) and J. Mattei (AAVOS) for providing the long-term optical monitoring data of VW Hyi. We acknowledge helpful comments and advice from Chris Mauche.?refname?
- Baptista et al. (1995) Baptista, R., Horne, K., Hilditch, R. W., Mason, K. O., & Drew, J. E. 1995, ApJ, 448, 395
- Bateson (1977) Bateson, F. M. 1977, New Zealand Journal of Science, 20, 73
- Belloni et al. (1991) Belloni, T., Verbunt, F., Beuermann, K., Bunk, W., Izzo, C., Kley, W., Pietsch, W., Ritter, H., Thomas, H. C., & Voges, W. 1991, A&A, 246, L44
- Buat-Ménard & Hameury (2002) Buat-Ménard, V. & Hameury, J.-M. 2002, 386, 891
- Buat-Ménard et al. (2001a) Buat-Ménard, V., Hameury, J.-M., & Lasota, J.-P. 2001a, A&A, 366, 612
- Buat-Ménard et al. (2001b) —. 2001b, A&A, 369, 925
- Burleigh et al. (2001) Burleigh, M. R., Pye, J. P., Poulton, S. W., Sohl, K. B., Wheatley, P. J., & Wynn, G. A. 2001, MNRAS, 325, 1458
- Cannizzo (2001) Cannizzo, J. K. 2001, ApJ, 556, 847
- Froning et al. (2003) Froning, C. S., Long, K. S., & Knigge, C. 2003, ApJ, 584, 433
- Gänsicke (1997) Gänsicke, B. T. 1997, PhD thesis, Universität Göttingen
- Hameury et al. (1998) Hameury, J., Menou, K., Dubus, G., Lasota, J., & Hure, J. 1998, MNRAS, 298, 1048
- Hameury & Lasota (2002) Hameury, J.-M. & Lasota, J.-P. 2002, A&A, 394, 231
- Hameury et al. (2000) Hameury, J. M., Lasota, J. P., & Warner, B. 2000, A&A, 353, 244
- Hartmann et al. (1999a) Hartmann, H. W., Heise, J., Kahabka, P., Motch, C., & Parmar, A. N. 1999a, A&A, 346, 125
- Hartmann et al. (1999b) Hartmann, H. W., Wheatley, P. J., Heise, J., Mattei, J. A., & Verbunt, F. 1999b, A&A, 349, 588
- Hirose & Osaki (1990) Hirose, M. & Osaki, Y. 1990, PASJ, 42, 135
- Howell et al. (1999) Howell, S. B., Ciardi, D. R., Szkody, P., van Paradijs, J., Kuulkers, E., Cash, J., Sirk, M., & Long, K. S. 1999, PASP, 111, 342
- Ichikawa & Osaki (1992) Ichikawa, S. & Osaki, Y. 1992, PASJ, 44, 15
- Ichikawa & Osaki (1994) —. 1994, PASJ, 46, 621
- Kube et al. (2003) Kube, J., Gänsicke, B. T., Euchner, F., & Hoffmann, B. 2003, A&A, 404, 1159
- Kurucz (1993) Kurucz, R. L. 1993, VizieR Online Data Catalog, 6039
- Lasota (2001) Lasota, J.-P. 2001, New Astronomy Review, 45, 449
- Lasota et al. (1995) Lasota, J. P., Hameury, J. M., & Hure, J. M. 1995, A&A, 302, L29
- Lubow (1991) Lubow, S. H. 1991, ApJ, 381, 268
- Mauche (1997) Mauche, C. W. 1997, in X-Ray Imaging and Spectroscopy of Cosmic Hot Plasmas, 529
- Mauche (2002) Mauche, C. W. 2002, in ASP Conf. Ser. 264: Continuing the Challenge of EUV Astronomy: Current Analysis and Prospects for the Future, 75
- Mauche et al. (2001) Mauche, C. W., Mattei, J. A., & Bateson, F. M. 2001, in ASP Conf. Ser. 229: Evolution of Binary and Multiple Star Systems, 367
- Meyer & Meyer-Hofmeister (1994) Meyer, F. & Meyer-Hofmeister, E. 1994, A&A, 288, 175
- Mohanty & Schlegel (1995) Mohanty, P. & Schlegel, E. M. 1995, ApJ, 449, 330
- Morrison & McCammon (1983) Morrison, R. & McCammon, D. 1983, ApJ, 270, 119
- Osaki (1985) Osaki, Y. 1985, A&A, 144, 369
- Osaki (1989) Osaki, Y. 1989, in Theory of Accretion Disks, 183
- Osaki (1995a) —. 1995a, PASJ, 47, L11
- Osaki (1995b) —. 1995b, PASJ, 47, L25
- Osaki (1996) —. 1996, PASP, 108, 39
- Osaki & Meyer (2003) Osaki, Y. & Meyer, F. 2003, A&A, 401, 325
- Paczynski (1977) Paczynski, B. 1977, ApJ, 216, 822
- Pandel et al. (2003) Pandel, D., Córdova, F. A., & Howell, S. B. 2003, MNRAS, 346, 1231
- Papaloizou & Pringle (1977) Papaloizou, J. & Pringle, J. E. 1977, MNRAS, 181, 441
- Patterson et al. (2002) Patterson, J., Masi, G., Richmond, M. W., Martin, B., Beshore, E., Skillman, D. R., Kemp, J., Vanmunster, T., Rea, R., Allen, W., Davis, S., Davis, T., Henden, A. A., Starkey, D., Foote, J., Oksanen, A., Cook, L. M., Fried, R. E., Husar, D., Novák, R., Campbell, T., Robertson, J., Krajci, T., Pavlenko, E., Mirabal, N., Niarchos, P. G., Brettman, O., & Walker, S. 2002, PASP, 114, 721
- Polidan & Holberg (1987) Polidan, R. S. & Holberg, J. B. 1987, MNRAS, 225, 131
- Polidan et al. (1990) Polidan, R. S., Mauche, C. W., & Wade, R. A. 1990, ApJ, 356, 211
- Popham & Narayan (1995) Popham, R. & Narayan, R. 1995, ApJ, 442, 337
- Schoembs & Vogt (1981) Schoembs, R. & Vogt, N. 1981, A&A, 97, 185
- Schreiber et al. (2002) Schreiber, M. R., Gänsicke, B. T., & Mattei, J. A. 2002, A&A, 384, L6
- Schreiber et al. (2003) Schreiber, M. R., Hameury, J.-M., & Lasota, J.-P. 2003, A&A, 410, 239 (paper I)
- Semeniuk (1980) Semeniuk, I. 1980, A&AS, 39, 29
- Sion et al. (1997) Sion, E. M., Cheng, F. H., Sparks, W. M., Szkody, P., Huang, M., & Hubeny, I. 1997, ApJ Lett., 480, L17
- Smak (1984) Smak, J. 1984, Acta Astron., 34, 317
- Smak (1991) —. 1991, Acta Astron., 41, 269
- Smak (1995) —. 1995, Acta Astron., 45, 259
- Smak (1996) Smak, J. 1996, in IAU Colloq. 158: Cataclysmic Variables and Related Objects, 45
- Smak (1998) —. 1998, Acta Astron., 48, 677
- Smak (2000) —. 2000, New Astronomy Review, 44, 171
- Smak (2002) —. 2002, Acta Astron., 52, 263
- Smak (2004) —. 2004, Acta Astron., submitted
- Truss et al. (2001) Truss, M. R., Murray, J. R., & Wynn, G. A. 2001, MNRAS, 324, L1
- van der Woerd & Heise (1987) van der Woerd, H. & Heise, J. 1987, MNRAS, 225, 141
- Vogt (1974) Vogt, N. 1974, A&A, 36, 369
- Vogt (1983) —. 1983, A&A, 118, 95
- Warner (1975) Warner, B. 1975, MNRAS, 170, 219
- Warner (1995) —. 1995, Cataclysmic Variable Stars (Cambridge: Cambridge University Press)
- Wheatley et al. (2003) Wheatley, P. J., Mauche, C. W., & Mattei, J. A. 2003, MNRAS, 345, 49
- Wheatley et al. (1996) Wheatley, P. J., Verbunt, F., Belloni, T., Watson, M. G., Naylor, T., Ishida, M., Duck, S. R., & Pfeffermann, E. 1996, A&A, 307, 137
- Whitehurst (1988) Whitehurst, R. 1988, MNRAS, 232, 35
- Whitehurst & King (1991) Whitehurst, R. & King, A. 1991, MNRAS, 249, 25