11email: mutschke@astro.uni-jena.de, conny@astro.uni-jena.de 22institutetext: NORDITA, Blegdamsvej 17, DK-2100 Copenhagen, Denmark
22email: anja@nordita.dk 33institutetext: Max-Planck-Institut für Astronomie, Königstuhl 17, D-69117 Heidelberg, Germany
33email: henning@mpia.de
Optical data of meteoritic nano-diamonds from far-ultraviolet to far-infrared wavelengths111The n and k data in Table 3 are also available in electronic form at the CDS via anonymous ftp to cdsarc.u-strasbg.fr (130.79.128.5) or via http://cdsweb.u-strasbg.fr/cgi-bin/qcat?J/A+A/ as well as from http://www.astro.uni-jena.de//Laboratory/Database/carbon.html
We have used different spectroscopic techniques to obtain a consistent quantitative absorption spectrum of a sample of meteoritic nano-diamonds in the wavelength range from the vacuum ultraviolet (0.12 m) to the far infrared (100 m). The nano-diamonds have been isolated by a chemical treatment from the Allende meteorite (Braatz et al. 2000). Electron energy loss spectroscopy (EELS) extends the optical measurements to higher energies and allows the derivation of the optical constants (n&k) by Kramers-Kronig analysis. The results can be used to restrain observations and to improve current models of the environment where the nano-diamonds are expected to have formed. We also show that the amount of nano-diamond which can be present in space is higher than previously estimated by Lewis et al. (1989).
Key Words.:
Methods: laboratory - Stars: abundances - Stars: atmospheres - Stars: carbon - dust, extinction - ISM: lines and bands1 Introduction
Presolar meteoritic grains have opened the possibility of studying circumstellar dust grains directly in the laboratory, providing an important complement to astronomical observations. The identification of the presolar origin of the grains is based on their highly anomalous isotopic composition which in general agrees with those expected for stellar condensates (Zinner zinner98 (1998); Ott ott03 (2003)). Diamonds were the first presolar grains to be isolated from meteorites (Lewis et al. lewis+etal87 (1987)) and they account for more than 99% of the identified presolar meteoritic material. Their abundance normalized to the meteorite’s matrix is around 5001000 ppm, depending on the metamorphic grade of the meteorite (Alexander et al. alexander+etal90 (1990); Huss huss90 (1990); Huss & Lewis huss+lewis95 (1995)). They are identified as presolar grains due to a significant overabundance (compared to the Solar isotopic ratios) of the very heavy (Xe-H) 134Xe and 136Xe as well as the very light (Xe-L) 124Xe, 126Xe isotopes (together called Xe-HL composition).
The origin of the meteoritic nano-diamonds is still a matter of debate. The Xe-HL anomaly is expected to be produced by - and -process nucleosynthesis in supernovae (SN). Therefore, it has been suggested that the diamonds condense either directly in SN outflows (Clayton clayton89 (1989)) or that they originate from cool red giants and are later implanted with Xe (Jørgensen jorgensen88 (1988)). As proposed by Jørgensen & Andersen (jorgensen+andersen99 (1999)) it is also possible that the Xe-H anomaly can be explained as a small fraction of pure 12C diamonds which originated in SN II. The bulk of the presolar meteoritic diamonds could then have condensed in evolved carbon stars which would account for the bulk 12C/13C ratio. The content of light isotopes of Xe-L is very small (less than 1 atom per 109 diamonds), and can be explained as coming from SN I (Lambert lambert92 (1992)) in binary systems where the low mass component is an evolved carbon star (Jørgensen jorgensen88 (1988)), or as a by-process of the Xe production in SN II (Ott ott96 (1996)). However, recently Dai et al. (dai+etal02 (2002)) have, based on investigations of interstellar dust particles, suggested that at least some of the meteoritic nano-diamonds were formed in the inner solar nebula and not in a presolar environment. Whether this would be consistent with the oxidizing conditions expected for the solar nebula is an open question.
So far, the only strong observational evidence for the presence of diamonds in other astrophysical environments comes from the identification of the infrared emission bands of hydrogen-saturated diamond surfaces at 3.43 and 3.53 m in certain Herbig-AeBe objects as well as in the post-AGB star HR 4049 (Guillois et al. guillois+etal99 (1999); van Kerckhoven et al. vankerckhoven+etal02 (2002)). The earlier identification by Allamandola et al. (allamandola+etal92 (1992)), who suggested nano-diamonds as the source of a 3.47 m absorption feature seen in dense molecular clouds (protostars), now seems untenable (Brooke et al. brooke+etal96 (1996); brooke+etal99 (1999)). The m feature seen in some post-AGB stars (Kwok et al. kwok+etal89 (1989)) is attributed by Hill et al. (hill+etal98 (1998)) to the presence of nano-diamonds, however this feature has also been attributed to several other molecules and solids (for recent assignments see Kwok et al. kwok+etal99 (1989); Volk et al. volk+etal99 (1989); Papoular papoular00 (2000); von Helden et al. vonhelden+etal00 (2000); Speck & Hofmeister speck+hofm03 (2003), Posch et al. posch+etal04 (2004)).
The diamond grains seen in the Herbig-AeBe objects are different from meteoritic ones. The observed emission bands require that the diamonds must be at least one order of magnitude larger than the average size of the meteoritic grains. Nano-diamonds of the size of the meteoritic ones would emit broader bands at about 3.41 and 3.50 m (Sheu et al. sheu+etal02 (2002); Jones et al. jones+etal04 (2004)), provided that their surfaces are hydrogenated. Jones et al. jones+etal04 (2004) have recently published a new study on the C-H stretching IR bands of surface-processed meteoritic nano-diamonds. They find that the spectra of nano-diamonds of a certain surface structure show similarities with class B emission band sources. They also emphasize that this would strengthen the case for a nano-diamond carrier of the m emission feature observed in most of the class B objects. Altogether, the current observational and experimental findings, including the presence of the meteoritic nano-diamonds indicate, that diamonds are a constituent at least of certain astrophysical environments. Nano-diamonds with sizes like the meteoritic diamonds could very well be more common than the larger diamonds, due to their detection limitations.
If nano-diamonds are present, they need to be taken into account in models of these environments. Especially, the optical properties (absorption and scattering cross sections) will have to be included in modelling of synthetic spectra. This requires knowledge of the optical constants of the material within a broad wavelength range, i.e. the complex refractive index () or the dielectric function (). These data have so far been available only in limited spectral ranges. Lewis et al. (lewis+etal89 (1989)) made the attempt to combine measured infrared data with modified literature data of bulk diamonds in the ultraviolet. Part of the UV/Vis and IR spectrum of meteoritic nano-diamonds was measured by Mutschke et al. (mutschke+etal95 (1995)), Andersen et al. (andersen+etal98 (1998)), and Braatz et al. (braatz+etal00 (2000)).
With this paper we intend to provide the needed optical data by combining information from optical and EELS measurements on a sample of highly purified meteoritic nano-diamonds extracted from the Allende meteorite (Braatz et al. braatz+etal00 (2000)). After a short summary of the physical and chemical characteristics of the meteoritic nano-diamonds, which are essential to understand their spectroscopic properties, the optical measurements are described in Sect. 3, followed by the EELS measurements and the derivation of the complex refractive index (Sect. 4). In Sect. 5 we discuss the consequences of our new results for the observability of nano-diamonds in astrophysical environments.
2 Properties of the meteoritic nano-diamonds
Presolar diamonds are found in relatively unprocessed meteorites, the so-called carbonaceous chondrites, and they account for about 3% of the total amount of carbon in the meteorite. An in-situ search for diamonds in the Allende meteorite (Banhart et al. banhart+etal98 (1998)) showed that they are situated in the matrix of the meteorite, i.e. not related to other inclusions such as the chondrules. A number of impurities have been identified in the meteoritic diamonds, including noble gases (He, Ne, Ar, Kr, and Xe), Ba and Sr (which are slightly enriched in -process isotopes; Lewis et al. lewis+etal91 (1991)), H with 1H/2D = 5193 (Virag et al. virag+etal89 (1989); (1H/2D)terrestrial = 6667), N with 14N/15N = 406 (Russell et al. russell+etal91 (1991); (14N/15N)terrestrial = 272). The 12C/13C ratio is only slightly higher than the terrestrial one (92 compared to 89; Lewis et al. lewis+etal87 (1987)).
The most intriguing property of the nano-diamonds is their very small size, with a median diameter of less than 20 Å (Fraundorf et al. fraundorf+etal89 (1989)) and, consequently, the dominance of the grain surface structure in their physical and chemical properties. A typical meteoritic diamond contains on the order of 1000 - 2000 carbon atoms, with 25% of these belonging to the surface (Jones & d’Hendecourt jones+dhendecourt00 (2000)). Since the surface atoms have free valences, they can either bind chemical groups or, in the case of carbon atoms, change their hybridization state and restructure the C-C bonds, i.e., form unsaturated bonds (for detailed discussions on nano-diamond surface structure see Evans evans92 (1992); Jones & d’Hendecourt jones+dhendecourt00 (2000) and references therein).
Indications for this restructuring of the surface come from electron energy loss spectroscopy (EELS) as well as from density measurements. Bernatowicz et al. (bernatowicz+etal90 (1990)) found that in EELS spectra of nano-diamonds extracted from the Allende and Murray CE meteorites the diamond (-electron) plasmon was shifted to smaller energies by about 5 eV (see also Sect. 4.1). They explained this behaviour by assuming a grain mantle consisting of hydrogenated amorphous carbon and estimated the volume fraction of this mantle to be 0.46 of the grain volume. Lewis et al. (lewis+etal87 (1987)) have measured an effective bulk density of meteoritic nano-diamonds from the Murchison meteorite of 2.22-2.33 g cm-3, well below the density of pure diamond (3.51 g cm-3). Lewis et al. (lewis+etal89 (1989)) interpret this as an implication for the presence of residual water and amorphous carbonaceous phases (a-C and a-C:H), which was taken by Bernatowicz et al. (bernatowicz+etal90 (1990)) as support for the core-mantle model, which would give a density of 2.4-2.5 g cm-3.
Another clear indication for sp2 carbon is the presence of a 1s- feature in the carbon core-electron transitions in EELS spectra measured by several authors (Bernatowicz et al. bernatowicz+etal90 (1990); Blake et al. blake+etal88 (1988); Dorschner et al. dorschner+etal96 (1996), see also Fig. 1). The analysis of the strength of the feature in the present sample gives a typical fraction of sp2/sp3 carbon atoms of 0.11, i.e. about half of the surface atoms are sp2. This would be consistent with the presence of C=C chains at the restructured surface, which has been described by Evans (evans94 (1994)), and with a contribution from C=O groups. The abundance of C=O groups can be estimated from the IR spectrum (5.7 m band) to be about 1/4 of the sp2 atoms. The sp3 surface atoms probably largely form C-O-C and C-OH groups.
The importance of the surface properties is underlined by infrared spectroscopy results, which reveal a number of bands due to functional groups bound to the nano-diamond surface. These bands have been measured before by several groups on nano-diamonds from different meteorites such as Allende (Lewis et al. lewis+etal89 (1989); Koike et al. koike+etal95 (1995); Andersen et al. andersen+etal98 (1998); Braatz et al. braatz+etal00 (2000)), Murchison (Colangeli et al. colangeli+etal94 (1994); Mutschke et al. mutschke+etal95 (1995); Braatz et al. braatz+etal00 (2000)) and Orgueil (Hill et al. hill+etal97 (1997)). Comparisons of the measurements can be found in Andersen et al. (andersen+etal98 (1998)) and Braatz et al. (braatz+etal00 (2000)). The assigned bands indicate the presence of oxygen, hydrogen, and nitrogen in different configurations at the diamond surface.
As mentioned before, the results of the isotopic analysis (Russell et al. russell+etal91 (1991); Virag et al. virag+etal89 (1989)) imply that at least some of the H and N must be presolar. However, by IR spectroscopy it has not yet been possible to identify surface groups which originate from the astrophysical environment in which the grains have either been formed or processed. Before it is possible to measure the spectral properties of meteoritic diamonds, it is necessary to extract them from the rest of the meteoritic material. This means that 99.9% of the meteorite has to be removed in a destructive chemical separation, in which undesirable minerals are dissolved by appropriate reagents. Hill et al. (hill+etal97 (1997)) and Braatz et al. (braatz+etal00 (2000)) showed that e.g. the oxidizing steps of the extraction procedure should be able to modify the surface structure.
The chemical separation procedure we have used, is a variant of those developed by Tang & Anders (tang+anders88 (1988)) and Amari et al. (amari+etal94 (1994)) and is described in Braatz et al. (braatz+etal00 (2000)) together with infrared spectra taken after each step for a sample of Murchison diamonds. The nano-diamond sample used for the measurements presented here is identical to the Allende sample of Braatz et al. (braatz+etal00 (2000)). The diamonds were extracted from 114 g of the Allende meteorite. The extraction procedure is the same for these. The IR spectra are reported in Braatz (braatzthesis (2000)). The yield of the final diamond sample was 16 mg.
3 Optical spectroscopy
We have performed optical transmission measurements of meteoritic nano-diamonds in the wavelength range m, which required the use of different spectrometers and preparation methods. To prepare suitable samples, the diamonds had to be either dispersed in or deposited on media which are transparent in the corresponding part of the spectral range. Because of the strong variation in the mass absorption coefficient from the vacuum-ultraviolet to the far-infrared wavelengths, samples with different column densities of nano-diamonds had to be prepared. The intended quantitative absorption measurements require as exact a knowledge of the column densities as possible.
Dispersion in liquids failed, because the diamonds exhibited a strong tendency to aggregate and to sediment, regardless of the pH-value or kind of liquid. We therefore used the following methods: (1) the sample was dispersed in KBr and polyethylene pellets for measurements in the visible and the infrared spectral ranges and (2) the sample was deposited onto CaF2 windows from a suspension for measurements in the UV. Table 1 summarizes the methods and instruments applied for each of the different spectral regions.
| Wavelength | Preparation | Column density | Instrument | Resolution | Remarks |
| (m) | [mg/cm2] | / | |||
| 0.01 - 0.2 | on TEM grid | - | EELS (GIF 100) | 200 - 10 | - |
| 0.12 - 0.23 | on CaF2 substrate | 0.0169 | VUV (LZ Hannover) | 500 | closed film |
| 0.19 - 0.5 | on CaF2 substrate | 0.069 | Lambda 19 (Perkin Elmer) | 3000 | integrating sphere |
| 0.5 - 2 | in KBr pellet | 1.81 | Lambda 19 (Perkin Elmer) | 10000 | agglomeration |
| 2 - 25 | in KBr pellet | 0.52 | FTIR 113v (Bruker) | 2500 - 200 | agglomeration |
| 25 - 100 | in PE pellet | 1.57 | FTIR 113v (Bruker) | 400 - 100 | agglomeration |
3.1 Measurements on films on CaF2 substrate
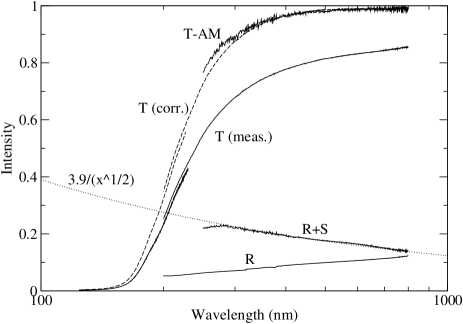
For the vacuum-ultraviolet (VUV) and the ultraviolet/visible (UV/Vis) measurements, four diamond-film samples were produced by transferring 3.7, 8.3, 34.4, and 63.3 g, respectively, of nano-diamonds from an aqueous colloidal (pH=6.8) to the surface of CaF2 windows. After drying, the nano-diamonds formed closed films of 7-8 mm diameter. The covered area was measured under an optical microscope. The deposited mass was determined with an accuracy of 0.05 g by weighing of the windows before and after deposition of the diamonds. The thickness homogeneity of the films was checked by optical transmission measurements at different positions and was found to be better than 20 %.
In the UV and visible (190 - 800 nm), a Perkin Elmer Lambda 19 spectrometer was used for measuring the transmission through the diamond films. The VUV spectrometer was a double-beam grating spectrometer built by Laserzentrum Hannover, using a deuterium lamp with MgF2 window as the light source. The wavelength range of this spectrometer is 115 - 230 nm (accuracy 0.2 nm), but the range of the measurements was limited by the CaF2 substrates to 124 nm. The VUV and UV/Vis transmission spectra measured on the same sample always agreed within a relative error of 5 % in the overlap region.
In order to eliminate substrate influences, in the VUV the transmission was measured at each of the CaF2 windows before and after sample deposition. The ratio of these spectra is the transmittance of the diamond film, which contains information about the reflection, the scattering and the absorption by the film. With the Lambda 19 spectrometer, we are able to disentangle these different loss mechanisms by additional measurements using an integrating sphere detector (spectral range 0.25 - 2.0 m). For these measurements, the sample is placed inside the integrating sphere and the intensity coming from the illuminated sample is collected and compared to the intensity of a reference beam. Opening/closing of ports for the transmitted and specularly reflected beams makes it possible to measure the scattered light individually or together with these contributions. Closing of all ports allows a direct measurement of the intensity absorbed by the sample (“absorption mode”).
The measurements using the integrating sphere revealed a reflectance of the samples of the order of 13 % at = 800 nm, which is expected for a film with a refractive index of about 2 on CaF2 substrate (see Fig. 2). This value decreased with decreasing wavelength, accompanied by an increase in the intensity of the diffusely scattered light. For the thinner films, scattering plus reflection increased only slightly toward smaller wavelengths, whereas for thicker films it increased up to 22 % at = 300 nm. We interpret this as a higher surface roughness of the thicker films.
The correction of the transmission spectra for the scattering and reflection effects was done by taking the reduction of the incident intensity by reflection and scattering losses into account, i.e. by dividing the original spectra by 1–R–S, R being the reflectance and S the scattering. For this purpose, the R+S spectra have been fitted either by a linear or a function and extrapolated to the VUV wavelengths. The resulting corrected spectra agree well with the spectra measured in the “absorption mode” (see Fig. 2). However, because of the narrower spectral region and the stronger noise, the latter have not been used.
For the final spectrum, in the VUV (wavelength range 0.12 - 0.23 m), the spectrum measured at the 8.3 g sample (column density = 16.9 g cm-2) was selected, because this was the thickest film being still transparent at the shortest wavelengths. For the UV/Vis wavelengths up to 0.5 m, the spectrum of the 34.4 g sample (column density = 69 g cm-2) was used. For significant measurements at larger wavelengths, the absorption by these films was too low. The thickest film (63.3 g) exhibited a tendency to flake and was not used.
The transmission T was converted to the mass absorption coefficient . Here, is the mass density and is the volume absorption coefficient which for a continuous material is given by with being the wavelength and being the imaginary part of the complex refractive index.
3.2 Measurements on KBr and polyethylene pellets
The spectrum in the visible and near-infrared range up to a wavelength of 2 m were measured again with the Lambda 19 spectrometer equipped with the integrating sphere. The sample here consisted of 2.4 mg of nano-diamonds, mixed thoroughly with powdered KBr and pressed into a pellet of 13 mm diameter. The column density of the nano-diamonds was thus = 1.81 mg cm-2. The pellet showed very strong diffuse scattering of up to 50% of the incident intensity, probably caused by big diamond aggregates concentrated around the KBr grains and by the high refractive index of the nano-diamonds compared to the KBr matrix. Consequently, apart from measuring the scattered intensity S, the “absorption mode” (see Sect. 3.1) of the integrating sphere was used to determine the absorbed intensity A. Since the scattering here is a volume effect in contrast to the scattering from the diamond film, scattering and absorption have to be treated as directly competing mechanisms, and the mass absorption coefficient can be calculated from
| (1) |
The calculated mass absorption coefficient is used in the final spectrum in the wavelength range 0.5 - 2 m. At shorter wavelengths, it starts to fall below the values expected from the film measurements because of saturation effects in the big clusters.
The measurements with the integrating sphere demonstrate that at infrared wavelengths nearly all the continuum extinction produced by nano-diamonds in KBr pellets is due to light scattering. At a wavelength of 2 m, has fallen to about 20 cm2g-1, whereas the extinction measured with the pellets is typically many 100 cm2g-1, even for pellets with a lower diamond concentration (see Braatz et al. braatz+etal00 (2000)). This was also noticed by Andersen et al. (andersen+etal98 (1998)), but a quantitative determination of the continuum absorption coefficient requires the integrating sphere technique and was not possible at that time.
Since the use of the integrating sphere is limited to wavelengths below 2 m, at larger wavelengths quantitative continuum absorption measurements with the KBr pellet technique have not been possible. However, with other techniques we did not succeed in producing the diamond column density of 10 mg cm-2 required for continuum measurements at mid-IR wavelengths. Therefore, for extending the diamond spectrum to the mid-IR, we have corrected the available spectra from Braatz (braatzthesis (2000)) for the scattering background and fitted them to the near-IR spectrum at = 2 m assuming that the slope of the spectrum between 1 and 2 m, which is approximately proportional to , would continue throughout the infrared. This slope is justified for nano-grains with disordered surfaces (Seki & Yamamoto sekiyamamoto80 (1980)), and agrees also well with the results of simple model calculations taking the disordered surface into account (see Fig. 7).
3.3 Description of the final spectrum
| vibrational groups | ||
| (m) | (cm-1) | |
| 2.95 | 3400 | OH stretching |
| 5.70 | 1760 | C==O stretching (Ester) |
| 6.2 | 1610 | OH deformation, |
| C==C stretching | ||
| 7–11 | 1400–900 | C–O–C (Ether) |
| C–O(H) | ||
| C==C deformation | ||
| C–C stretching | ||
| 19.7 | 508 | chromite |
| 26 | 385 | OH |
The combined optical absorption spectrum is characterized by a smooth curve throughout the UV, visible and near IR. In the UV at a wavelength of 200 nm, the mass absorption coefficient reaches about 104 cm2g-1, which is at least one order of magnitude less than for amorphous carbon but higher than for terrestrial diamonds. It is also higher by about a factor of two than the values reported by previous studies (Mutschke et al. mutschke+etal95 (1995); Andersen et al. andersen+etal98 (1998); Braatz et al. braatz+etal00 (2000)) for nano-diamonds dispersed in liquids. An explanation for this difference could be the sedimentation of diamond aggregates from the liquid lowering the actual concentration and therefore the measured absorption. Another explanation could be the influence of the thin-film geometry. This will be discussed further below.
There is no evidence for any of the features in the nm range, which were reported by Mutschke et al. (mutschke+etal95 (1995)), Andersen et al. (andersen+etal98 (1998)) and Braatz et al. (braatz+etal00 (2000)) with meteoritic diamonds. Whereas the feature at about 220 nm has only been seen by Mutschke et al. (mutschke+etal95 (1995)) and is probably due to a contamination, the 270 nm feature was detected by all authors and was ascribed by Braatz et al. (braatz+etal00 (2000)) to singly distributed N atoms. However, Andersen et al. (andersen+etal98 (1998)) noted that the feature was much weaker in Allende than in Murchison nano-diamonds, which is consistent with the lower N concentration (Russell et al. russell+etal91 (1991)). In previous measurements on the same sample as studied here, but dispersed in liquid, one of us found a very weak indication of enhanced absorption around 300 nm (Braatz braatzthesis (2000)).
It is possible that this weak band is also present in our result but that it is too weak to be detected on the background of the absorption edge. The difference in the spectra published by Andersen et al. (andersen+etal98 (1998)), and Braatz et al. (braatz+etal00 (2000)) and this study, however, leaves the possibility open that this band might be due to contamination as well. Graphitic carbon, e.g., would be able to cause a band at a similar position. For the purpose of this paper, this question is not very important because the influence of the band on the broad-band optical properties is only marginal.
In the IR, there appear absorption bands due to excitation of surface groups. The positions of the bands as well as their assignment are summarized in Table 2. They are clearly dominated by oxygen in carboxyl, carbonyl, and C-O-C groups. The influence of the isolation procedure on these bands is discussed in detail by Mutschke et al. (mutschke+etal95 (1995)), Hill et al. hill+etal97 (1997) and Braatz et al. (braatz+etal00 (2000)). This will not be repeated here.
It is an open question as to which of the features could have originated from the presolar history of the diamonds. There is an ongoing discussion on the possible formation sites of nano-diamonds; carbon-rich AGB stars (Jørgensen & Andersen jorgensen+andersen99 (1999)), supernovae (Clayton clayton89 (1989), Ott ott96 (1996)), the ISM (Tielens et al. tielens+etal87 (1987)) and the Solar nebula (Dai et al. dai+etal02 (2002)) have been suggested. The surface features of the nano-diamonds should first reflect the chemical environment at their place of formation. In carbon-rich AGB stars the dangling bonds of the diamond surface should be expected to primarily be chemically saturated by hydrogen and deuterium. In contrast to that, the other formation places are oxygen-rich which will lead to the formation of oxygen-containing functional groups at the surface as well as the graphitization of the surface due to catalytic reactions (Evans evans92 (1992)).
Furthermore, the surface structure is likely to be changed by interaction with UV photons, atoms, radicals, ice mantles, and so on, when exposed to various environments in the ISM. Nano-diamonds are therefore likely to show different spectral features depending on their astrophysical environment. It is also possible that the surface was changed during the incorporation in the meteorite, during solar system formation. However, it was shown by Virag et al. (virag+etal89 (1989)) that the presolar diamonds also carry anomalous hydrogen with 1H/2D = 5193 (terrestrial = 6667) implying that at least some of the surface groups are presolar.
The presented IR spectrum as well as most published IR data of meteoritic nano-diamonds represents well oxidized nano-diamonds. The potential user of the data needs to critically judge if these IR bands or possibly bands originating from another kind of surface species are likely to be produced by nano-diamonds in the environment under investigation.
4 Derivation of optical constants
4.1 EELS measurement
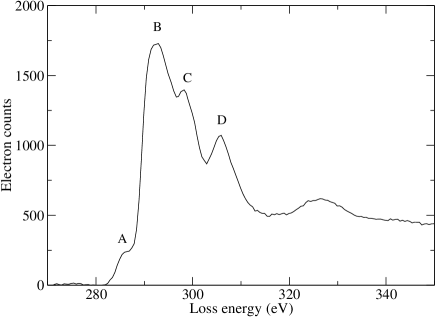
Electron energy loss spectroscopy (EELS) has been used before by Bernatowicz et al. (bernatowicz+etal90 (1990)) for the characterization of meteoritic nano-diamonds. It is performed by a magnetic prism spectrometer positioned beneath the viewing screen of a transmission electron microscope (TEM). During penetration of a thin sample, part of the electrons of the primary beam lose an energy E due to inelastic scattering at valence or core electrons of the sample material. The probability for such processes is proportional to the so-called loss function (E,q)), where (E,q) is the complex dielectric function of the material and denotes the imaginary part. The quantity q is the momentum transfer to the materials’ electron system in the scattering process. Resonances of the loss function occur for energies where the real part of the dielectric function vanishes ()=0) and collective excitations of the valence electrons (plasmons) are possible. This “plasmon loss” as well as losses due to interband transitions occur at loss energies lower than 100 eV, whereas at higher energies core electrons can be excited to states above the Fermi level (“core loss”).
(E,q) corresponds to the optical dielectric function ( being the complex refractive index) at wavelength = hc/E under the condition that q0, which restricts the scattering angle to small values. For practical purposes, q 0.1 Å-1 is sufficient (Pflüger et al. pflueger_palik (1991)), at larger angles, deviations in the positions and widths of the plasmon peaks have been measured for carbonaceous materials (Falke et al. falke+etal95 (1995)). This technique, thus, allows to derive the optical data of a material in the energy range of the strong electronic transitions up to 100 eV, corresponding to wavelengths down to 0.01 m.
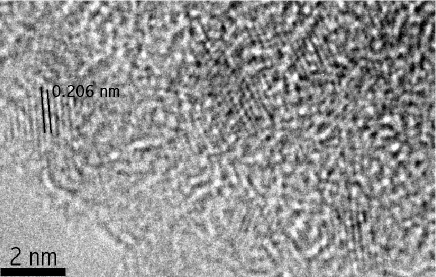
We have prepared the Allende nano-diamonds for EELS measurements by dispersing them in ethanol and transferring them onto a TEM copper grid covered with a porous (“lacey”) carbon film. Measurements have been done exclusively on particle aggregates located over film holes. The EELS spectra were obtained with a Philips CM200FEG high-resolution TEM operated in the diffraction mode (camera length 400 - 4700 mm), using a Gatan Imaging Filter (GIF 100) with 0.6 mm entrance aperture. Primary electron energies were 200 keV and the energy resolution was 0.9 eV based on the full-width-half-maximum (FWHM) of the zero energy loss peak. The acceptance angle for scattered electrons in the measurements was 0.4 mrad corresponding to a maximum momentum transfer of q 0.1 Å-1. The spectra were corrected for the influence of the energy distribution of the primary beam as well as for plural scattering events following the procedures described in Egerton (egerton96 (1996)). The contribution of the primary and elastically scattered electrons (“zero loss”) was removed from the spectrum by assuming a symmetric energy distribution of these electrons.
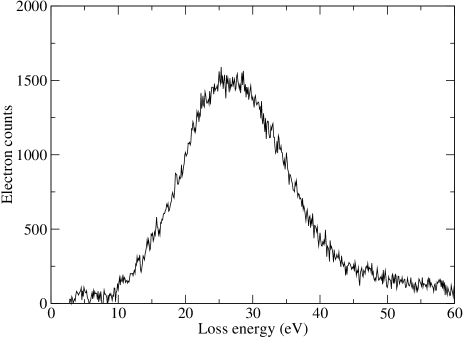
A typical corrected energy loss spectrum of the meteoritic nano-diamonds is shown in Fig. 4. It is similar to the ones obtained by Bernatowicz et al. (bernatowicz+etal90 (1990)) but the plasmon peak is found at a smaller energy loss of 26.5 eV compared to about 29 eV, which is a consequence of the restriction of the momentum transfer. Compared to bulk diamond (peak at 33.5 eV), the feature is strongly shifted and broadened. According to Bernatowicz et al. (bernatowicz+etal90 (1990)), this can be understood as due to surface carbon atoms deviating in their bonding type from the volume atoms and a mixing of the corresponding dielectric functions. At the signal-to-noise level achievable with these angle-resolved EELS measurements, it is not possible to detect or exclude features due to -electron transitions, which would occur at energies below 8 eV. In measurements performed with a much larger acceptance angle (in imaging mode), however, distinct -electron features are typically not observed with our sample. For the determination of the dielectric function, the loss function at energy losses lower than 8 eV has not been used.
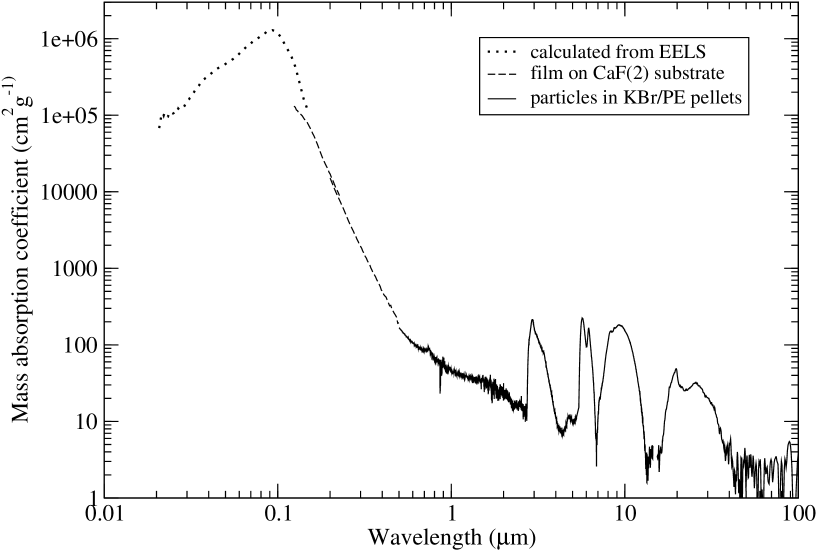
From the loss function Im(-1/(E,q0)), the dielectric function () can be determined via Kramers-Kronig analysis, if the spectrum can be normalized in a proper way. The possibility for the normalization is e.g. provided by assuming at low energies, the inverse value of which is related to the integral over the loss function weighted with (Pflüger et al. pflueger_palik (1991)). The value of at low energies is identical to the square of the refractive index and can be determined from optical measurements in the visible. We adopted for a value of 4.0, estimated by Lewis et al. (lewis+etal89 (1989)) from density measurements for the meteoritic nano-diamonds. From the normalized loss function, () has been calculated in the wavelength range 10 - 200 nm. Further, this preliminary dataset has been converted into a synthetic absorption spectrum of nano-diamonds in an environment with , which completes the optical absorption spectrum as shown in Fig. 3.
4.2 Optical constants
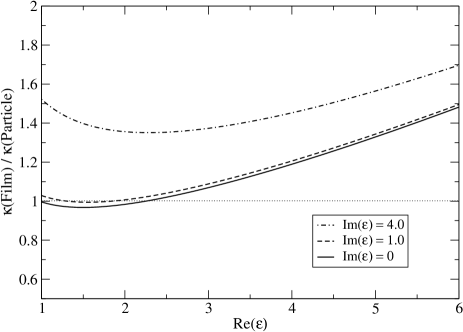
Before the combined absorption spectrum, shown in Fig. 3, can be used to derive a consistent wavelength-dependent dielectric function, we have to ask whether the thin-film and small-particle absorption spectra are compatible or can be transformed into each other. Although they match quite well in our measurements, the quantities and (for spherical grains which are small compared to the wavelength) are related to the dielectric function of the material by different expressions:
| (2) |
| (3) |
with describing the surrounding medium (Bohren & Huffman bohren+huffman83 (1983)). The ratio of and for a range of complex -values and for = 2.3, which is approximately valid for both KBr and polyethylene matrices, is shown in Fig. 5. It demonstrates that the deviation between both quantities for nano-diamonds with an assumed of 4.0 is of the order of 20 % in spectral ranges where the absorption of the material is low ( 1.0). In the band edge, where both and increase, the deviation can reach 50 % or more, whereas at even shorter wavelengths, where anomalous dispersion occurs and falls down to values of 1.0 and smaller, the deviation is reduced again. This means that at wavelengths smaller than about 150 nm the steepness of the thin-film spectrum should decrease, what indeed seems to be observed (see Fig. 3).
We have accounted for these effects by dividing the thin-film spectra by a factor of 1.3 and by not using them below = 0.18 m. After that, the different parts of the spectrum including the synthetic far-UV spectrum have been merged into one (using linear interpolation if necessary) at a reduced resolution, with equidistant points on the logarithmic scale. From this spectrum, the dielectric function has been deduced by using the Kramers-Kronig transformation based on Eq. 3 developed by Ossenkopf et al. (ossenkopf+etal92 (1992)).
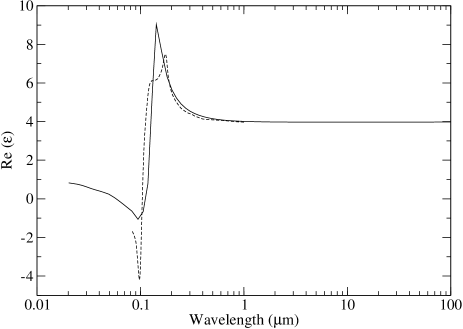
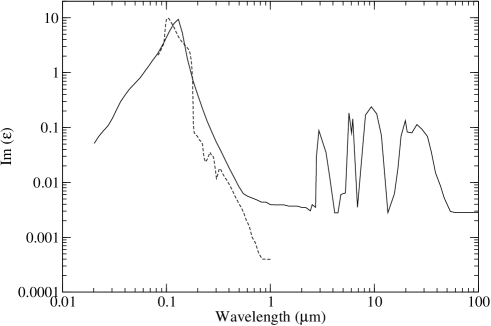
The resulting dataset is shown in Fig. 6 compared to the previous data by Lewis et al. (lewis+etal89 (1989)). In the UV and visible, the Lewis et al. data deviate from our new results. They are based on modified bulk data rather than on measurements and do not take into account the nano-particle character of the meteoritic diamonds. In astronomical modelling, usually the complex refractive index m = n + ik = is used instead of the dielectric function to describe the optical material properties. Therefore, we give these values in Table 3.
5 Discussion
| Q/a | |||||||||||
| m | cm-1 | m | cm-1 | m | cm-1 | ||||||
| 0.0202 | 2.399E5 | 0.908 | 0.0283 | 0.4493 | 531.6 | 2.049 | 0.0030 | 6.1957 | 490.4 | 1.993 | 0.0361 |
| 0.0224 | 2.984E5 | 0.890 | 0.0388 | 0.4966 | 338.4 | 2.038 | 0.0021 | 6.8731 | 10.82 | 1.993 | 0.0008 |
| 0.0247 | 3.490E5 | 0.868 | 0.0499 | 0.5488 | 229.5 | 2.029 | 0.0015 | 8.2001 | 434.9 | 1.993 | 0.0423 |
| 0.0275 | 4.093E5 | 0.833 | 0.0649 | 0.6065 | 187.2 | 2.022 | 0.0014 | 9.3392 | 539.8 | 1.994 | 0.0599 |
| 0.0302 | 5.297E5 | 0.791 | 0.0921 | 0.6679 | 159.6 | 2.016 | 0.0013 | 10.521 | 357.5 | 1.994 | 0.0447 |
| 0.0334 | 7.601E5 | 0.743 | 0.1463 | 0.7361 | 135.2 | 2.012 | 0.0012 | 11.673 | 130.0 | 1.993 | 0.0180 |
| 0.0364 | 1.002E6 | 0.716 | 0.2088 | 0.8198 | 110.6 | 2.008 | 0.0011 | 13.478 | 4.401 | 1.993 | 0.0007 |
| 0.0413 | 1.318E6 | 0.691 | 0.3061 | 0.9067 | 100.3 | 2.005 | 0.0011 | 15.567 | 8.455 | 1.993 | 0.0016 |
| 0.0442 | 1.500E6 | 0.684 | 0.3660 | 1.0063 | 81.14 | 2.002 | 0.0010 | 16.836 | 22.83 | 1.993 | 0.0046 |
| 0.0494 | 1.767E6 | 0.676 | 0.4642 | 1.1052 | 73.99 | 2.001 | 0.0010 | 18.026 | 81.64 | 1.993 | 0.0175 |
| 0.0561 | 2.226E6 | 0.661 | 0.6143 | 1.2140 | 67.44 | 1.999 | 0.0010 | 19.834 | 142.5 | 1.994 | 0.0336 |
| 0.0617 | 2.719E6 | 0.688 | 0.7589 | 1.3521 | 60.62 | 1.998 | 0.0010 | 20.666 | 84.96 | 1.994 | 0.0209 |
| 0.0685 | 3.131E6 | 0.744 | 0.9170 | 1.5006 | 51.88 | 1.997 | 0.0009 | 22.878 | 73.73 | 1.994 | 0.0200 |
| 0.0725 | 3.239E6 | 0.793 | 1.0123 | 1.6482 | 47.26 | 1.996 | 0.0009 | 25.624 | 93.56 | 1.994 | 0.0285 |
| 0.0826 | 2.981E6 | 0.917 | 1.2159 | 1.8166 | 42.90 | 1.995 | 0.0009 | 28.680 | 68.44 | 1.994 | 0.0233 |
| 0.0946 | 2.099E6 | 1.149 | 1.5429 | 2.0162 | 36.47 | 1.995 | 0.0009 | 32.369 | 44.98 | 1.994 | 0.0173 |
| 0.1062 | 1.215E6 | 1.564 | 1.7640 | 2.1915 | 33.56 | 1.994 | 0.0009 | 35.291 | 21.32 | 1.994 | 0.0089 |
| 0.1181 | 7.240E5 | 2.080 | 1.8828 | 2.4239 | 26.40 | 1.994 | 0.0008 | 38.699 | 8.142 | 1.994 | 0.0037 |
| 0.1303 | 3.738E5 | 2.870 | 0.6377 | 2.5208 | 33.03 | 1.994 | 0.0010 | 43.177 | 4.220 | 1.994 | 0.0022 |
| 0.1423 | 1.882E5 | 3.124 | 0.8535 | 2.7167 | 27.36 | 1.994 | 0.0009 | 46.804 | 2.373 | 1.994 | 0.0013 |
| 0.1592 | 8.657E4 | 2.793 | 0.3182 | 2.7753 | 233.4 | 1.994 | 0.0077 | 53.746 | 1.161 | 1.994 | 0.0007 |
| 0.1807 | 4.226E4 | 2.520 | 0.1404 | 2.9240 | 638.1 | 1.994 | 0.0222 | 60.340 | 0.983 | 1.994 | 0.0007 |
| 0.2019 | 2.399E4 | 2.374 | 0.0790 | 3.4233 | 217.2 | 1.994 | 0.0088 | 66.686 | 0.889 | 1.994 | 0.0007 |
| 0.2231 | 1.411E4 | 2.285 | 0.0477 | 3.6873 | 79.40 | 1.993 | 0.0035 | 73.700 | 0.804 | 1.994 | 0.0007 |
| 0.2466 | 8320 | 2.218 | 0.0294 | 4.1531 | 14.17 | 1.993 | 0.0007 | 81.450 | 0.728 | 1.994 | 0.0007 |
| 0.2747 | 4984 | 2.165 | 0.0187 | 4.4645 | 13.21 | 1.993 | 0.0007 | 90.017 | 0.659 | 1.994 | 0.0007 |
| 0.3012 | 3209 | 2.131 | 0.0129 | 4.7597 | 26.83 | 1.993 | 0.0015 | 98.620 | 0.601 | 1.994 | 0.0007 |
| 0.3329 | 2084 | 2.102 | 0.0090 | 5.2659 | 25.81 | 1.993 | 0.0016 | 109.95 | 0.539 | 1.994 | 0.0007 |
| 0.3679 | 1312 | 2.080 | 0.0062 | 5.6899 | 685.1 | 1.994 | 0.0460 | ||||
| 0.4066 | 827.2 | 2.063 | 0.0042 | 6.0254 | 279.1 | 1.993 | 0.0200 |
Observations of nano-diamonds in space would be very desirable first for the clarification of their origin and evolution, and second for the determination of their abundance. Unfortunately, with the exception of the diamond detection in a few Herbig Ae/Be objects and one post-AGB star (Guillois et al. guillois+etal99 (1999)), there were no positive results yet. There might be a number of reasons for this; one is that the intrinsic features longward of the electronic band edge are very weak, even for nitrogen-doped diamonds. A second reason is that surface groups may produce strong bands, but that it may be hard to distinguish them from bands produced by other carbonaceous matter. Moreover, the actual surface structure of nano-diamonds in space is unknown and is likely to depend on the environment. Finally, the diamonds may be covered or incorporated into larger grains, which would alter their signature or prevent it from becoming visible.
One chance for the detection is the tiny size of the nano-diamonds, which opens the possibility of stochastic heating to temporarily high temperatures by single UV-photon absorption. Consequently, they could become visible in emission, if the nano-diamonds would be separated from other grains. In the case of the diamond emission bands seen in the Herbig Ae/Be objects, it has been possible to derive an abundance of the diamonds which, however, is very low (1 part per billion relative to hydrogen, van Kerckhoven et al. vankerckhoven+etal02 (2002)). This abundance value, however, may reflect only a population of diamond grains in a narrow size range which allows both the stochastic heating process and the presence of well-ordered surfaces. The abundance of nano-diamonds in primitive meteorites is, as we know, much higher (500–1000 ppm), but one must bear in mind the possibility that the concentration of interstellar diamonds in meteorites could be disproportionately high as a result of their superior chemical and physical durability (Sandford sandford96 (1996)).
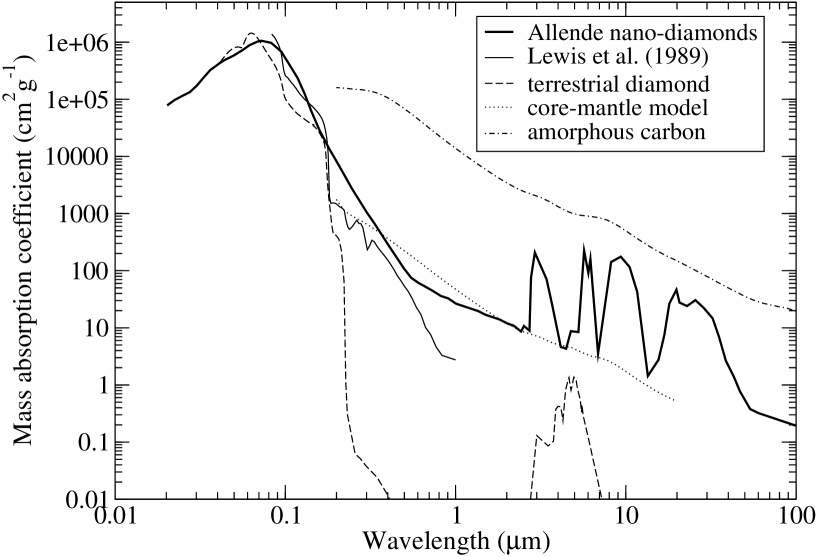
A more exact way to derive upper limits of the diamond abundance in space is provided by the ultraviolet absorption of the diamonds. Lewis et al. (lewis+etal89 (1989)) suggested that it would be compatible with the measured interstellar extinction (e.g. Stecher stecher65 (1965); Fitzpatrick & Massa fitzpatrick+massa86 (1986); Clayton et al. clayton+etal03 (2003)), if 10% of the carbon would be present as diamonds. Interestingly, the comparison of mass absorption coefficient spectra in Fig. 7 reveals that the Lewis et al. data are erroneous because they produce higher absorption values than the original bulk diamond data, contrary to what had been intended. The reason for this is that Lewis et al. (lewis+etal89 (1989)) reduced the imaginary part of the dielectric function to account for the reduced density of the meteoritic diamonds instead of reducing the polarizability. Our results give a value of the ultraviolet extinction of meteoritic nano-diamonds at the Lyman limit which is about a factor of 1.5 less than the estimate by Lewis et al. (lewis+etal89 (1989)). Thus, the restrictions on the amounts of diamonds which can be present in space are less strict than previously suggested. Even larger masses of big diamonds could be hidden in the ISM, in principle.
Another constraint on the abundance of nano-diamonds comes from the lack of structure in the observed galactic extinction curve at the position of the diamond band edge (6.9 eV). Lewis et al. (lewis+etal89 (1989)) estimated a detection threshold of this structure of about 10% of the carbon present as diamonds. This threshold should be increased as well to account for the shallower band edge of the meteoritic nano-diamonds compared to the data used by Lewis et al. (lewis+etal89 (1989)).
For the energetic and hydrodynamic modelling of environments possibly containing significant amounts of diamond dust, it will be important to consider the infrared properties of these particles. Our results indicate that their mass absorption coefficient in the visible and IR is about two orders of magnitude lower than that of amorphous carbon particles. That would not have been expected from previous results e.g. by Bernatowicz et al. (bernatowicz+etal90 (1990)), which indicated the presence of a thick amorphous-carbon mantle of up to 46% of the particle’s volume. We find that a core-mantle model is probably not well suited for the description of meteoritic nano-diamonds because our spectroscopic results would be consistent only with an unphysical mantle volume fraction of not more than 1% (see Fig. 7).
6 Conclusions
We have performed an extended spectroscopic study of presolar nano-diamonds from the Allende meteorite to close the gaps in the currently known optical data of this material. Different spectroscopic techniques have been used to obtain a consistent complete absorption spectrum of our sample of meteoritic nano-diamonds and to derive the optical constants. Our results indicate that the limits on the amount of diamond grains which can be present in space within the current observational restraints are about a factor of 1.5 higher than previously estimated by Lewis et al. (lewis+etal89 (1989)). Furthermore, the mass absorption coefficient at visible and IR wavelengths is about two orders of magnitude lower than that of amorphous carbon, which is not consistent with the presence of a thick amorphous-carbon mantle. These results can be used to improve current models of the environments where nano-diamonds are expected to be present. Further studies on the optical properties of nano-diamonds in a wide spectral range would be valuable, in order to investigate their dependence on surface processing in the lab and in space.
Acknowledgements.
The authors would like to thank Gabriele Born for help with the preparational work. Further, we thank R. Schlögl, D. Su, H. Sauer, M. Willinger, and J.-O. Müller of the Fritz-Haber-Institut Berlin for the possibility to perform the EELS measurements and their help. This work has been supported by DFG grant Mu 1164/4 within the DFG Research Unit ”Laboratory Astrophysics”. It is also part of a joint effort in laboratory astrophysics between the University of Jena and the MPI for Astronomy Heidelberg. ACA acknowledges support from the Carlsberg Foundation.References
- (1)
- (2) Alexander C. M. O’D., Swan P. & Walker R. M., 1990, Nat 348, 715
- (3) Amari S., Lewis R.S. & Anders E., 1994, Geochim. Cosmochim. Acta 58, 459
- (4) Andersen A.C., Jørgensen U.G., Nicolaisen F., Sørensen P.G. & Glejbøl K., 1998, A&A 330, 1080
- (5) Allamandola L.J., Sandford S.A. & Tielens A.G.G.M., 1992, A&A 399, 134
- (6) Banhart F., Lyatovich Y., Braatz A., et al., 1998, Meteorit. Planet. Sci. 33, A12
- (7) Bernatowicz T.J., Gibbons P.C. & Lewis R.S., 1990, ApJ 359, 246
- (8) Blake D.F., Freund F., Krishnan K.F.M., et al., 1988 Nature 332, 611
- (9) Bohren C.F. & Huffman D.R., 1983, Absorption and Scattering of Light by Small Particles (John Wiley & Sons, New York)
- (10) Braatz A., 2000, PhD thesis, Friedrich Schiller University Jena
- (11) Braatz A., Ott U., Henning Th., Jäger C., Jeschke G., 2000, Meteorit. Planet. Sci. 35, 75
- (12) Brooke T.Y., Sellgren K. & Smith R.G., 1996, ApJ 459, 209
- (13) Brooke T.Y., Sellgren K. & Geballe T.R., 1999, ApJ 517, 883
- (14) Clayton D.D., 1989, ApJ 340, 613
- (15) Clayton D.D., Mayer B.S., Sanderson C.I., et al., 1995, ApJ 447, 894
- (16) Clayton G.C., Gordon K.D., Salama F., et al., 2003, ApJ 592, 947
- (17) Colangeli L., Mennella V., Stephens J.R. & Bussoletti E., 1994, A&A 284, 583
- (18) Dai Z.R., Bradley J.P., Joswiak D.J., et al., 2002, Nat 418, 157
- (19) Daniels J., v. Festenberg, C., Raether H., & Zeppenfeld K., 1970, Springer Tracts in Modern Physics, 94, 77
- (20) Dorschner J., Henning Th., Jäger C., Mutschke H. & Ott U., 1996, Meteorit. Planet. Sci. 31, A37
- (21) Edwards D.F. & Philipp H.R., 1985, In: E. D. Palik (ed.), Handbook of Optical Constants of Solids, Orlando: Academic Press, p. 665
- (22) Egerton R.F., 1996, Electron Energy Loss Spectroscopy in the Electron Microscope, 2nd ed., Plenum Press, New York
- (23) Evans S., 1992, Surface properties of diamond. In: J.E. Field (ed.), The Properties of Natural and Synthetic Diamond, Academic Press, London, 181
- (24) Evans S., 1994, Reactivity of diamond surfaces. In: G. Davies (ed.), Properties and Growth of Diamond, EMIS Datareviews Series, vol.9, INSPEC, London, 64
- (25) Falke U., Weber, A. & Ullmann J., 1995, Microsc. Microanal. Microstruct., 6, 113
- (26) Fitzpatrick E.L. & Massa D., 1986, ApJ 307, 286
- (27) Fraundorf P., Fraundorf G., Bernatowitz T., et al., 1989, Ultramicroscopy 27, 401
- (28) Guillois O., Ledoux G. & Reynaud C., 1999, ApJ 521, L133
- (29) Hill H.G.M., d’Hendecourt L.B., Perron C. & Jones A. P., 1997, Meteoritics & Planetary Sci. 32, 713
- (30) Hill H.G.M., Jones A. P. & d’Hendecourt L.B., 1998, A&A 336, L41
- (31) Huss G. R., 1990, Nat 347, 159
- (32) Huss G. & Lewis R.S., 1995, Geochim. Cosmochim. Acta 52, 115
- (33) Jäger C., 1997, PhD thesis, Friedrich Schiller University Jena
- (34) Jäger C., Mutschke H., Henning Th., 1998, A&A 332, 291
- (35) Jones A.P. & d’Hendecourt L., 2000, A&A 355, 1191
- (36) Jones A.P., d’Hendecourt L.B., Sheu S.-Y., Chang H.-C., Cheng C.-L., Hill H.G.M., 2004, A&A 416, 235 A&A 355, 1191
- (37) Jørgensen U.G., 1988, Nat 332, 702
- (38) Jørgensen U. G. & Andersen A. C., 1999, In: R. F. Wing (ed.) The Carbon Star Phenomenon, IAU Symp. 177, Kluwer, 349
- (39) Koike C., Wickramasinghe C., Kano N., et al., 1995, MNRAS 277, 986
- (40) Kwok S., Volk K. M. & Hrivnak B. J., 1989, ApJ 345, L51
- (41) Kwok S., Volk K. M. & Hrivnak B. J., 1999, in Asymptotic Giant Branch Stars, IAU Symposium 191, ed. T. Le Bertre, A. Lebre, & C. Waelkens, 297
- (42) Lambert D. L., 1992, A&AR 3, 201
- (43) Lewis R. S., Tang M., Wacker J. F., et al., 1987, Nat 326, 160
- (44) Lewis R.S., Anders E. & Draine B.T., 1989, Nat 339, 117
- (45) Lewis R. S., Huss G. R. & Lugmair G., 1991, Lunar Planet. Sci. 22, 807
- (46) Mutschke H., Dorschner J., Henning Th., et al., 1995, ApJ 454, L157
- (47) Ossenkopf V., Henning Th. & Mathis J.S., 1992, A&A 261, 567
- (48) Ott U., 1996, ApJ 463, 344
- (49) Ott U., 2003, In: Th. Henning (ed.) Astromineralogy, Springer, Berlin, 236
- (50) Papoular R., 2000, A&A 362, L9
- (51) Pflüger J. & Fink J., 1991, In: E. D. Palik (ed.), Handbook of Optical Constants of Solids II, Boston: Academic Press, p. 293
- (52) Posch Th., Mutschke H., Andersen A.C., ApJ, submitted
- (53) Russell S.S., Arden J.W., Phillinger C.T., 1991, Sci 254, 1188
- (54) Sandford S.A., 1996, Meteorit. Planet. Sci. 31, 449
- (55) Seki J. & Yamamoto T., 1980, Astrophys. Space Sci., 72, 79
- (56) Sheu S.-Y., Lee I.-P., Lee Y.T., & Chang H.-C., 2002, ApJ 581, L55
- (57) Speck A.K. & Hofmeister A.M., 2003, ApJ, in press
- (58) Stecher T.P., 1965, ApJ 142, 1683
- (59) Tang M. & Anders E., 1988, Geochim. Cosmochim. Acta 52, 1235
- (60) Tielens A.G.G.M., Seab C.G., Hollenbach D.J., McKee C.F., 1987, ApJ 319, L109
- (61) van Kerckhoven C., Tielens A.G.G.M. & Waelkens C., 2002 A&A 384, 568
- (62) Virag A., Zinner E. K., Lewis R. S., Tang M., 1989, Lunar Planet. Sci. 20, 1158
- (63) Volk K. M. Kwok S. & Hrivnak B. J., 1999, ApJ 516, L99
- (64) von Helden G., Tielens A.G.G.M., van Heijnsbergen D., et al., 2000, Science 288, 313
- (65) Zinner E., 1998, Annu. Rev. Earth Planet. Sci. 26, 147