New Reference Galaxy Standards for H i Emission Observations
Abstract
We have taken advantage of the improved baselines and higher sensitivity available with the upgraded Arecibo 305m telescope to create a new H i spectral line catalog of disk galaxies which can be used as a reference catalog for anyone interested in 21-cm spectral line work. In all 108 galaxies were observed, covering 24h of the sky at declinations between 0 and velocities between 0 – 25,000 km s-1. The majority of the galaxies were observed at least two times on different nights to avoid problems with radio frequency intereference, baselines fluctuations, etc. Comparing our measured values with all those available in the literature show that while large individual variations may exist, the average differences between the measurements to be zero. In all we have considerable confidence in our measurements, and the resultant catalog should be extremely useful as a well defined reference catalog for anyone interested in 21-cm spectral line work.
1 Introduction
The 21-cm neutral hydrogen line is possibly the most commonly observed spectral line by centimeter wavelength telescopes. Yet a brief perusal through any collection of of H i observations on a gas-rich galaxy will often find flux measurements varying by 5% – 100%, or more (Huchtmeier & Richter 1989; NED111NED, the NASA/IPAC Extragalactic Database, is operated by the Jet Propulsion Laboratory, California Institute of Technology, under contract with the National Aeronautics and Space Administration.). The reasons behind these discrepancies are many-fold. The simplest explanation for the differences is various telescopes’ beam sizes and shapes. That is, observing a galaxy with H i spread over a 10′ region with the Arecibo 305m telescope (3.6′ FWHM beam at 1.4 GHz) would certainly result in a different flux measurement than if that same object were observed with the Green Bank Telescope (9.2′ FWHM beam at 1.4 GHz). Yet while the differences in beam sizes and patterns may account for some of the discrepancies seen, it cannot be the only explanation, as only a fraction of the known galaxies have diameters larger than the Arecibo beam. (Roughly 15% of the galaxies in the UGC catalog have optical diameters 2′ – Nilson 1973.) Instead, or in addition, to the previous explanation, the discrepancies in the different measurements may be due to inaccuracies in the hardware and software used for data taking and analysis. These can include pointing offsets, unstable hardware resulting in baseline variations, rapid (compared to the frequency of measurements) temperature fluctuations, poor telescope focus, and over- or under-estimates of line flux due to inaccurate baseline fitting. In addition, line flux measurements can suffer from erroneous values of both the astronomical (gain) and system (temperature) calibration values due to either inaccuracies in the measurements or or measurement which are sampled too sparsely in time, frequency, or position to accurately reflect the system.
As a result of the variations found in the different H i galaxy catalogs, astronomers wishing to obtain accurate flux values for a given galaxy are often forced to average the various measurements found in published catalogs, invoke a selection effect on the previous measurements, assuming some measurements are more accurate than others, or simply re-observe the objects of interest with the hope that their data will be be more reliable, on average, than that found in the literature. While all of the above methods are sound and should be encouraged, they can also be impractical, particularly when the researcher is interested in comparing their own results against a consistent, well-defined catalog with readily understood errors. This is not meant to imply that catalogs of H i measurements found in the literature are in general unreliable, simply that as the purpose of the majority of catalogs is to look for statistical information regarding the neutral hydrogen content in the studied galaxies, the errors associated with the measurements for an individual galaxy can be fairly high.
Previous efforts have been made to generate extremely accurate lists of H i in galaxies for calibration and references purposes (e.g. Tifft 1992; Schneider, et al. 1992; Huchtmeier & Richter 1988; Baiesi-Pillastrini & Palumbo 1986). However, as a result of its recent upgrade (Salter, 2002), the Arecibo 305m telescope now offers unprecedented stable baselines, increased sensitivity, and extremely good pointing. As a consequence, we have taken advantage of Arecibo’s exceptional performance and have observed over 100 galaxies with the aim of offering a catalog of H i observations which can be used as a reference catalog for anyone interested in 21-cm spectral line work. All of the data and results for this project are publicly available online at both http://www.gb.nrao.edu/$∼$koneil/HIsurvey and http://www.naic.edu/$∼$astro/HIsurvey.
2 Catalog Selection


The galaxies chosen cover the complete Arecibo sky (), with at least three galaxies within any given hour of LST. Additionally, an attempt was made to cover velocity space from 0 – 25,000 km s-1. However, our requirement that the objects’ signal-to-noise be reasonably high within a few minutes of observation (detailed below) resulted in the majority of the objects lying at 8,000 km s-1. To remedy this problem, a few objects were observed which do not meet the signal-to-noise criteria. These objects are noted in Table 1, which also gives a complete listing of galaxies observed and their coordinates, and Figures 1 and 2 show the distribution of the galaxies in velocity, Declination, and Right Ascension space.
In addition to the above constraints, the selection for the catalog was based on five major criteria. The observed galaxies should:
-
•
Have previous 21-cm line measurements indicating an emission of at least 10 mJy. This ensures a signal-to-noise ratio at Arecibo of 8 after five minutes of on-source observation (using 8.5 km s-1 channel-1 resolution);
-
•
Have an optical diameter, D 2′ to avoid the galaxy’s H i from extending past the 3.5′ Arecibo beam;
-
•
Be isolated to a 10′, 1000 km s-1 radius to avoid contamination through the beam side-lobes;
-
•
Have no significant continuum emission. This avoids residual standing waves which arise from Arecibo’s partially blocked aperture (Ghosh & Salter, 2001).
No information regarding the distribution of the H i for the observed galaxies was used in determining the catalog, in large part due to the fact that such information is not available for many of the galaxies observed. As a result, any discontinuities or asymmetries in the galaxies’ H i distribution was not accounted by this project.
3 Observations, Calibration, and Data Reduction
Data was taken with the L-narrow receiver between Aug, 2001 - July, 2002. Each galaxy was observed with two polarization channels at two different resolutions (12.5 MHz/2048 channels for 1.3 km s-1 channel-1 resolution and 6.25 MHz/2048 channels for 0.63 km s-1 channel-1 resolution at 1420 MHz). Standard position switching techniques were used for all observations, tracking the same azimuth and zenith angle for the off-source observation as for the on-source observation to reduce differences in the baseline shapes. Observations were typically 5 minutes on-source and 5-minutes off-source, although the total time was occasionally reduced if the telescope scheduling required it. Temperature measurements (with a calibrated noise diode) were made after each on+off observation pair. Details on the noise diode calibration can be found on the Arecibo web pages at http://www.naic.edu/$∼$astro/Lnarrow.
A gain curve for the telescope was obtained through reducing all observations taken of standard continuum calibrators, by any project, during the observing period. A complete description of the procedures used to determine the gain curve in this manner can be found in Heiles (2001). Additionally, observations were made of standard continuum calibrators every 2-3 hours during the project observations, with the results checked against the determined telescope gain, to insure no anomalous behavior occurred in the hardware during observations.
The variation between any individual measurement of a calibration source and the gain measurement could range as high as 20%, particularly in Arecibo’s outer declination reaches (32 36∘). Smoothing the individual measurements onto a two-dimensional fit reduces the overall calibration error to less then 10%. To further reduce the error, sources were observed at angles between 2∘ – 14∘ from the zenith whenever possible to avoid the regions where the residuals of the gain curve fit were high. Finally, each object was observed a number of different times, at different LSTs, so that any variations in the determined two-dimensional gain curve are minimized. The the end result is flux measurements which should be reliable at the 5% level, or better.
To reduce the data, first the individual scans for each observation were averaged, and the on- and off-source observations were combined. The correct value for the gain curve was obtained using the average azimuth and zenith from the individual one second data dumps. The gain and system temperature corrections were made after combining the on- and off-source observations. At this point baselines were subtracted (using first order polynomials) and the flux, heliocentric velocity, and velocity widths were determined from each individual observation. This allowed for the determination of the potential ranges of values which an astronomer might see when observing a given object. Finally, the individual observations (without baseline subtractions) were combined to give the highest possible signal-to-noise for a given galaxy. Baselines were subtracted and the flux, heliocentric velocity, and velocity widths were determined from this averaged observation. In each case baseline fitting was done using a minimum of 200 frequency channels on each side of the line of interest. In sum, the observed, reduced data was
All baselines appeared to be best fit (in the sense) by first order polynomials. Any discrepancies between the baseline fits and the data are reflected in the r.m.s. measurements obtained.
4 Final Results and Error Calculations
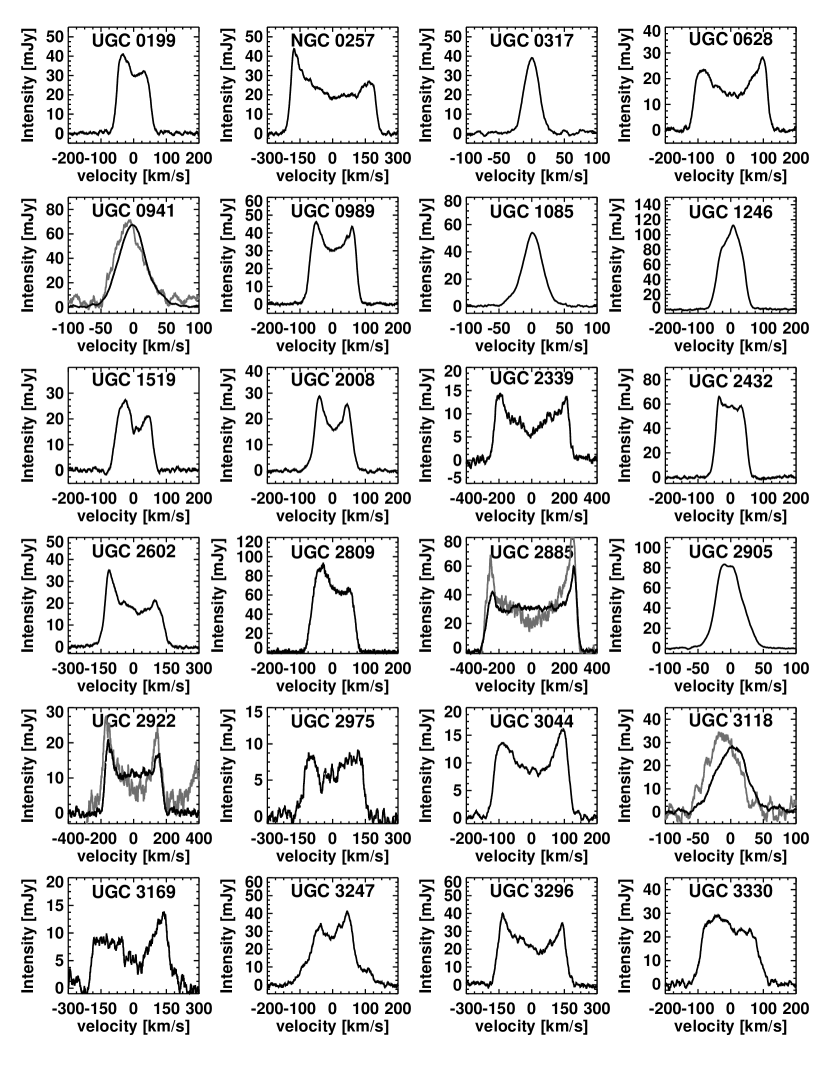
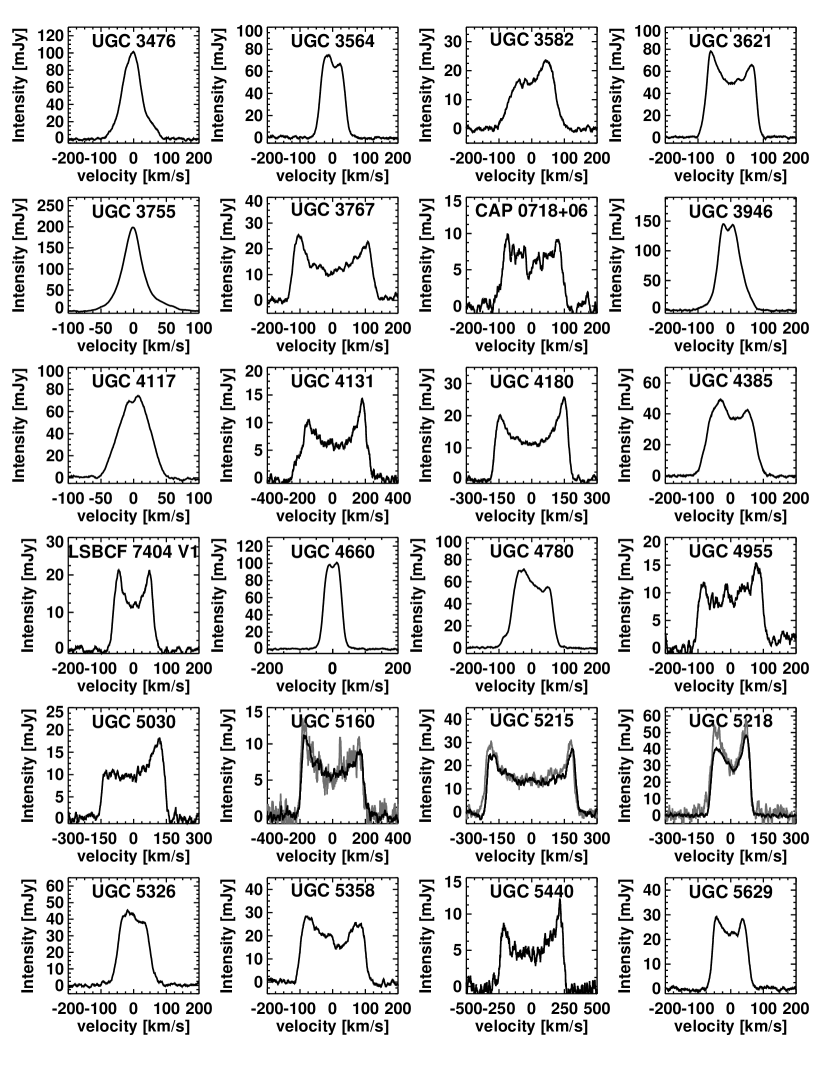
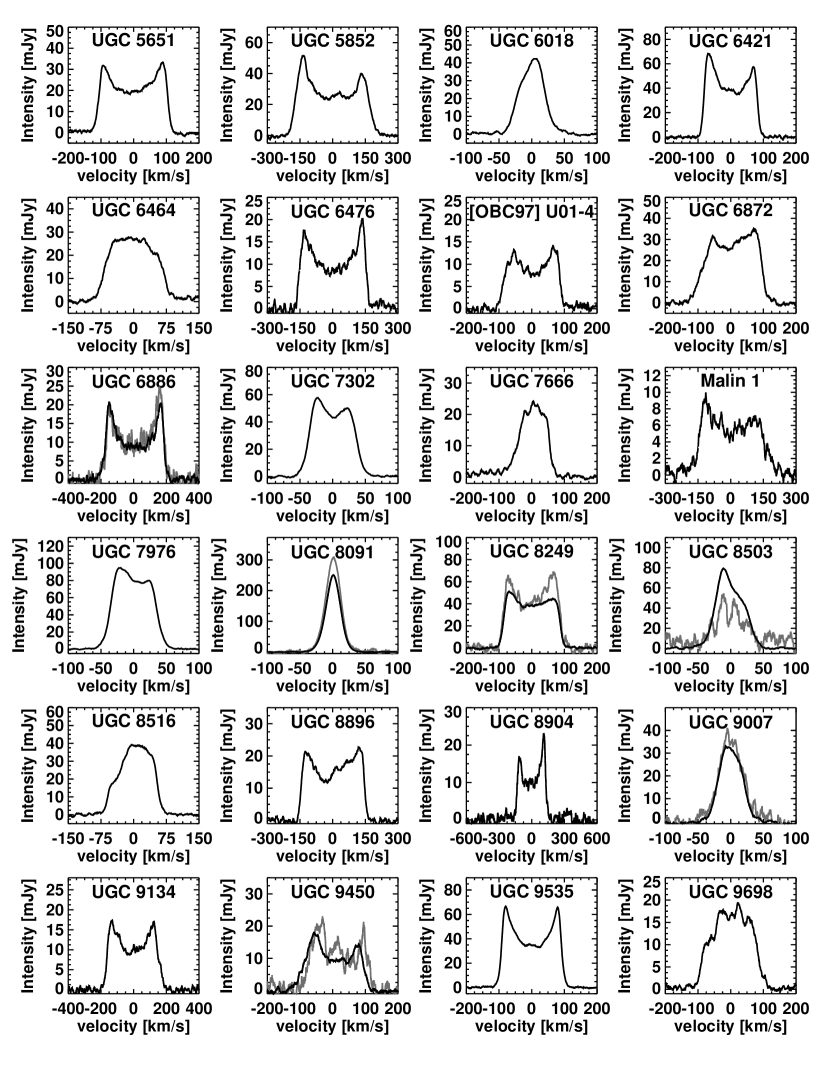
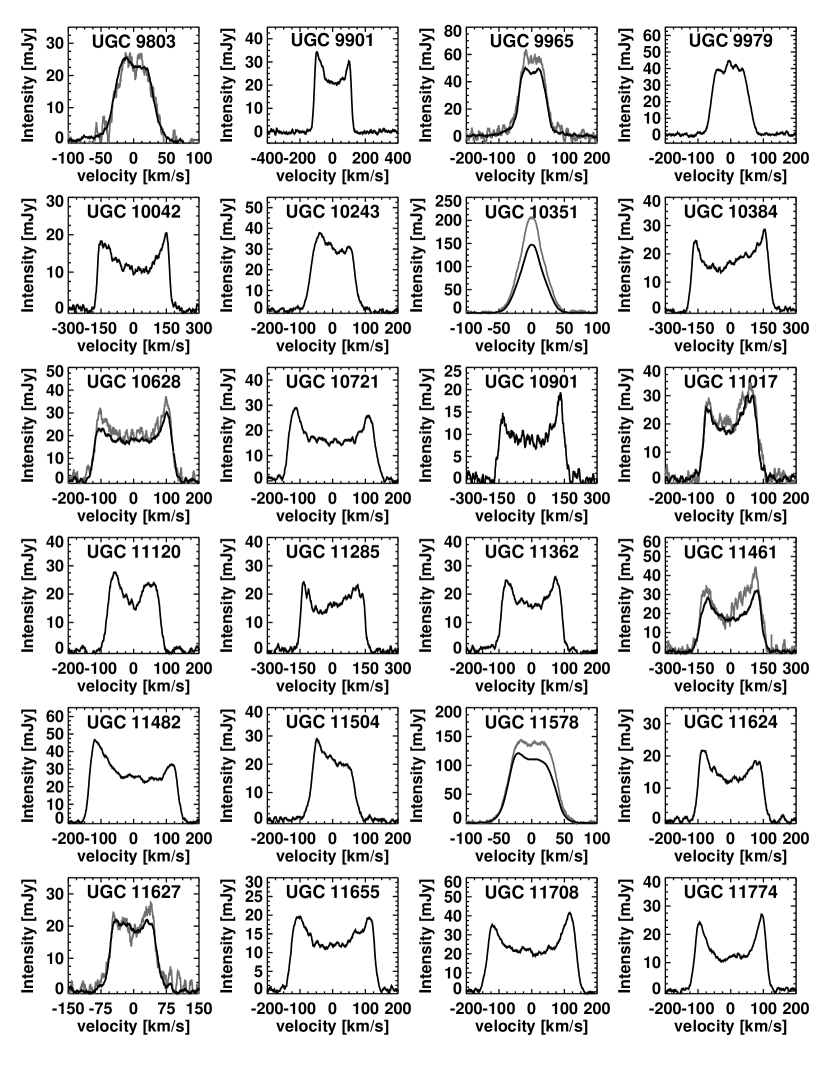
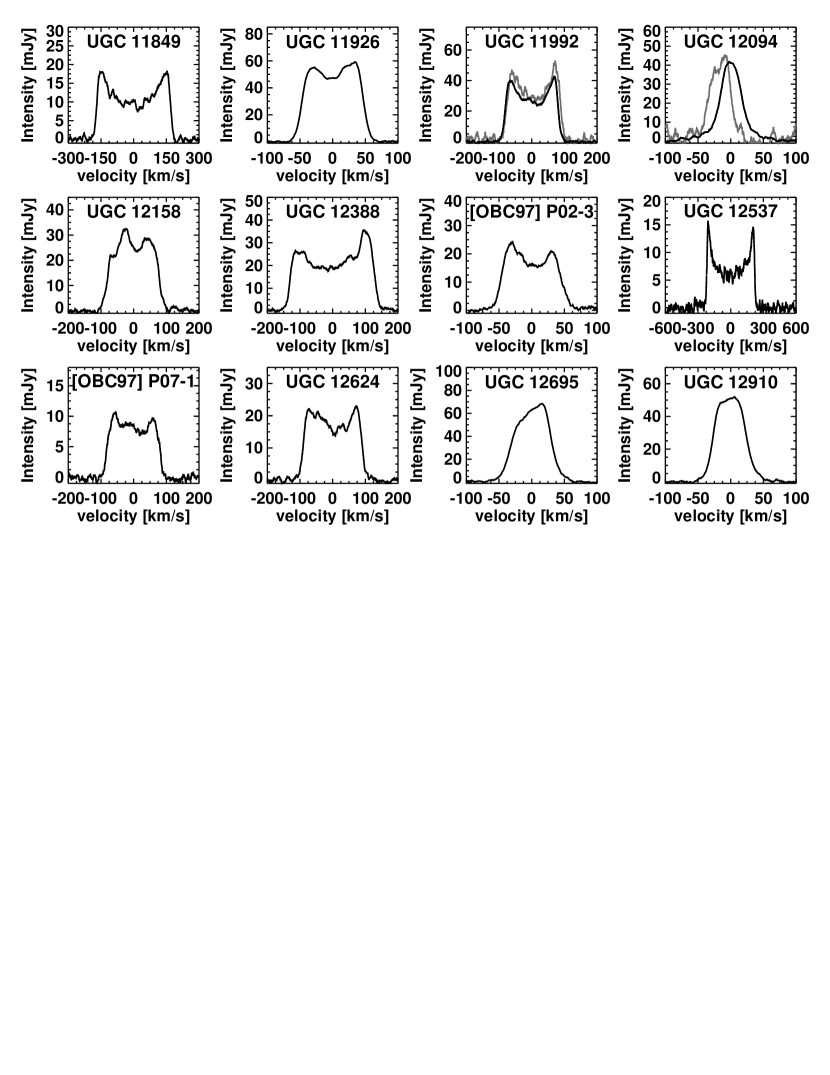
The final results and associated errors are reported in Table 1, and the 8.5 km s-1 resolution spectra are in Figure 3. (The 1.3 and 0.65 km s-1 resolution spectra are online at http://www.gb.nrao.edu/$∼$koneil/HIsurvey.) Each spectra was analyzed three times, at three different resolutions – 0.65 km s-1, 1.3 km s-1, and 8.5 km s-1, with the 8.5 km s-1 resolution data obtained through boxcar averaging the 0.65 km s-1 resolution data. The baseline fit region (described in the last section) was also used for determining the r.m.s. of the spectra. The flux was found by fitting (by eye) the outer edges of the galaxy, and all flux within the defined regions was summed. The velocity widths were determined at 20% and 50% of the mean value of the
selected region. Finally, the heliocentric velocity is equal to , where and are equal to the low and high values of the heliocentric velocity at 20% or 50% times mean value of two H i peaks.
The results from the data analysis were then combined, and errors determined, as described below. For each galaxy both the individual observations and the average of the individual observations were analyzed. The results from the averaged observations provide the most accurate measurements and are reported in Table 1. The individual measurements were used only to determine the range of values found, and are reported online at http://www.gb.nrao.edu/koneil/HIsurvey.
4.1 Heliocentric Velocity
The reported value for the heliocentric velocity comes from taking the mean value of the three heliocentric velocity measurements obtained from the averaged (high signal-to-noise) spectra. To determine the error for this value, first the r.m.s. error at each velocity resolution was determined through averaging the velocity measurements from the individual (not averaged) observations. The errors from the three velocity resolution were then added, in quadrature, to determine the final reported error.
4.2 Flux
Fluxes were determined at each velocity resolution from the averaged (high signal-to-noise) spectra of each galaxy. The r.m.s. of the averaged spectra was found through examining a minimum of 200 channels on either side of the spectral line of interest. The observational error was then determined as , where N is the number of channels (the velocity width divided by the channel width), and is the rms error calculated. The final error was determined through adding (in quadrature) the observational error and a 5% error assumed for the gain curve. (See Section 3 for a description of the gain curve error).
4.3 Velocity Widths
Velocity widths were found at both 20% and 50% of the peak flux for each velocity resolution using the averaged (high signal-to-noise) spectra of every galaxy. The error reported for the velocity widths are the r.m.s. errors from the average of the individual (not averaged) observations. On the occasion where the r.m.s. error was less than half the channel resolution, the error was set equal to half the channel resolution.


5 Signal-to-Noise vs. High Resolution
One interesting observational effect which can be studied with our observations is the trade-off between high frequency (channel) resolution and high signal-to-noise (lower resolution). The average S/N is 14, 19, and 46 and the minimum (maximum) S/N seen are 2 (89), 3 (122), and 7 (310) for the 0.65, 1.3, and 8.5 km s-1 channel-1 resolutions, respectively. The lowest S/N for all three resolutions are from the observations of CAP 0718+06 and the highest from UGC 8091. Figure 4 shows the ratio of the fluxes found in the high (0.65 km s-1) and low (8.5 km s-1) resolution plots.
We also compared the flux values obtained for the various channel resolutions, and found that other than at the very. low S/N end of the distribution, the overall flux distribution is extremely similar between the low and high resolution images. However, looking at the individual comparisons between the low and high resolution measurements it is (not surprisingly) clear that the higher the overall signal-to-noise the more consistent the flux measurements are, with the differences between the measurements being essentially zero once the S/N reaches 30.
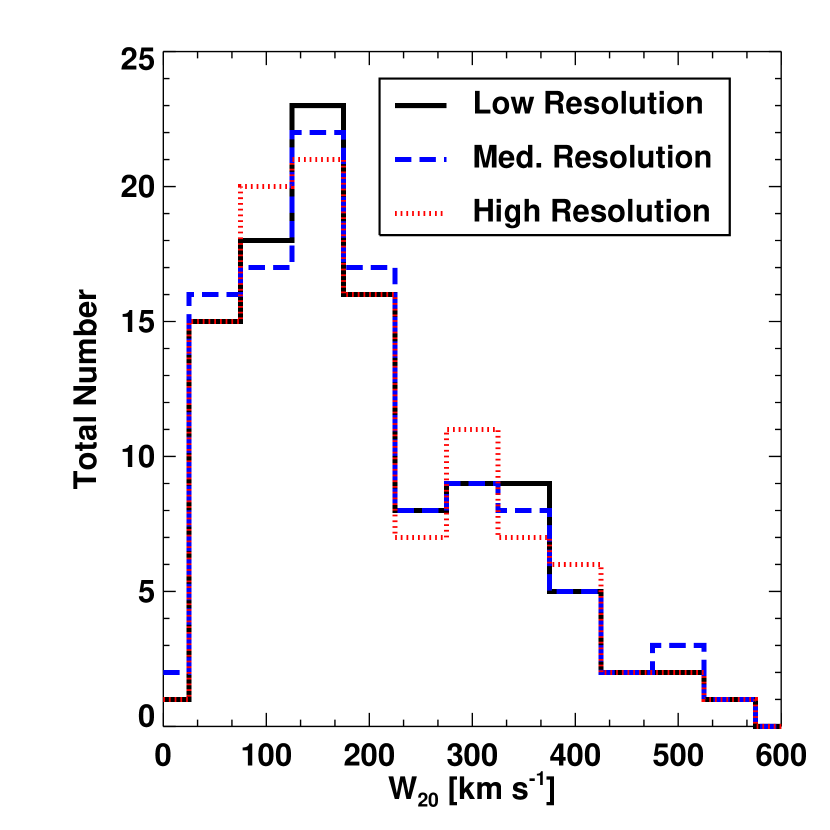
Figures 5 and 6 show a comparison between the measured (W20) velocity widths and the velocity resolution. The results match what one would naïvely believe – the higher resolution spectra provide the most accurate measurements of the velocity widths. That is, one can see that the higher resolution images have, on average, slightly narrower velocity widths than the lower resolution spectra.
5.1 Green Bank Telescope Observations
After the Arecibo observations were analyzed, the fluxes of a number of objects were found to differ significantly from the literature values of the same sources. To check the Arecibo results, we re-observed the most discrepant sources (as described in Section 6) using the Robert C. Byrd Green Bank Telescope (GBT). All GBT observations took place between 19 April – 14 May, 2004. Each galaxy was observed in two separate (linear) polarizations with a 12.5 MHz bandwidth and 32767 channels/polarization (0.08 km s-1 resolution). The data was then boxcar smoothed to 8 km s-1 resolution, to approximate the resolution of the Arecibo observations. Standard position switching techniques were used for all observations, tracking the same azimuth and zenith angle for the off-source and on-source observations to reduce any differences in baseline shapes. The on- and off-source observations were 5 minutes each with a 10 second on+off observation of a bright, calibrated, noise diode (the ‘high-cal’) to determine the system temperature.
The telescope gain was determined through observing 3-4 standard continuum calibrators each night. As the gain of the GBT at 1.4 GHz does not change significantly until one observes a source at low zenith angle (Ghiho, et.al, 2001), no sources were observed at zenith angles less than 45∘. As a result, the gain found with the continuum calibrators was applied to all sources without regard to their sky position. The variation between the calibration source measurements was between 5–10%. The calibration of the sources should not be trusted to better than this level.
Data reduction took place using the same methods (and routines) as for the Arecibo data, with the exception that second order baselines were fit to the data when necessary.
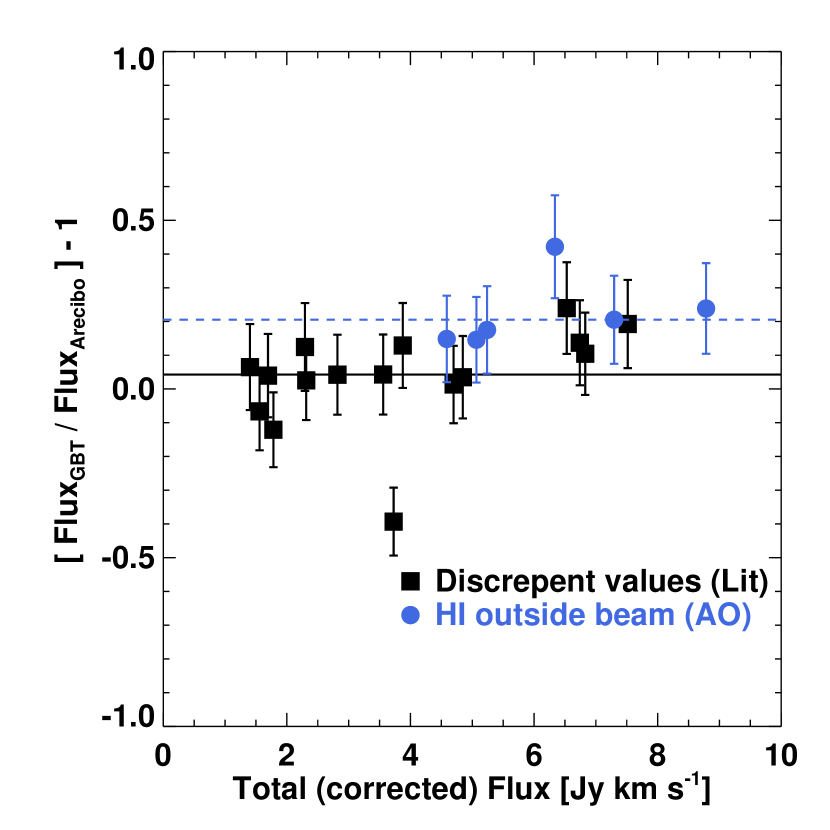
The measurements from the GBT observations are given in Table 2, the spectra are shown in Figure 3. A comparison between the GBT and Arecibo measurements is shown in Figure 7. The average offset between the GBT and Arecibo measurements of sources which do not have H i extended outside the 3.5′ Arecibo beam (the black symbols in Figure 7) is 420%, essentially zero.
6 Comparison with Literature and GBT Values
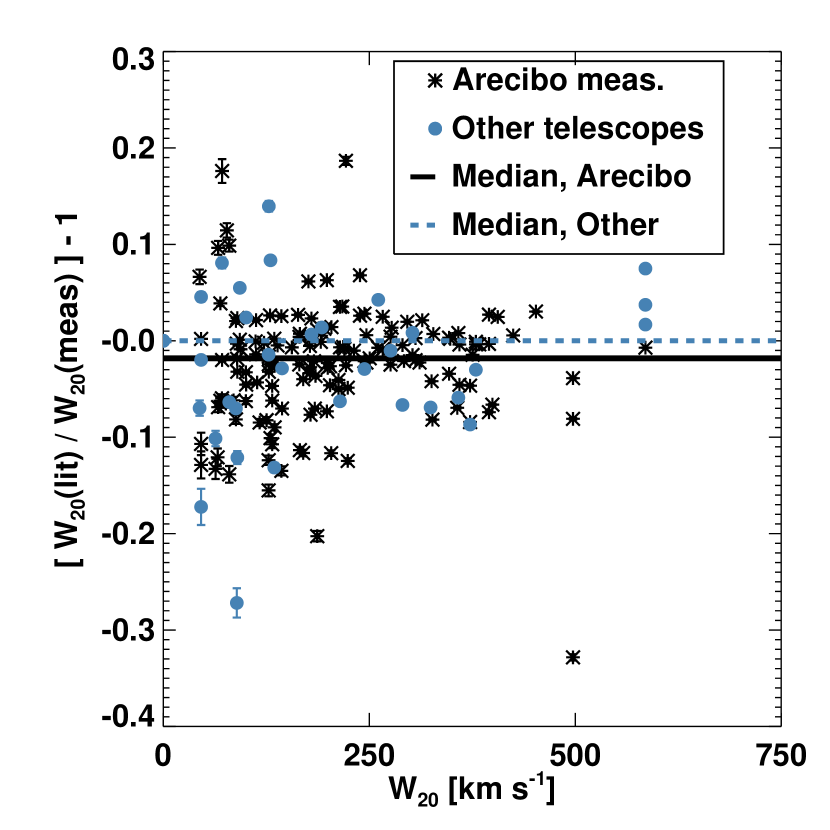
Figure 8 shows a comparison between the velocity width (W20) in our survey versus all values found in the literature (searched through NED – the NASA Extragalactic Database, and listed in Table New Reference Galaxy Standards for H i Emission Observations). Similar plots are shown in Figures 9 and 10 for the flux measurements, using the final (gain, beam, and pointing-corrected) values in the literature for the comparison. In all plots the literature values are split into two categories – measurements previously made at Arecibo, and measurements made at any other telescope. Errors for the literature value typically came directly from the published value. In the cases where no value was published, the flux error was estimated from multiplying the reported velocity width by the reported r.m.s. error. When no error was reported for the measured velocity widths, the error was estimated to be equal to half a velocity channel. Errors used are given in Table New Reference Galaxy Standards for H i Emission Observations, and a description of the comparisons is below.
6.1 Velocity Width Comparisons
For the velocity width measurement comparisons (Figure 8), the weighted average and mean of the differences between our observations and those found in the literature are zero regardless of the telescope used for the observations. This shows there are no systematic errors affecting our results. In fact, there are only 3 observations (out of a total of 186) which vary by more than 20% from the value our measured values. In each case follow-up observations taken with the GBT confirmed our Arecibo measurements. The ‘errant’ literature values are:
-
•
UGC 3118: There are two measurements of this galaxy in the literature, one of which agrees with our Arecibo and GBT measurements to within the errors, and one which does not. The ‘errant’ measurement was made by Schneider, Thuan, Mangum, & Miller (1992) with the Green Bank 300′ telescope. Schneider, et.al list their observation as potentially confused with another source, which likely explains the difference in measurements.
-
•
UGC 9007: Three values for the H i properties of UGC 9007 can be found in the literature, two which match that found by our Arecibo and GBT observations and one which does not. The value reported by Bothun et al. (1985a) is roughly 100 km s-1 larger than that found by all other observations. This, combined with the fact that the Bothun et al. W50 measurement is considerable smaller than their W20 measurement and is consistent with the other values found in the literature makes it likely that their high value for W20 is in error.
-
•
UGC 11017: There are two published values for velocity width of UGC 11017, only one of which does not match that found in our survey. This measurement, which is lower by 40 km s-1 from the the other available measurements, was taken by Richter & Huchtmeier (1991) using the Arecibo telescope. Examining their profile shows the observation to be extremely low signal-to-noise, making their measured values suspect.
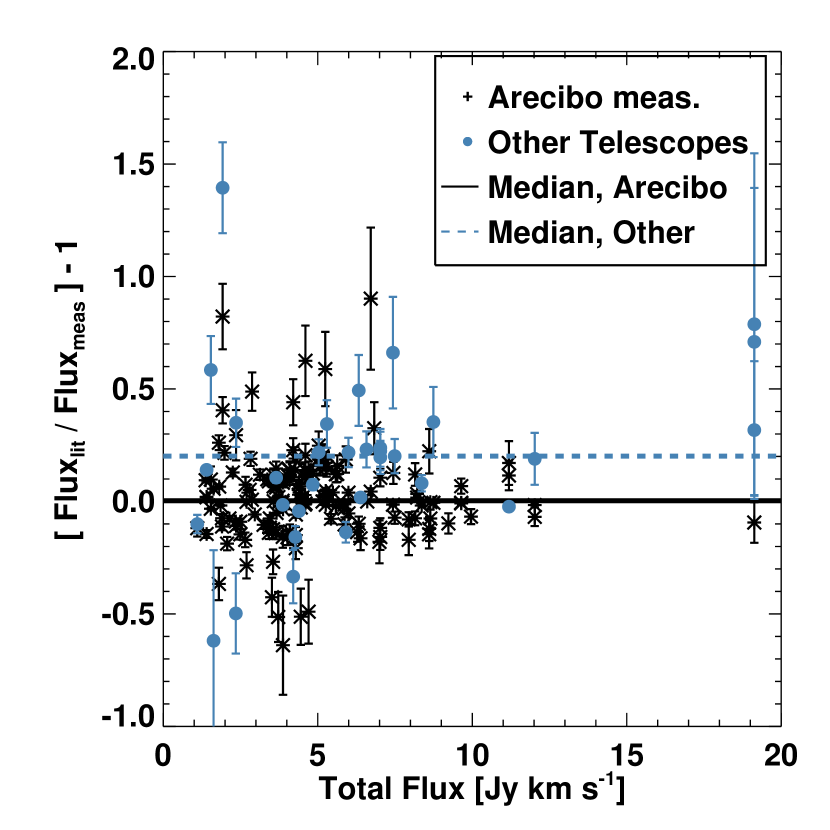
6.2 Total Flux Comparisons
For the flux measurements, the weighted average of the differences between our observations and those found in the literature (using the gain, beam, and pointing-corrected values in the literature) are zero regardless of the telescope used for the observations when comparing direct observations. However, the median difference between measurements in the literature and that found by us for non-Arecibo measurements differ by 20%, with the literature values being higher on average than our measurements (Figures 9 and 10).
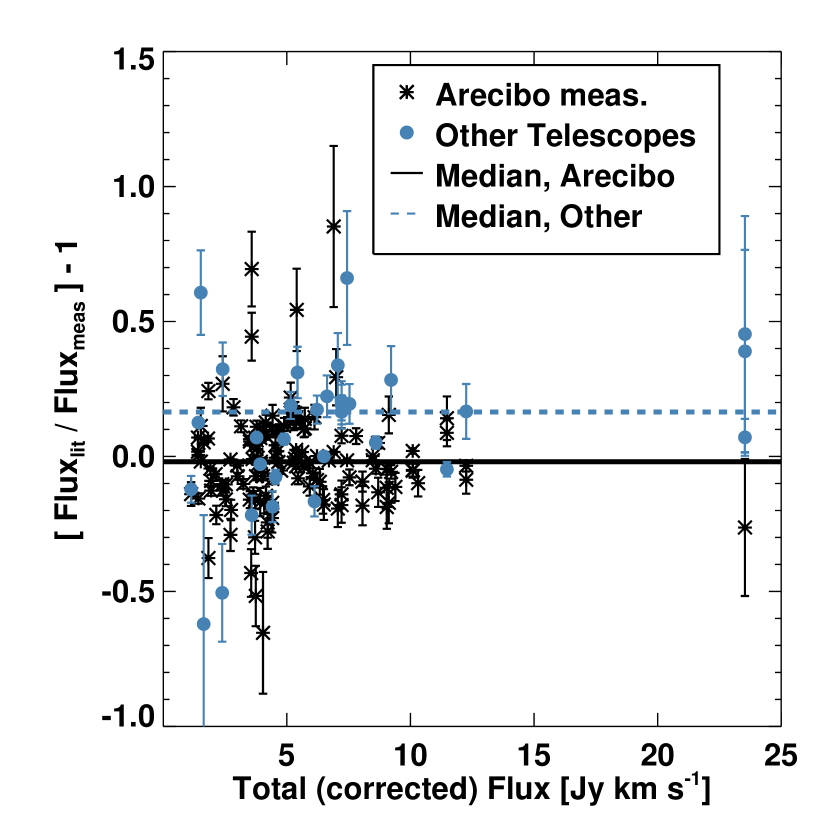
To determine if the offset between the non-Arecibo measurements is due to many of the studies galaxies having H i emission extending beyond the Arecibo beam, we applied a beam dilution correction to all of the galaxies on our study. The beam dilution correction is based on Shostak’s 1978 equation for the fraction of the total flux integral measured by a beam centered on a galaxy:
Here, with (arcmin), and (Hewitt, Haynes, Giovanelli, 1983). Additionally, the inclination is derived using the method described in Haynes & Giovanelli (1984) assuming galaxies are oblate spheroids:
where , , , , and are the spheroid’s three axiis, and is determined from the galaxy type. The result of applying this correction to the data is shown in Figure 10. Again the weighted difference between our observations with the corrected flux and those found in the literature are zero regardless of the telescope used for the observations. In this case, though, the median difference between measurements in the literature and that found by us for non-Arecibo measurements is lowered to 16%, with the literature values again being higher than our measurements (Figure 10). Consequently, while it seems likely that extended H i for some of the observed galaxies is responsible for the high differences in the median flux values between our measurements and those taken at telescopes with larger beams, the flux correction did not adequately (and possibly not accurately) correct for the extended H i.
To more thoroughly examine the flux differences found, we examined all galaxies with any published flux measurement differing from our measured value by at least 20%. Of the 26 galaxies which fall into this category, 25 were observed with the GBT. The last galaxy, UGC 12695, had VLA synthesis measurements which agree with our Arecibo observations, and no GBT follow-up was warranted. A complete listing of the 26 galaxies follows:
-
•
13 galaxies (UGC 0941, UGC 2885, UGC 3118, UGC 5160, UGC 5215, UGC 5218, UGC 6886, UGC 8503, UGC 9803, UGC 9450, UGC 11017, UGC 11627, UGC 12094) have values in the literature which vary significantly from our Arecibo measurements. In each case, follow-up observations with the GBT confirmed the Arecibo values.
-
•
7 galaxies (UGC 8091, UGC 9965, UGC 10351, UGC 10628, UGC 11461, UGC 11578, UGC 11992) have all flux values measured with a telescope with a larger beam, including our GBT measurements, to be larger than the values obtained at Arecibo (both by ourself and in the literature. As none of these galaxies have another source within 20′/1000 km s-1, it is safe to assume that these objects have H i gas which extends well beyond the Arecibo beam, and that while our observations should be repeatable with the Arecibo telescope, the measured fluxes do not accurately reflect the total H i mass of the objects.
-
•
Four other galaxies (UGC 2975, UGC 3476, UGC 4660, UGC 6464) with flux values in the literature discrepant from our Arecibo measurements were also observed with the GBT. Unfortunately, the follow-up observations did not reach a sufficient signal-to-noise to accurately determine the galaxies’ fluxes with the GBT.
The only literature values for UGC 2975 and UGC 6464 are from the pre-upgrade Arecibo telescope. The values found for UGC 6464 straddle those found with our observations, while the one value previously published for UGC 2975 is smaller than that found with our observations. In light of the extremely accurate fluxes found for all other sources in this survey, we are confident that our recent measurements of these objects are correct.
UGC 4660 and UGC 3476 have literature values from the 300’ Green Bank telescope which are larger than any Arecibo measurements taken of the galaxies. As a result, it is likely that the H i gas of these objects extends outside the Arecibo beam.
-
•
UGC 12695 has 3 single dish observations and one interferometric (VLA) observation in the literature. The two pre-upgrade Arecibo measurements are higher than that found with our observations by 23–44%, while the Nançay measurement is 33% lower than ours. However, the published VLA value agrees with ours to within a few percent, again giving confidence that our measurements are accurate.
Compiling the above results shows that of the 108 galaxies observed for this project, only 9 have H i gas which extends beyond the Arecibo beam. As a result, measurements for these objects, while repeatable with the Arecibo 305m telescope, are not accurate representations of the total amount of neutral Hydrogen within the galaxies. Each of these objects is clearly marked in Table 1.
7 Conclusion
We have created a very reliable reference catalog of H i spectral line observations. Of the 108 galaxies observed, only 9 have measured fluxes indicating significant H i gas extending beyond the Arecibo beam. As a result, our catalog currently contains the most accurate H i line measurements and spectra available for the remaining 99 galaxies. This catalog should be an extremely useful, well-defined reference catalog for anyone interested in 21-cm spectral line work.
All data and results from this survey are available online at both http://www.naic.edu/$∼$astro/HIsurvey and http://www.gb.nrao.edu/$∼$koneil/HIsurvey.
References
- Baiesi-Pillastrini & Palumbo (1986) Baiesi-Pillastrini, G. & Palumbo, G. 1986 A&A 163, 1
- Bicay & Giovanelli (1986) Bicay, M. D. & Giovanelli, R. 1986, AJ, 91, 705
- Bicay & Giovanelli (1986) Bicay, M. D. & Giovanelli, R. 1986, AJ, 91, 732
- Bothun, etal. (1986) Bothun, G. D., Beers, T. C., Mould, J. R., & Huchra, J. P. 1986, ApJ, 308, 510
- Bothun et al. (1985a) Bothun, G. D., Aaronson, M., Schommer, B., Mould, J., Huchra, J., & Sullivan, W. T. 1985a, ApJS, 57, 423
- Bothun et al. (1984) Bothun, G. D., Aaronson, M., Schommer, B., Huchra, J., & Mould, J. 1984, ApJ, 278, 475
- Davis & Seaquist (1983) Davis, L. E. & Seaquist, E. R. 1983, ApJS, 53, 269
- Fontanelli (1984) Fontanelli, P. 1984, A&A, 138, 85
- Freudling, Haynes, & Giovanelli (1988) Freudling, W., Haynes, M. P., & Giovanelli, R. 1988, AJ, 96, 1791
-
Ghiho, et.al (2001)
Ghigo, F., Maddalena, R., Balser, D., & Langston, G. 2001 Green Bank Telescope Commissioning Memo 10
Gain and Efficiency at S-Band. Available at
http://wwwlocal.gb.nrao.edu/$∼$rmaddale/GBT/
Commissioning/index.html - Ghosh & Salter (2001) Ghosh, T. & Salter, C. 2001 Arecibo Observatory Technical Memo 2001-02 http://www.naic.edu/$∼$astro/aotms/
- Giovanardi & Salpeter (1985) Giovanardi, C. & Salpeter, E. E. 1985, ApJS, 58, 623
- Giovanelli & Haynes (1993) Giovanelli, R. & Haynes, M. P. 1993, AJ, 105, 1271
- Giovanelli & Haynes (1989) Giovanelli, R. & Haynes, M. P. 1989, AJ, 97, 633
- Giovanelli, Myers, Roth, & Haynes (1986) Giovanelli, R., Myers, S. T., Roth, J., & Haynes, M. P. 1986, AJ, 92, 250
- Giovanelli & Haynes (1985) Giovanelli, R. & Haynes, M. P. 1985, ApJ, 292, 404
- Giovanelli & Haynes (1985) Giovanelli, R. & Haynes, M. P. 1985, AJ, 90, 2445
- Haynes et al. (1997) Haynes, M. P., Giovanelli, R., Herter, T., Vogt, N. P., Freudling, W., Maia, M. A. G., Salzer, J. J., & Wegner, G. 1997, AJ, 113, 1197
- Haynes & Giovanelli (1984) Haynes, M. P. & Giovanelli, R. 1984, AJ, 89, 758
- Heiles (2001) Heiles, C. 2001 Arecibo Technical and Operations Memo Series 2000-05 http://www.naic.edu/$∼$astro/aotms/
- Helou, Salpeter, & Terzian (1982) Helou, G., Salpeter, E. E., & Terzian, Y. 1982, AJ, 87, 1443
- Hewitt, Haynes, Giovanelli (1983) Hewitt, J. N., Haynes, M. P., & Giovanelli, R. 1983 AJ 88, 272
- Hoffman et al. (1989) Hoffman, G. L., Williams, B. M., Lewis, B. M., Helou, G., & Salpeter, E. E. 1989, ApJS, 69, 65
- Hoffman, Helou, Salpeter, & Sandage (1985) Hoffman, G. L., Helou, G., Salpeter, E. E., & Sandage, A. 1985, ApJ, 289, L15
- Huchtmeier & Richter (1989) Huchtmeier, W. K. & Richter, O.-G 1989 A General Catalog of HI Observations of Galaxies. The Reference Catalog, XIX, 350 pp. 8 figs.. Springer-Verlag Berlin Heidelberg New York,
- Huchtmeier & Richter (1987) Huchtmeier, W. K. & Richter, O.-G. 1987, A&AS, 64, 111
- Hunter & Gallagher (1985) Hunter, D. A. & Gallagher, J. S. 1985, AJ, 90, 1789
- Impey & Bothun (1989) Impey, C. & Bothun, G. 1989, ApJ, 341, 89
- Lewis, Helou, & Salpeter (1985) Lewis, B. M., Helou, G., & Salpeter, E. E. 1985, ApJS, 59, 161
- Lewis (1987) Lewis, B. M. 1987, ApJS, 63, 515
- Lewis (1984) Lewis, B. M. 1984, ApJ, 285, 453
- Nilson (1973) Nilson, P 1973 Uppsala General Catalogue of Galaxies Acta Universitatis Upsalienis, Nova Regiae Societatis Upsaliensis, Series
- O’Neil, Bothun, & Schombert (2000) O’Neil, K., Bothun, G. D., & Schombert, J. 2000, AJ, 119, 136
- Oosterloo & Shostak (1993) Oosterloo, T. & Shostak, S. 1993, A&AS, 99, 379
- Pantoja, Altschuler, Giovanardi, & Giovanelli (1997) Pantoja, C. A., Altschuler, D. R., Giovanardi, C., & Giovanelli, R. 1997, AJ, 113, 905
- Peterson (1979) Peterson, S. D. 1979, ApJS, 40, 527
- Richter & Huchtmeier (1991) Richter, O.-G. & Huchtmeier, W. K. 1991, A&AS, 87, 425
- Roelfsema & Allen (1985) Roelfsema, P. R. & Allen, R. J. 1985, A&A, 146, 213
- Salter (2002) Salter, C. An Astronomer’s Guide to the Arecibo 305-m Telescope http://www2.naic.edu/$∼$astro/guide/
- Schneider, Thuan, Mangum, & Miller (1992) Schneider, S. E., Thuan, T. X., Mangum, J. G., & Miller, J. 1992, ApJS, 81, 5
- Schneider, Thuan, Magri, & Wadiak (1990) Schneider, S. E., Thuan, T. X., Magri, C., & Wadiak, J. E. 1990, ApJS, 72, 245
- Schneider, Helou, Salpeter, & Terzian (1986) Schneider, S. E., Helou, G., Salpeter, E. E., & Terzian, Y. 1986, AJ, 92, 742
- Shostak (1978) Shostak, S. 1978 A&A 68, 321
- Staveley-Smith & Davies (1987) Staveley-Smith, L. & Davies, R. D. 1987, MNRAS, 224, 953
- Theureau et al. (1998) Theureau, G., Bottinelli, L., Coudreau-Durand, N., Gouguenheim, L., Hallet, N., Loulergue, M., Paturel, G., & Teerikorpi, P. 1998, A&AS, 130, 333
- Tifft (1992) Tifft, W.G. 1992 ApJS 79, 183
- Tifft & Cocke (1988) Tifft, W. G. & Cocke, W. J. 1988, ApJS, 67, 1
| 0.65 km s-1 Resolution | 1.3 km s-1 Resolution | 8.5 km s-1 Resolution | ||||||||||
|---|---|---|---|---|---|---|---|---|---|---|---|---|
| Name | RA | Dec | VHEL | Flux | W20 | W50 | Flux | W20 | W50 | Flux | W20 | W50 |
| J2000 | [km s-1] | [Jy km s-1] | [km s-1] | [km s-1] | [Jy km s-1] | [km s-1] | [km s-1] | [Jy km s-1] | [km s-1] | [km s-1] | ||
| UGC 199 | 00:20:51.7 | 12:51:22.0 | 1800 (3) | 3.6 (0.2) | 117 (7) | 111 (3) | 3.7 (0.2) | 122 (4) | 112 (3) | 3.6 (0.2) | 122 (4) | 112 (4) |
| NGC 0257 | 00:48:01.6 | 08:17:48.0 | 5274 (2) | 9.9 (0.5) | 408 (11) | 404 (1) | 9.9 (0.5) | 422 (10) | 404 (3) | 9.9 (0.5) | 415 (4) | 406 (4) |
| UGC 317 | 00:31:43.2 | 00:54:03.0 | 5361 (1) | 1.1 (0.1) | 37 (6) | 33 (4) | 1.1 (0.1) | 44 (2) | 35 (2) | 1.1 (0.1) | 44 (5) | 38 (4) |
| UGC 628 | 01:00:51.9 | 19:28:33.0 | 5446 (5) | 4.4 (0.2) | 241 (4) | 232 (5) | 4.4 (0.2) | 243 (7) | 234 (3) | 4.4 (0.2) | 244 (4) | 234 (4) |
| UGC 941 | 01:23:32.4 | 06:57:38.0 | 2729 (4) | 3.6 (0.2) | 87 (8) | 85 (7) | 3.6 (0.2) | 104 (4) | 80 (3) | 3.6 (0.2) | 89 (4) | 82 (4) |
| UGC 989 | 01:25:29.6 | 07:33:41.0 | 2785 (2) | 5.4 (0.3) | 161 (11) | 153 (4) | 5.4 (0.3) | 164 (5) | 154 (3) | 5.4 (0.3) | 165 (4) | 154 (4) |
| UGC 1085 | 01:31:18.8 | 07:47:16.0 | 651 (3) | 2.1 (0.1) | 60 (7) | 55 (2) | 2.1 (0.1) | 74 (5) | 56 (6) | 2.1 (0.1) | 65 (4) | 60 (4) |
| UGC 1246 | 01:47:00.7 | 12:24:21.0 | 803 (1) | 8.6 (0.4) | 113 (3) | 99 (2) | 8.7 (0.4) | 117 (2) | 100 (1) | 8.6 (0.4) | 113 (4) | 103 (4) |
| UGC 1519 | 02:02:16.8 | 19:10:48.0 | 2346 (3) | 2.5 (0.1) | 129 (3) | 121 (4) | 2.4 (0.1) | 135 (2) | 122 (4) | 2.5 (0.1) | 135 (4) | 125 (4) |
| UGC 2008 | 02:32:32.2 | 31:36:35.0 | 5043 (4) | 2.7 (0.1) | 139 (8) | 128 (8) | 2.7 (0.1) | 150 (9) | 130 (4) | 2.7 (0.1) | 143 (4) | 133 (4) |
| UGC 2339 | 02:51:23.6 | 16:02:30.0 | 16467 (11) | 4.5 (0.2) | 497 (3) | 469 (3) | 4.5 (0.2) | 500 (16) | 472 (17) | 4.5 (0.2) | 497 (7) | 475 (7) |
| UGC 2432 | 02:57:26.7 | 10:08:12.0 | 758 (1) | 5.9 (0.3) | 114 (1) | 105 (0) | 5.9 (0.3) | 115 (1) | 104 (1) | 5.9 (0.3) | 116 (4) | 105 (4) |
| AC HVC | -753 (1) | … | … | … | 0.7 (0.1) | 42 (1) | 36 (2) | … | … | … | ||
| UGC 2602 | 03:14:10.1 | 16:29:08.0 | 10092 (8) | 6.0 (0.3) | 302 (17) | 290 (11) | 5.9 (0.3) | 307 (16) | 290 (4) | 5.9 (0.3) | 302 (7) | 290 (4) |
| UGC 2809 | 03:39:33.2 | 19:47:03.0 | 1287 (1) | 9.9 (0.5) | 154 (2) | 144 (1) | 9.9 (0.5) | 156 (2) | 144 (1) | 9.9 (0.5) | 156 (4) | 146 (4) |
| UGC 2885 | 03:53:02.4 | 35:35:22.0 | 5803 (7) | 19.2 (1.0) | 580 (4) | 567 (8) | 19.0 (1.0) | 591 (7) | 567 (3) | 19.2 (1.0) | 585 (4) | 572 (4) |
| UGC 2905 | 03:57:00.1 | 16:31:21.0 | 295 (1) | 4.1 (0.2) | 75 (7) | 65 (3) | 4.0 (0.2) | 82 (1) | 68 (1) | 4.1 (0.2) | 75 (4) | 68 (4) |
| UGC 2922 | 04:00:46.0 | 17:35:00.0 | 5220 (2) | 4.6 (0.2) | 369 (4) | 364 (7) | 4.7 (0.2) | 380 (7) | 361 (3) | 4.6 (0.2) | 375 (5) | 364 (5) |
| UGC 2975 | 04:11:00.4 | 26:36:46.0 | 19945 (17) | 2.0 (0.1) | 316 (10) | 282 (2) | 2.0 (0.1) | 327 (3) | 284 (2) | 2.0 (0.1) | 325 (11) | 285 (16) |
| UGC 3044 | 04:26:50.0 | 29:56:52.0 | 5231 (7) | 2.7 (0.1) | 248 (8) | 240 (10) | 2.6 (0.1) | 254 (6) | 240 (6) | 2.7 (0.1) | 250 (5) | 240 (4) |
| UGC 3118 | 04:38:59.0 | 05:37:11.0 | 8314 (5) | 1.6 (0.1) | 78 (4) | 74 (1) | 1.6 (0.1) | 99 (7) | 75 (1) | 1.6 (0.1) | 89 (11) | 75 (4) |
| UGC 3169 | 04:47:45.0 | 09:35:43.0 | 8800 (8) | 3.0 (0.2) | 378 (0) | 382 (0) | 3.0 (0.2) | 400 (1) | 370 (1) | 2.9 (0.1) | 399 (4) | 374 (4) |
| UGC 3247 | 05:06:38.0 | 08:40:27.0 | 3365 (7) | 5.2 (0.3) | 220 (0) | 208 (0) | 5.1 (0.3) | 239 (1) | 177 (1) | 5.2 (0.3) | 223 (4) | 209 (4) |
| UGC 3296 | 05:21:21.8 | 04:53:16.0 | 4267 (3) | 8.6 (0.4) | 342 (0) | 332 (0) | 8.8 (0.4) | 361 (1) | 335 (1) | 8.6 (0.4) | 346 (4) | 333 (4) |
| UGC 3330 | 05:36:46.9 | 14:25:21.0 | 5238 (3) | 4.6 (0.2) | 211 (11) | 189 (18) | 4.5 (0.2) | 216 (7) | 185 (11) | 4.6 (0.2) | 212 (7) | 188 (4) |
| UGC 3476† | 06:30:29.2 | 33:18:07.0 | 472 (5) | 7.4 (0.4) | 128 (13) | 104 (8) | 7.3 (0.4) | 150 (3) | 106 (5) | 7.4 (0.4) | 130 (4) | 119 (4) |
| UGC 3564 | 06:50:36.2 | 16:21:20.0 | 2546 (0) | 5.6 (0.3) | 97 (0) | 86 (1) | 5.6 (0.3) | 103 (1) | 90 (1) | 5.6 (0.3) | 100 (4) | 91 (4) |
| UGC 3582 | 06:53:00.3 | 12:11:17.0 | 8392 (10) | 2.8 (0.1) | 177 (28) | 165 (23) | 2.8 (0.1) | 189 (18) | 164 (2) | 2.8 (0.1) | 183 (11) | 166 (4) |
| UGC 3621 | 06:59:04.4 | 14:17:42.0 | 2335 (2) | 9.6 (0.5) | 176 (1) | 165 (2) | 9.6 (0.5) | 177 (3) | 164 (1) | 9.6 (0.5) | 177 (4) | 166 (4) |
| UGC 3755 | 07:13:51.5 | 10:31:19.0 | 318 (4) | 8.2 (0.4) | 67 (7) | 77 (6) | 8.1 (0.4) | 111 (3) | 79 (5) | 8.2 (0.4) | 71 (4) | 80 (4) |
| UGC 3767 | 07:14:47.7 | 06:46:50.0 | 5807 (4) | 4.0 (0.2) | 261 (4) | 254 (3) | 4.0 (0.2) | 264 (10) | 254 (6) | 4.0 (0.2) | 266 (4) | 257 (4) |
| CAP 0718+06 | 07:21:00.2 | 06:18:19.0 | 11140 (6) | 1.4 (0.1) | 207 (10) | 207 (11) | 1.4 (0.1) | 209 (11) | 192 (11) | 1.4 (0.1) | 211 (16) | 195 (8) |
| UGC 3946 | 07:37:59.7 | 03:18:58.0 | 1198 (6) | 12.0 (0.6) | 123 (13) | 112 (4) | 12.1 (0.6) | 143 (9) | 114 (1) | 12.0 (0.6) | 127 (4) | 113 (4) |
| UGC 4117 | 07:57:26.0 | 35:56:21.0 | 773 (1) | 4.1 (0.2) | 80 (5) | 73 (2) | 4.1 (0.2) | 88 (1) | 76 (1) | 4.1 (0.2) | 85 (4) | 76 (4) |
| UGC 4131 | 07:59:11.6 | 31:48:28.0 | 17728 (24) | 3.4 (0.2) | 464 (14) | 448 (19) | 3.4 (0.2) | 467 (32) | 451 (25) | 3.4 (0.2) | 466 (16) | 448 (25) |
| UGC 4180 | 08:02:36.5 | 27:26:15.0 | 5229 (2) | 5.3 (0.3) | 354 (2) | 347 (9) | 5.2 (0.3) | 356 (4) | 348 (5) | 5.3 (0.3) | 359 (4) | 350 (4) |
| UGC 4385 | 08:23:52.0 | 14:45:07.0 | 1967 (5) | 6.6 (0.3) | 185 (7) | 168 (2) | 6.6 (0.3) | 190 (9) | 169 (5) | 6.6 (0.3) | 188 (4) | 170 (4) |
| LSBC F704-V01 | 08:24:51.7 | 09:13:29.0 | 6018 (5) | 2.0 (0.1) | 135 (10) | 130 (13) | 2.0 (0.1) | 141 (5) | 131 (5) | 2.0 (0.1) | 139 (4) | 132 (4) |
| UGC 4660† | 08:54:24.2 | 34:33:20.0 | 2202 (2) | 6.0 (0.3) | 77 (4) | 69 (2) | 6.0 (0.3) | 80 (2) | 69 (1) | 6.0 (0.3) | 80 (4) | 73 (4) |
| UGC 4780 | 09:06:39.4 | 19:20:10.0 | 3287 (6) | 8.1 (0.4) | 164 (15) | 139 (5) | 8.2 (0.4) | 169 (2) | 140 (1) | 8.1 (0.4) | 165 (4) | 142 (4) |
| UGC 4955 | 09:20:19.3 | 25:16:25.0 | 6463 (4) | 2.1 (0.1) | 209 (0) | 202 (0) | 2.1 (0.1) | 214 (1) | 206 (1) | 2.1 (0.1) | 217 (4) | 207 (4) |
| UGC 5030 | 09:26:36.2 | 07:57:15.0 | 2153 (2) | 3.4 (0.2) | 300 (3) | 295 (7) | 3.3 (0.2) | 305 (12) | 295 (11) | 3.4 (0.2) | 306 (8) | 297 (4) |
| UGC 5160 | 09:40:41.7 | 11:53:18.0 | 6660 (13) | 2.9 (0.1) | 399 (21) | 398 (25) | 2.8 (0.1) | 402 (25) | 390 (24) | 2.9 (0.1) | 405 (19) | 397 (8) |
| UGC 5215 | 09:45:14.3 | 09:06:35.0 | 5485 (1) | 6.8 (0.3) | 420 (0) | 418 (0) | 6.8 (0.3) | 425 (1) | 416 (1) | 6.8 (0.3) | 424 (4) | 417 (4) |
| UGC 5218 | 09:45:30.2 | 06:22:37.0 | 3088 (1) | 6.7 (0.3) | 195 (4) | 185 (2) | 6.7 (0.3) | 200 (1) | 186 (1) | 6.7 (0.3) | 199 (4) | 188 (4) |
| UGC 5326 | 09:55:24.6 | 33:15:45.0 | 1412 (8) | 4.3 (0.2) | 131 (6) | 112 (6) | 4.3 (0.2) | 128 (8) | 111 (4) | 4.3 (0.2) | 132 (11) | 115 (4) |
| UGC 5358 | 09:58:47.2 | 11:23:19.0 | 2914 (1) | 4.4 (0.2) | 216 (0) | 203 (0) | 4.5 (0.2) | 222 (1) | 204 (1) | 4.4 (0.2) | 218 (4) | 207 (4) |
| UGC 5440 | 10:05:35.9 | 04:16:45.0 | 18958 (14) | 3.0 (0.2) | 537 (34) | 537 (35) | 3.1 (0.2) | 513 (19) | 484 (20) | 2.9 (0.1) | 508 (13) | 498 (13) |
| UGC 5629 | 10:24:12.8 | 21:03:01.0 | 1238 (1) | 2.9 (0.1) | 126 (4) | 116 (4) | 2.8 (0.1) | 129 (3) | 116 (4) | 2.9 (0.1) | 129 (4) | 118 (4) |
| UGC 5651 | 10:26:25.6 | 17:30:38.0 | 5567 (2) | 5.3 (0.3) | 224 (10) | 218 (1) | 5.2 (0.3) | 234 (4) | 219 (1) | 5.2 (0.3) | 231 (4) | 221 (4) |
| UGC 5852 | 10:44:12.1 | 06:45:33.0 | 6174 (4) | 11.2 (0.6) | 380 (23) | 362 (4) | 11.2 (0.6) | 385 (8) | 363 (4) | 11.2 (0.6) | 379 (7) | 364 (4) |
| UGC 6018 | 10:54:05.8 | 20:38:41.0 | 1294 (2) | 1.9 (0.1) | 61 (11) | 57 (6) | 1.9 (0.1) | 70 (17) | 57 (3) | 1.9 (0.1) | 69 (5) | 61 (4) |
| UGC 6421 | 11:24:25.7 | 27:27:23.0 | 1502 (1) | 7.9 (0.4) | 175 (2) | 169 (0) | 8.0 (0.4) | 181 (5) | 170 (1) | 7.9 (0.4) | 178 (4) | 171 (4) |
| UGC 6464 | 11:28:09.3 | 16:55:14.0 | 1075 (5) | 3.5 (0.2) | 154 (1) | 141 (8) | 3.4 (0.2) | 168 (5) | 144 (10) | 3.6 (0.2) | 169 (8) | 148 (4) |
| UGC 6476 | 11:28:36.0 | 23:24:15.0 | 7328 (9) | 3.7 (0.2) | 321 (4) | 319 (1) | 3.6 (0.2) | 328 (1) | 319 (5) | 3.7 (0.2) | 326 (4) | 319 (5) |
| U01-4 | 11:38:25.7 | 17:05:03.0 | 3452 (3) | 1.8 (0.1) | 197 (0) | 177 (3) | 1.8 (0.1) | 192 (7) | 176 (10) | 1.8 (0.1) | 191 (4) | 182 (4) |
| UGC 6872 | 11:53:50.9 | 33:21:55.0 | 3203 (5) | 5.7 (0.3) | 216 (6) | 198 (30) | 5.7 (0.3) | 220 (11) | 198 (11) | 5.6 (0.3) | 221 (29) | 201 (7) |
| UGC 6886 | 11:55:11.3 | 06:10:09.0 | 6973 (20) | 4.6 (0.2) | 384 (11) | 383 (22) | 4.6 (0.2) | 404 (50) | 377 (1) | 4.6 (0.2) | 395 (7) | 383 (7) |
| UGC 7302 | 12:16:49.4 | 30:16:13.0 | 3838 (2) | 3.9 (0.2) | 91 (6) | 82 (1) | 3.9 (0.2) | 95 (5) | 83 (1) | 3.9 (0.2) | 93 (4) | 84 (4) |
| UGC 7666 | 12:31:37.7 | 14:51:38.0 | 2556 (10) | 2.2 (0.1) | 129 (18) | 111 (2) | 2.3 (0.1) | 151 (14) | 116 (7) | 2.2 (0.1) | 138 (8) | 117 (4) |
| Malin 1 | 12:36:59.2 | 14:19:50.0 | 24768 (17) | 2.1 (0.1) | 417 (16) | 396 (14) | 2.1 (0.1) | 514 (10) | 331 (8) | 2.1 (0.1) | 372 (7) | 332 (5) |
| UGC 7976 | 12:49:15.8 | 04:39:27.0 | 2666 (1) | 6.4 (0.3) | 92 (11) | 80 (1) | 6.4 (0.3) | 94 (1) | 81 (1) | 6.4 (0.3) | 92 (4) | 82 (4) |
| UGC 8091‡ | 12:58:40.0 | 14:13:00.0 | 213 (0) | 7.0 (0.4) | 44 (2) | 44 (1) | 7.0 (0.4) | 55 (2) | 44 (2) | 7.0 (0.4) | 45 (4) | 45 (4) |
| UGC 8249 | 13:10:26.5 | 24:55:15.0 | 2541 (1) | 7.5 (0.4) | 187 (14) | 178 (2) | 7.4 (0.4) | 189 (5) | 179 (2) | 7.5 (0.4) | 192 (4) | 181 (4) |
| UGC 8503 | 13:30:44.9 | 32:45:38.0 | 4676 (4) | 3.7 (0.2) | 72 (6) | 65 (2) | 3.7 (0.2) | 83 (8) | 69 (2) | 3.7 (0.2) | 75 (5) | 71 (4) |
| UGC 8516 | 13:31:52.5 | 20:00:01.0 | 1020 (3) | 3.6 (0.2) | 125 (11) | 114 (2) | 3.7 (0.2) | 126 (12) | 115 (2) | 3.7 (0.2) | 128 (4) | 115 (4) |
| UGC 8896 | 13:58:38.5 | 07:12:58.0 | 4401 (9) | 5.1 (0.3) | 303 (18) | 291 (20) | 5.1 (0.3) | 312 (21) | 298 (16) | 5.1 (0.3) | 311 (4) | 298 (4) |
| UGC 8904 | 13:58:51.0 | 26:06:24.0 | 9773 (3) | 3.5 (0.2) | 300 (0) | 285 (0) | 3.6 (0.2) | 296 (1) | 272 (1) | 3.6 (0.2) | 290 (4) | 278 (4) |
| UGC 9007 | 14:05:06.0 | 09:20:21.0 | 4618 (4) | 1.4 (0.1) | 59 (6) | 54 (4) | 1.4 (0.1) | 66 (7) | 56 (1) | 1.4 (0.1) | 63 (4) | 57 (4) |
| UGC 9134 | 14:16:35.2 | 09:59:09.0 | 11158 (19) | 4.1 (0.2) | 350 (30) | 334 (28) | 4.0 (0.2) | 359 (25) | 339 (12) | 4.0 (0.2) | 356 (21) | 337 (4) |
| UGC 9450 | 14:39:45.4 | 23:23:50.0 | 4471 (9) | 2.4 (0.1) | 221 (13) | 205 (13) | 2.4 (0.1) | 223 (13) | 209 (10) | 2.4 (0.1) | 214 (5) | 207 (4) |
| UGC 9535 | 14:48:42.5 | 12:27:25.0 | 1792 (1) | 8.6 (0.4) | 200 (5) | 192 (1) | 8.7 (0.4) | 205 (1) | 192 (1) | 8.7 (0.4) | 202 (4) | 194 (4) |
| UGC 9698 | 15:05:27.2 | 23:41:18.0 | 4853 (6) | 2.7 (0.1) | 198 (21) | 172 (10) | 2.6 (0.1) | 207 (19) | 173 (20) | 2.7 (0.1) | 203 (9) | 177 (4) |
| UGC 9803 | 15:17:17.8 | 29:24:00.0 | 5257 (2) | 1.5 (0.1) | 82 (1) | 72 (2) | 1.5 (0.1) | 80 (7) | 70 (5) | 1.6 (0.1) | 88 (7) | 73 (4) |
| UGC 9901 | 15:34:27.0 | 12:16:12.0 | 3160 (1) | 5.9 (0.3) | 246 (3) | 237 (2) | 5.9 (0.3) | 247 (3) | 234 (3) | 5.9 (0.3) | 246 (4) | 236 (4) |
| UGC 9965‡ | 15:40:06.6 | 20:40:50.0 | 4524 (11) | 4.7 (0.2) | 133 (20) | 113 (31) | 4.8 (0.2) | 153 (21) | 114 (36) | 4.7 (0.2) | 125 (14) | 118 (4) |
| UGC 9979 | 15:42:19.3 | 00:28:31.0 | 1961 (3) | 4.8 (0.2) | 137 (4) | 126 (1) | 4.8 (0.2) | 144 (7) | 132 (3) | 4.8 (0.2) | 144 (4) | 129 (4) |
| UGC 10042 | 15:48:57.2 | 07:13:18.0 | 4224 (5) | 4.6 (0.2) | 342 (5) | 335 (12) | 4.6 (0.2) | 350 (12) | 336 (1) | 4.6 (0.2) | 348 (4) | 340 (4) |
| UGC 10243 | 16:10:29.6 | 19:57:15.0 | 7937 (2) | 4.6 (0.2) | 165 (5) | 146 (6) | 4.5 (0.2) | 162 (5) | 146 (5) | 4.6 (0.2) | 165 (4) | 147 (6) |
| UGC 10351‡ | 16:21:28.2 | 28:38:25.0 | 891 (1) | 6.3 (0.3) | 70 (2) | 66 (0) | 6.4 (0.3) | 79 (1) | 65 (1) | 6.3 (0.3) | 71 (4) | 67 (4) |
| UGC 10384 | 16:26:46.7 | 11:34:49.0 | 4966 (5) | 7.0 (0.4) | 384 (9) | 370 (3) | 7.0 (0.4) | 386 (22) | 373 (3) | 7.0 (0.3) | 383 (6) | 371 (4) |
| UGC 10628‡ | 16:58:08.6 | 22:59:06.0 | 2980 (2) | 5.0 (0.3) | 259 (1) | 250 (3) | 5.1 (0.3) | 261 (7) | 247 (1) | 5.0 (0.3) | 260 (4) | 252 (4) |
| UGC 10721 | 17:08:25.5 | 25:31:02.0 | 2920 (5) | 5.3 (0.3) | 286 (11) | 273 (12) | 5.3 (0.3) | 298 (17) | 276 (8) | 5.3 (0.3) | 292 (4) | 279 (4) |
| UGC 10747 | 17:11:59.7 | 23:22:48.0 | 8821 (4) | 3.3 (0.2) | 317 (0) | 317 (0) | 3.3 (0.2) | 340 (1) | 313 (1) | 3.3 (0.2) | 327 (4) | 322 (4) |
| UGC 10901 | 17:33:54.0 | 05:28:34.0 | 2834 (1) | 9.2 (0.5) | 190 (0) | 184 (0) | 9.2 (0.5) | 193 (1) | 185 (1) | 9.2 (0.5) | 195 (4) | 186 (4) |
| UGC 11017 | 17:52:08.6 | 29:51:41.0 | 4644 (0) | 3.9 (0.2) | 183 (0) | 167 (0) | 3.9 (0.2) | 187 (1) | 173 (1) | 3.9 (0.2) | 186 (4) | 174 (4) |
| UGC 11120 | 18:07:02.2 | 20:29:17.0 | 2242 (6) | 3.6 (0.2) | 179 (0) | 169 (10) | 3.6 (0.2) | 178 (13) | 167 (2) | 3.6 (0.2) | 182 (4) | 170 (4) |
| UGC 11285 | 18:35:14.3 | 22:29:58.0 | 4501 (4) | 5.3 (0.3) | 306 (6) | 300 (8) | 5.4 (0.3) | 315 (9) | 303 (4) | 5.3 (0.3) | 314 (13) | 304 (4) |
| UGC 11362 | 18:49:56.0 | 23:15:16.0 | 4205 (2) | 3.7 (0.2) | 197 (20) | 191 (11) | 3.7 (0.2) | 207 (14) | 192 (1) | 3.7 (0.2) | 204 (11) | 194 (4) |
| UGC 11461‡ | 19:39:09.1 | 08:48:37.0 | 3122 (4) | 6.6 (0.3) | 322 (37) | 298 (37) | 6.6 (0.3) | 326 (10) | 299 (8) | 6.6 (0.3) | 324 (8) | 302 (4) |
| UGC 11482 | 19:49:20.1 | 07:09:35.0 | 3160 (3) | 8.3 (0.4) | 289 (4) | 280 (8) | 8.4 (0.4) | 293 (7) | 278 (1) | 8.3 (0.4) | 290 (4) | 281 (4) |
| UGC 11504 | 20:02:25.2 | 07:46:33.0 | 5620 (2) | 3.1 (0.2) | 150 (6) | 138 (5) | 3.1 (0.2) | 160 (7) | 142 (5) | 3.2 (0.2) | 163 (7) | 147 (4) |
| UGC 11578‡ | 20:30:42.7 | 09:11:25.0 | 4601 (1) | 8.7 (0.4) | 99 (1) | 88 (1) | 8.7 (0.4) | 104 (2) | 88 (1) | 8.7 (0.4) | 100 (4) | 90 (4) |
| UGC 11624 | 20:46:15.8 | 06:42:43.0 | 4831 (2) | 3.2 (0.2) | 218 (7) | 209 (8) | 3.2 (0.2) | 219 (4) | 206 (1) | 3.2 (0.2) | 219 (4) | 210 (4) |
| UGC 11627 | 20:46:48.9 | 05:38:47.0 | 4864 (2) | 2.3 (0.1) | 126 (9) | 118 (6) | 2.3 (0.1) | 132 (10) | 117 (7) | 2.3 (0.1) | 134 (4) | 119 (4) |
| UGC 11655 | 20:57:49.4 | 25:38:15.0 | 4754 (4) | 3.8 (0.2) | 266 (6) | 259 (9) | 3.8 (0.2) | 274 (10) | 262 (7) | 3.8 (0.2) | 275 (4) | 264 (4) |
| UGC 11708 | 21:14:56.0 | 02:50:05.0 | 4164 (2) | 7.5 (0.4) | 292 (4) | 282 (7) | 7.4 (0.4) | 301 (4) | 283 (2) | 7.5 (0.4) | 296 (4) | 285 (4) |
| UGC 11774 | 21:36:10.6 | 17:03:40.0 | 6875 (5) | 3.7 (0.2) | 235 (11) | 232 (10) | 3.7 (0.2) | 241 (9) | 232 (1) | 3.6 (0.2) | 238 (4) | 231 (4) |
| UGC 11849 | 21:55:40.2 | 24:53:51.0 | 5840 (3) | 4.3 (0.2) | 357 (15) | 347 (12) | 4.3 (0.2) | 359 (9) | 348 (5) | 4.3 (0.2) | 358 (7) | 349 (4) |
| UGC 11926 | 22:09:31.1 | 18:40:54.0 | 1652 (1) | 5.2 (0.3) | 110 (3) | 100 (1) | 5.2 (0.3) | 111 (4) | 100 (1) | 5.2 (0.3) | 112 (4) | 102 (4) |
| UGC 11992‡ | 22:20:47.4 | 14:14:05.0 | 3592 (1) | 5.3 (0.3) | 174 (8) | 169 (2) | 5.3 (0.3) | 178 (1) | 169 (2) | 5.3 (0.3) | 179 (4) | 171 (4) |
| UGC 12094 | 22:34:46.0 | 22:33:48.0 | 7607 (9) | 1.8 (0.1) | 59 (16) | 59 (32) | 1.7 (0.1) | 86 (13) | 55 (4) | 1.8 (0.1) | 66 (16) | 71 (4) |
| UGC 12158 | 22:42:10.5 | 19:59:49.0 | 9289 (5) | 4.3 (0.2) | 178 (7) | 160 (7) | 4.3 (0.2) | 187 (6) | 164 (4) | 4.3 (0.2) | 184 (4) | 164 (4) |
| UGC 12388 | 23:08:30.2 | 12:49:49.0 | 4584 (3) | 6.3 (0.3) | 272 (14) | 266 (12) | 6.2 (0.3) | 281 (10) | 266 (3) | 6.3 (0.3) | 277 (6) | 269 (4) |
| P02-3 | 23:16:59.0 | 07:52:19.0 | 3178 (3) | 1.9 (0.1) | 109 (5) | 103 (7) | 1.8 (0.1) | 108 (5) | 99 (2) | 1.9 (0.1) | 112 (6) | 103 (4) |
| UGC 12537 | 23:21:07.9 | 29:32:58.0 | 6112 (6) | 3.6 (0.2) | 445 (16) | 445 (12) | 3.5 (0.2) | 452 (19) | 448 (11) | 3.6 (0.2) | 452 (5) | 448 (4) |
| P07-1 | 23:22:58.5 | 07:40:20.0 | 3472 (6) | 1.4 (0.1) | 171 (20) | 162 (24) | 1.4 (0.1) | 171 (10) | 165 (6) | 1.4 (0.1) | 176 (6) | 168 (6) |
| UGC 12624 | 23:29:07.6 | 21:33:51.0 | 3516 (2) | 3.5 (0.2) | 194 (1) | 183 (3) | 3.5 (0.2) | 201 (4) | 186 (2) | 3.5 (0.2) | 198 (7) | 187 (4) |
| UGC 12695 | 23:36:02.2 | 12:52:32.0 | 6185 (2) | 4.2 (0.2) | 85 (8) | 78 (4) | 4.2 (0.2) | 95 (11) | 78 (4) | 4.2 (0.2) | 89 (5) | 80 (4) |
| UGC 12910 | 00:01:28.3 | 05:23:22.0 | 3948 (4) | 2.8 (0.1) | 74 (9) | 63 (3) | 2.8 (0.1) | 83 (4) | 66 (4) | 2.8 (0.1) | 77 (4) | 67 (4) |
Note. — †This galaxy may have H i extending beyond the Arecibo beam, resulting in the flux measurements reported here being too low. No GBT follow-up results are availale. See Section 6.2 for more details.
‡This galaxy has H i extending beyond the Arecibo beam, resulting in the flux measurements reported here being too low. The results from the GBT observations (Table 2) are more reliable. See Section 6.2 for more details.
| Name | VHEL | Flux | rms | W20 | W50 |
|---|---|---|---|---|---|
| [km s-1] | [Jy km s-1] | [Jy] | [km s-1] | [km s-1] | |
| UGC 941 | 2729 (8) | 3.7 (0.4) | 3.3 | 95 (16) | 74 (16) |
| UGC 2885 | 5799 (8) | 20.7 (2.1) | 4.5 | 593 (16) | 576 (16) |
| UGC 2922 | 5210 (8) | 5.0 (0.5) | 3.6 | 411 (16) | 390 (16) |
| UGC 3118† | 8297 (8) | 1.8 (0.2) | 2.9 | 86 (16) | 78 (16) |
| UGC 5160 | 6653 (8) | 2.9 (0.3) | 1.2 | 405 (16) | 387 (16) |
| UGC 5215 | 5475 (8) | 7.5 (0.8) | 1.5 | 440 (16) | 420 (16) |
| UGC 5218 | 3147 (8) | 7.7 (0.8) | 3.0 | 260 (16) | 192 (16) |
| UGC 6886 | 6984 (8) | 4.8 (0.5) | 1.9 | 388 (16) | 371 (16) |
| UGC 8091 | 213 (8) | 8.8 (0.9) | 3.5 | 53 (16) | 41 (16) |
| UGC 8249 | 2540 (8) | 9.0 (0.9) | 3.1 | 191 (16) | 181 (16) |
| UGC 8503 | 4674 (8) | 2.3 (0.3) | 8.3 | 85 (16) | 78 (16) |
| UGC 9007 | 4617 (8) | 1.5 (0.2) | 2.9 | 63 (16) | 52 (16) |
| UGC 9450 | 4487 (8) | 2.6 (0.3) | 2.2 | 206 (16) | 197 (16) |
| UGC 9803 | 5259 (8) | 1.5 (0.2) | 2.7 | 78 (16) | 69 (16) |
| UGC 9965 | 4526 (8) | 5.3 (0.5) | 3.1 | 126 (16) | 101 (16) |
| UGC 10351 | 891 (8) | 9.0 (0.9) | 2.3 | 78 (16) | 63 (16) |
| UGC 10628 | 2979 (8) | 5.8 (0.6) | 2.1 | 273 (16) | 247 (16) |
| UGC 11017 | 4648 (8) | 4.4 (0.4) | 2.2 | 197 (16) | 182 (16) |
| UGC 11461 | 3125 (8) | 8.1 (0.8) | 2.5 | 319 (16) | 303 (16) |
| UGC 11578 | 4602 (8) | 10.9 (1.1) | 3.0 | 103 (16) | 86 (16) |
| UGC 11627 | 4861 (8) | 2.4 (0.2) | 2.1 | 114 (16) | 113 (16) |
| UGC 11992 | 3597 (8) | 6.2 (0.6) | 2.4 | 185 (16) | 172 (16) |
| UGC 12094† | 7589 (8) | 1.6 (0.2) | 3.6 | 56 (16) | 44 (16) |
Note. — †The heliocentric velocity found by the GBT for this galaxy is off by 17 km s-1 due to an instrumental error.
| Name | Flux | W20 | W50 | vHEL | Tel.1 | Refs. |
|---|---|---|---|---|---|---|
| [Jy km s-1] | [km s-1] | [km s-1] | [km s-1] | |||
| UGC 199 | 3.13 ( 0.2) | 122 (3) | 106 (2) | 1803 (4) | A | a |
| NGC 257 | 12.5 ( 1.22) | 426 (4) | 402 (4) | 5278 (5) | A | b |
| NGC 257 | 11.7 ( 1.22) | 437 (4) | 394 (4) | 5270 (5) | A | c |
| UGC 317 | 0.970 ( 0.3) | 47 (7) | 30 (4) | 5264 (5) | A | a |
| UGC 317 | 0.990 ( 0.12) | 41 (9) | 27 (6) | 5361 (5) | G | d |
| UGC 628 | 4.52 ( 0.52) | 239 (83) | 222 (83) | 5447 (83) | A | e |
| UGC 628 | 4.73 ( 0.3) | 251 (6) | 229 (4) | 5446 (4) | A | a |
| UGC 628 | 4.20 ( 1.1) | 237 (10) | 224 (7) | 5443 (5) | G | d |
| UGC 941 | 2.02 ( 0.2) | 88 (8) | 47 (5) | 2726 (5) | A | a |
| UGC 989 | 5.71 ( 0.3) | 166 (4) | 146 (2) | 5107 (5) | A | a |
| UGC 1085 | 1.68 ( 0.2) | 58 (3) | 38 (2) | 652 (4) | A | a |
| UGC 1246 | 7.35 ( 0.2) | 109 (2) | 82 (2) | 804 (4) | A | a |
| UGC 1519 | 2.27 ( 0.2) | 132 (4) | 117 (3) | 2346 (4) | A | a |
| UGC 1519 | 2.13 ( 0.22) | 123 (83) | 111 (83) | 2346 (83) | A | e |
| UGC 2008 | 1.93 ( 0.3) | 124 (5) | 109 (8) | 5041 (5) | A | a |
| UGC 2008 | 2.69 ( 0.5) | 147 (153) | 127 (153) | 5042 (153) | A | f |
| UGC 2339 | 2.17 ( 0.22) | 334 (153) | 325 (153) | 4821 (153) | A | f |
| UGC 2339 | 4.46 ( 0.42) | 478 (83) | 457 (83) | 16469 (83) | A | e |
| UGC 2339 | 4.33 ( 0.42) | 457 (83) | 16469 (83) | A | g | |
| UGC 2432 | 5.67 ( 0.3) | 107 (3) | 88 (2) | 764 (43) | A | a |
| UGC 2602 | 7.01 ( 0.72) | 298 (83) | 276 (83) | 10099 (83) | A | e |
| UGC 2602 | 5.10 ( 0.8) | 305 (25) | 267 (17) | 10098 (8) | N | h |
| UGC 2809 | 9.29 ( 0.2) | 155 (2) | 131 (1) | 1293 (4) | A | a |
| UGC 2885 | 25.2 ( 2.52) | 629 (343) | 583 (343) | 5794 (343) | W | i |
| UGC 2885 | 34.2 ( 3.4) | 595 (4) | 550 (4) | 5801 (4) | J | j |
| UGC 2885 | 17.3 ( 1.72) | 581 (4) | 556 (4) | 5802 (153) | A | k |
| UGC 2885 | 32.7 ( 3.32) | 607 (4) | 5801 (2) | G | l | |
| UGC 2905 | 4.67 ( 0.52) | 71 (83) | 47 (83) | 293 (83) | A | e |
| UGC 2905 | 4.47 ( 0.1) | 71 (1) | 48 (1) | 292 (4) | A | a |
| UGC 2922 | 5.12 ( 0.52) | 370 (83) | 351 (83) | 5215 (83) | A | e |
| UGC 2975 | 2.41 ( 0.22) | 312 (3) | 280 (3) | 19937 (83) | A | m |
| UGC 3044 | 2.20 ( 0.3) | 246 (9) | 228 (5) | 5234 (5) | A | a |
| UGC 3118 | 1.72 ( 0.2) | 89 (8) | 55 (5) | 8310 (5) | A | a |
| UGC 3118 | 0.620 ( 0.4) | 65 (13) | 51 (9) | 8316 (6) | G | d |
| UGC 3169 | 2.79 ( 0.32) | 373 (3) | 358 (3) | 8788 (3) | A | n |
| UGC 3247 | 5.99 ( 0.62) | 196 (2) | 137 (3) | 3369 (3) | A | n |
| UGC 3247 | 5.15 ( 0.52) | 213 (4) | 143 (4) | 3373 (4) | A | o |
| UGC 3296 | 10.5 ( 1.12) | 335 (3) | 315 (3) | 4269 (3) | A | p |
| UGC 3296 | 7.56 ( 0.82) | 348 (4) | 318 (4) | 4264 (153) | A | k |
| UGC 3330 | 5.22 ( 0.52) | 204 (3) | 163 (3) | 5234 (3) | A | n |
| UGC 3330 | 4.52 ( 0.52) | 202 (4) | 170 (4) | 5239 (4) | A | o |
| UGC 3476 | 12.3 ( 0.6) | 141 (9) | 83 (5) | 469 (5) | G | d |
| UGC 3476 | 7.33 ( 0.3) | 117 (6) | 70 (4) | 469 (4) | A | a |
| UGC 3564 | 6.26 ( 0.62) | 94 (3) | 79 (3) | 2548 (3) | A | n |
| UGC 3564 | 5.47 ( 0.2) | 97 (2) | 75 (1) | 2548 (4) | A | a |
| UGC 3582 | 2.94 ( 0.32) | 171 (3) | 152 (3) | 839 (3) | A | n |
| UGC 3621 | 9.56 ( 0.5) | 177 (4) | 159 (2) | 2337 (4) | A | a |
| UGC 3621 | 9.59 ( 1.02) | 173 (3) | 158 (3) | 2337 (3) | A | n |
| UGC 3621 | 10.3 ( 1.02) | 172 (4) | 156 (4) | 2336 (4) | A | o |
| UGC 3755 | 8.36 ( 0.82) | 84 (3) | 43 (3) | 315 (3) | A | n |
| UGC 3755 | 8.49 ( 0.3) | 70 (2) | 37 (1) | 314 (4) | A | a |
| UGC 3767 | 4.49 ( 0.42) | 264 (3) | 246 (3) | 5809 (3) | A | n |
| UGC 3767 | 3.38 ( 0.3) | 273 (7) | 254 (5) | 5806 (5) | A | a |
| UGC 3946 | 11.2 ( 0.3) | 108 (3) | 76 (2) | 1195 (4) | A | a |
| UGC 3946 | 11.8 ( 1.22) | 112 (3) | 79 (3) | 1194 (3) | A | n |
| UGC 3946 | 14.3 ( 1.42) | 126 (4) | 1199 (1) | G | l | |
| UGC 4117 | 3.55 ( 0.4) | 80 (6) | 59 (4) | 775 (4) | A | a |
| UGC 4180 | 6.16 ( 0.62) | 343 (83) | 330 (83) | 5225 (83) | A | g |
| UGC 4180 | 5.18 ( 0.5) | 347 (43) | 5223 (43) | A | q | |
| UGC 4180 | 5.50 ( 0.62) | 358 (4) | 333 (4) | 5231 (4) | A | k |
| UGC 4385 | 6.60 ( 0.72) | 171 (5) | 1969 (83) | A | r | |
| UGC 4660 | 6.23 ( 0.62) | 88 (3) | 61 (3) | 2203 (3) | A | n |
| UGC 4660 | 5.67 ( 0.62) | 69 (4) | 57 (4) | 2201 (4) | A | r |
| UGC 4660 | 7.30 ( 0.2) | 75 (4) | 2205 (2) | G | l | |
| UGC 4780 | 7.54 ( 0.2) | 167 (4) | 128 (2) | 3292 (4) | A | a |
| UGC 4780 | 9.13 ( 0.92) | 147 (3) | 124 (3) | 3283 (3) | A | n |
| UGC 4955 | 1.98 ( 0.2) | 225 (12) | 199 (8) | 6462 (8) | A | a |
| UGC 5030 | 2.94 ( 0.32) | 300 (3) | 286 (3) | 2148 ( ) | A | n |
| UGC 5030 | 3.72 ( 0.42) | 307 (4) | 285 (4) | 2150 (153) | A | k |
| UGC 5160 | 4.27 ( 0.42) | 416 (4) | 381 (4) | 6663 (153) | A | k |
| UGC 5215 | 9.05 ( 0.92) | 427 (4) | 404 (4) | 5484 (153) | A | k |
| UGC 5218 | 7.01 ( 0.72) | 194 (3) | 183 (3) | 3085 (3) | A | n |
| UGC 5218 | 12.7 ( 1.32) | 195 (4) | 182 (4) | 3089 (153) | A | k |
| UGC 5326 | 3.40 ( 0.3) | 118 (7) | 92 (4) | 1417 (5) | A | a |
| UGC 5326 | 4.04 ( 0.42) | 124 (4) | 101 (4) | 1411 (153) | A | k |
| UGC 5326 | 3.65 ( 0.42) | 126 (4) | 101 (4) | 1413 (4) | A | s |
| UGC 5358 | 4.72 ( 0.52) | 217 (4) | 205 (4) | 2914 (153) | A | k |
| UGC 5629 | 2.89 ( 0.1) | 133 (3) | 114 (6) | 6203 (5) | A | a |
| UGC 5651 | 8.33 ( 0.82) | 229 (4) | 213 (4) | 5568 (153) | A | k |
| UGC 5852 | 10.9 ( 1.12) | 368 (5) | 6184 (103) | G | t | |
| UGC 5852 | 13.1 ( 1.32) | 378 (223) | 6165 (223) | A | u | |
| UGC 5852 | 12.4 ( 1.22) | 379 (4) | 338 (4) | 6177 (4) | A | n |
| UGC 6018 | 1.69 ( 0.2) | 72 (3) | 51 (3) | 1292 (43) | A | n |
| UGC 6018 | 1.76 ( 0.4) | 65 (7) | 48 (5) | 1295 (5) | A | a |
| UGC 6421 | 7.31 ( 0.3) | 165 (3) | 165 (3) | 1595 (3) | A | n |
| UGC 6421 | 6.59 ( 0.2) | 179 (2) | 163 (1) | 1504 (4) | A | a |
| UGC 6464 | 3.97 ( 0.42) | 163 (4) | 145 (4) | 1071 (153) | A | b |
| UGC 6464 | 2.60 ( 0.32) | 125 (83) | 1067 (83) | A | v | |
| UGC 6464 | 3.11 ( 0.32) | 150 (4) | 128 (4) | 1080 (153) | A | k |
| UGC 6476 | 3.79 ( 0.42) | 300 (4) | 322 (4) | 7328 (153) | A | k |
| UGC 6872 | 6.32 ( 0.62) | 216 (4) | 183 (4) | 3205 (153) | A | k |
| UGC 6872 | 6.52 ( 0.72) | 263 (4) | 193 (4) | 3212 (8) | A | w |
| UGC 6886 | 5.54 ( 0.62) | 366 (4) | 352 (4) | 6980 (153) | A | k |
| UGC 6886 | 5.10 ( 0.52) | 394 (4) | 360 (4) | 6980 (103) | A | no |
| UGC 6886 | 7.48 ( 0.72) | 406 (4) | 350 (4) | 6972 (83) | A | x |
| UGC 7302 | 3.87 ( 0.3) | 93 (4) | 74 (2) | 3838 (4) | A | a |
| UGC 7302 | 3.84 ( 0.42) | 93 (43) | 74 (2) | 3836 (4) | A | y |
| UGC 7666 | 2.54 ( 0.2) | 138 (10) | 101 (6) | 2559 (5) | A | a |
| UGC 7976 | 6.50 ( 0.7) | 98 (4) | 75 (4) | 2649 (5) | E | z |
| UGC 7976 | 5.34 ( 0.1) | 93 (2) | 73 (1) | 2668 (4) | A | a |
| UGC 8091 | 8.70 ( 0.1) | 48 (4) | 214 (1) | G | l | |
| UGC 8091 | 7.76 ( 0.82) | 41 (4) | 27 (4) | 213 (153) | A | k |
| UGC 8091 | 8.60 ( 1.3) | 45 (4) | 212 (163) | B | aa | |
| UGC 8091 | 5.91 ( 0.62) | 46 (4) | 30 (4) | 214 ( ) | A | bb |
| UGC 8091 | 6.20 ( 0.62) | 40 (4) | 26 (4) | 214 (103) | A | cc |
| UGC 8091 | 8.40 ( 1.1) | 38 (4) | 24 (4) | 214 (223) | E | z |
| UGC 8249 | 6.95 ( 0.3) | 194 (3) | 175 (2) | 2541 (4) | A | a |
| UGC 8249 | 9.00 ( 0.4) | 195 (4) | 2545 ( ) | G | l | |
| UGC 8503 | 1.81 ( 0.2) | 71 (6) | 40 (4) | 4666 (4) | A | a |
| UGC 8516 | 4.04 ( 0.4) | 146 (5) | 1011 (15) | G | t | |
| UGC 8516 | 4.00 ( 0.3) | 125 (5) | 1021 (43) | A | r | |
| UGC 8516 | 3.88 ( 0.42) | 124 (4) | 101 (4) | 1025 (153) | A | k |
| UGC 8516 | 4.19 ( 0.42) | 126 (4) | 99 (4) | 1023 (2) | A | dd |
| UGC 8896 | 5.87 ( 0.62) | 304 (4) | 290 (4) | 4401 (153) | A | k |
| UGC 9007 | 1.42 ( 0.12) | 55 (4) | 40 (4) | 4619 (153) | A | k |
| UGC 9007 | 1.60 ( 0.1) | 57 (4) | 4625 ( ) | G | l | |
| UGC 9007 | 1.20 ( 0.12) | 148 (4) | 62 (11) | 4585 (11) | A | ee |
| UGC 9134 | 4.65 ( 1.0) | 332 (3) | 11157 (153) | A | ff | |
| UGC 9450 | 3.05 ( 1.1) | 222 (3) | 4462 (8) | A | ff | |
| UGC 9450 | 2.10 ( 0.2) | 213 (12) | 180 (7) | 4481 (5) | A | a |
| UGC 9450 | 3.18 ( 0.9) | 201 (6) | 192 (4) | 4467 (4) | G | d |
| UGC 9535 | 8.61 ( 0.4) | 193 (4) | 183 (4) | 1792 (153) | A | k |
| UGC 9535 | 7.99 ( 2.3) | 197 (3) | 837 (8) | A | ff | |
| UGC 9698 | 2.86 ( 1.3) | 180 (3) | 4852 (8) | A | ff | |
| UGC 9803 | 1.69 ( 1.0) | 90 (3) | 5259 (8) | A | ff | |
| UGC 9803 | 2.44 ( 0.6) | 82 (17) | 45 (11) | 5267 (7) | G | d |
| UGC 9803 | 1.49 ( 0.1) | 81 (5) | 61 (3) | 5256 (4) | A | a |
| UGC 9901 | 5.79 ( 2.0) | 241 (4) | 223 (4) | 3161 (153) | A | k |
| UGC 9901 | 5.27 ( 0.52) | 248 (3) | 3166 (8) | A | ff | |
| UGC 9965 | 2.40 ( 0.4) | 115 (4) | 80 (4) | 4525 (8) | A | no |
| UGC 9965 | 5.37 ( 0.52) | 115 (4) | 88 (4) | 4528 (153) | A | k |
| UGC 9979 | 5.44 ( 0.52) | 134 (4) | 118 (4) | 1961 (153) | A | k |
| UGC 9979 | 5.20 ( 1.1) | 140 (4) | 1961 (10) | G | l | |
| UGC 10042 | 4.71 ( 0.52) | 349 (4) | 337 (4) | 4226 (153) | A | k |
| UGC 10243 | 4.56 ( 1.9) | 161 (3) | 7937 (8) | A | ff | |
| UGC 10351 | 5.70 ( 0.4) | 67 (3) | 43 (2) | 892 (4) | A | a |
| UGC 10351 | 9.45 ( 0.4) | 77 (113) | 48 (2) | 891 (4) | G | d |
| UGC 10384 | 5.74 ( 2.3) | 382 (3) | 4970 (8) | A | ff | |
| UGC 10628 | 6.13 ( 0.5) | 272 (5) | 2974 (153) | G | t | |
| UGC 10628 | 5.99 ( 0.6) | 259 (4) | 240 (4) | 2980 (153) | A | k |
| UGC 10628 | 6.28 ( 0.2) | 259 (6) | 244 (5) | 6267 (5) | A | b |
| UGC 10721 | 6.10 ( 0.62) | 286 (4) | 267 (4) | 2918 (153) | A | k |
| UGC 10747 | 3.70 ( 0.42) | 330 (4) | 299 (4) | 8820 (153) | A | k |
| UGC 10901 | 8.33 ( 0.3) | 198 (3) | 178 (2) | 2834 (4) | A | a |
| UGC 11017 | 3.74 ( 0.3) | 189 (6) | 167 (4) | 4648 (4) | A | a |
| UGC 11017 | 1.40 ( 0.4) | 149 (4) | 143 (4) | 4628 (13) | A | no |
| UGC 11120 | 3.58 ( 0.2) | 179 (3) | 162 (2) | 2242 (4) | A | a |
| UGC 11285 | 5.01 ( 0.2) | 321 (5) | 299 (3) | 4500 (4) | A | a |
| UGC 11362 | 3.74 ( 0.2) | 207 (4) | 190 (3) | 4204 (4) | A | a |
| UGC 11461 | 8.10 ( 0.9) | 302 (12) | 286 (8) | 3121 (4) | N | h |
| UGC 11482 | 8.21 ( 0.3) | 289 (2) | 273 (1) | 3163 (4) | A | a |
| UGC 11482 | 9.04 ( 1.5) | 271 (6) | 287 (10) | 3157 (5) | G | d |
| UGC 11504 | 3.50 ( 0.4) | 168 (12) | 128 (19) | 5619 (7) | A | a |
| UGC 11578 | 8.69 ( 0.3) | 96 (2) | 73 (2) | 4604 (4) | A | a |
| UGC 11578 | 11.8 ( 0.7) | 103 (5) | 77 (3) | 4602 (4) | G | d |
| UGC 11624 | 2.91 ( 0.2) | 218 (4) | 201 (3) | 4831 (4) | A | a |
| UGC 11627 | 2.14 ( 0.2) | 135 (9) | 114 (6) | 4864 (5) | A | a |
| UGC 11627 | 1.18 ( 0.4) | 117 (19) | 195 (7) | 4866 (5) | G | d |
| UGC 11655 | 3.81 ( 0.6) | 273 (17) | 247 (11) | 4761 (7) | G | d |
| UGC 11655 | 3.26 ( 0.8) | 277 (9) | 255 (6) | 4756 (5) | A | a |
| UGC 11655 | 4.19 ( 0.7) | 269 (3) | 259 (3) | 4756 (3) | A | gg |
| UGC 11708 | 8.39 ( 0.82) | 302 (4) | 283 (4) | 4161 (4) | A | k |
| UGC 11774 | 3.48 ( 0.3) | 255 (9) | 228 (6) | 6878 (5) | A | a |
| UGC 11774 | 3.92 ( 0.42) | 245 (83) | 228 (83) | 7126 (83) | A | e |
| UGC 11849 | 5.09 ( 0.8) | 361 (3) | 339 (3) | 5841 (1) | A | gg |
| UGC 11849 | 3.60 ( 0.8) | 337 (25) | 320 (17) | 5834 (8) | N | h |
| UGC 11926 | 5.29 ( 0.52) | 111 (83) | 99 (83) | 1649 (83) | A | e |
| UGC 11926 | 6.19 ( 0.3) | 115 (3) | 97 (2) | 1651 (4) | A | a |
| UGC 11992 | 5.43 ( 0.3) | 184 (3) | 167 (2) | 3596 (4) | A | a |
| UGC 11992 | 7.12 ( 1.1) | 181 (11) | 162 (7) | 3596 (5) | G | d |
| UGC 12094 | 2.27 ( 0.2) | 73 (6) | 41 (4) | 7614 (4) | A | a |
| UGC 12094 | 1.14 ( 0.2) | 62 (3) | 32 (3) | 7604 (3) | A | gg |
| UGC 12158 | 4.87 ( 0.52) | 178 (83) | 156 (83) | 9290 (83) | A | e |
| UGC 12388 | 5.42 ( 0.2) | 281 (4) | 261 (3) | 4585 (4) | A | a |
| UGC 12537 | 3.81 ( 0.6) | 466 (3) | 441 (3) | 6116 (2) | A | f |
| UGC 12624 | 3.05 ( 0.32) | 184 (83) | 164 (83) | 3519 (83) | A | e |
| UGC 12624 | 3.19 ( 0.3) | 211 (11) | 183 (7) | 3517 (5) | A | a |
| UGC 12695 | 6.06 ( 0.6) | 87 (6) | 64 (4) | 6184 (4) | A | a |
| UGC 12695 | 2.80 ( 0.8) | 79 (18) | 63 (12) | 6189 (6) | N | h |
| UGC 12695 | 5.16 ( 0.52) | 92 (4) | 67 (4) | 6184 (4) | A | o |
| UGC 12910 | 3.36 ( 0.3) | 86 (7) | 53 (4) | 6352 (4) | A | a |
| CAP 0718+06 | 1.50 ( 0.1) | 199 (4) | 1141 (4) | A | hh | |
| Malin 1 | 3.50 ( 0.5) | 341 (4) | 24750 (93) | A | ii | |
| Malin 1 | 4.60 ( 0.52) | 340 (4) | 315 (4) | 24745 (103) | B | jj |
| Malin 1 | 2.70 ( 0.32) | 355 (4) | 295 (4) | 24705 (103) | A | jj |
| P02-3 | 1.82 ( 0.2) | 112 (5) | 95 (5) | 3178 (5) | A | kk |
| P07-1 | 1.43 ( 0.1) | 187 (5) | 177 (5) | 7949 (5) | A | kk |
| U01-4 | 1.93 ( 0.2) | 191 (5) | 181 (5) | 3450 (5) | A | kk |
Note. — 1Telescopes: A= Arecibo 305m telescope; G = Green Bank 300ft telescope; N = Nancay Decimetric Radio Telescope; W = Westerbork Synthesis Radio Telescope; J = Jodrell Bank 250ft Telescope; E = Effelsberg 100m telescope; B = Green Bank 140ft Telescope.
2 Not given in the literature, and estimated from assuming a 10% flux error.
3 Not given in the literature, and estimated from 0.5*channel resolution.
References. — a. Schneider, Thuan, Magri, & Wadiak (1990); b. Giovanardi & Salpeter (1985); c. Bothun et al. (1984); d. Schneider, Thuan, Mangum, & Miller (1992); e. Giovanelli & Haynes (1993); f. Giovanelli & Haynes (1985); g. Haynes et al. (1997); h. Theureau et al. (1998); i. Roelfsema & Allen (1985); j. Staveley-Smith & Davies (1987); k. Lewis, Helou, & Salpeter (1985); l. Tifft & Cocke (1988); m. Giovanelli & Haynes (1989); n. Bicay & Giovanelli (1986); o. Lewis (1987); p. Bicay & Giovanelli (1986); q. Giovanelli & Haynes (1985); r. Haynes & Giovanelli (1984); s. Schneider, Helou, Salpeter, & Terzian (1986); t. Peterson (1979); u. Davis & Seaquist (1983); v. Helou, Salpeter, & Terzian (1982); w. Huchtmeier & Richter (1989); x. Hoffman et al. (1989); y. Fontanelli (1984); z. Huchtmeier & Richter (1987); aa. Hunter & Gallagher (1985); bb. Hoffman, Helou, Salpeter, & Sandage (1985); cc. Lewis (1984); dd. Oosterloo & Shostak (1993); ee. Bothun et al. (1985a); ff. Freudling, Haynes, & Giovanelli (1988); gg. Giovanelli, Myers, Roth, & Haynes (1986); hh. Pantoja, Altschuler, Giovanardi, & Giovanelli (1997); ii. Bothun, etal. (1986); jj. Impey & Bothun (1989); kk. O’Neil, Bothun, & Schombert (2000); ll. Richter & Huchtmeier (1991).