Nuclear stellar discs in low-luminosity elliptical galaxies: NGC 4458 and NGC 4478
Abstract
We present the detection of nuclear stellar discs in the low-luminosity elliptical galaxies NGC 4458 and NGC 4478, which are known to host a kinematically-decoupled core. Using archival HST imaging, and available absorption line-strength index data based on ground-based spectroscopy, we investigate the photometric parameters and the properties of the stellar populations of these central structures. Their scale length, , and face-on central surface brightness, , fit on – relation for galaxy discs. For NGC 4458 these parameters are typical for nuclear discs, while the same quantities for NGC 4478 lie between those of nuclear discs and the discs of discy ellipticals. We present Lick/IDS absorption line-strength measurements of , Mg , along the major and minor axes of the galaxies. We model these data with simple stellar populations that account for the overabundance. The counter-rotating central disc of NGC 4458 is found to have similar properties to the decoupled cores of bright ellipticals. This galaxy has been found to be uniformly old despite being counter-rotating. In contrast, the cold central disc of NGC 4478 is younger, richer in metals and less overabundant than the main body of the galaxy. This points to a prolonged star formation history, typical of an undisturbed disc-like, gas-rich (possibly pre-enriched) structure.
keywords:
galaxies: elliptical and lenticular, cD — galaxies: photometry — galaxies: kinematics and dynamics — galaxies: abundances — galaxies: formation — galaxies: evolution1 Introduction
In recent years, the sub-arcsec resolution of the Hubble Space Telescope has allowed the study of galactic nuclei, unveiling the presence of distinct components such as small-scale stellar discs (see Pizzella et al. 2002 and references therein) and nuclear clusters (Carollo et al. 1997; Böker et al. 2002; Graham & Guzman 2003). To date surface-brightness distributions of nuclear stellar discs (hereinafter NSD) have been measured for only a few of S0s (Scorza & van den Bosch 1998; van den Bosch et al. 1998; Kormendy et al. 1996) and early-type spiral galaxies (Pizzella et al. 2002). They have smaller scale lengths (10–30 pc) and higher central surface brightnesses (15–19 mag arcsec-2 in the band) with respect to those of embedded stellar discs, which have been found in several elliptical and lenticular galaxies (e.g., Scorza & Bender 1995, hereinafter SB95). Although only few NSDs have been studied in detail, they may be quite a common structure in the central regions of spheroids. Indeed, nuclear discs of gas, dust and stars have been clearly detected in a large number of early-type galaxies (e.g., Jaffe et al. 1994; Lauer et al. 1995; van Dokkum & Franx 1995; Faber et al. 1997; Carollo et al. 1997; Tomita et al. 2000; Kormendy et al. 2001; Tran et al. 2001; Trujillo et al. 2004), but the photometric parameters of such discs have not yet been derived. Furthermore, HST imaging in near-infrared bandpasses provided indirect signatures of the presence of NSDs as discy isophotes in the nuclei of early-type galaxies (Ravindranath et al. 2001) or photometrically-distinct exponential components in bulges (Balcells et al. 2003, 2004). The existence of NSDs suggests that the continuity of the disc properties, with a smooth variation of scale parameters from spirals to discy ellipticals along a sequence of decreasing disc-to-bulge ratio (Kormendy & Bender 1996), could be extended to nuclear scales (van den Bosch 1998). In this framework NSDs could provide important clues to the assembly scenario of their host galaxies.
In the current picture, the NSDs observed in bulges of S0s and spiral galaxies are believed to have formed either from a secular evolution of a nuclear bar (e.g., NGC 4570, van den Bosch et al. 1998; Scorza & van den Bosch 1998; van den Bosch & Emsellem 1998) or as the end result of a merging event (e.g., NGC 4698, Bertola et al. 1999; Pizzella et al. 2002). Each of these scenarios is likely to be correct for some but not for all the objects. In both of them the gas is efficiently directed toward the galaxy centre, where it first dissipates and settles onto an equilibrium plane and then forms into stars. Although the decoupled kinematics strongly suggest a later infall (e.g., NGC 4486A, Kormendy et al. 2001) or merger (e.g., Holley-Bockelmann & Richstone 2000), the frequently indistinguishable star formation history remains an enigma. Yet, these processes are expected to lead to distinct features in stellar populations of NSDs and surrounding spheroids. The measurement of the kinematics of some early-type galaxies (elliptical and S0 galaxies) revealed evidence for kinematically decoupled or peculiar galaxy cores ( see Bertola & Corsini 1999 for a review), strongly indicative of formation by galaxy-galaxy merging (e.g., Kormendy 1984; see Mehlert et al. 1998) and references therein). Such kinematically-distinct cores have been associated with a central disc component (e.g., Rix & White 1992; Mehlert et al. 1998). However, triaxial galaxies with radius-dependent ellipsoids, can, in projection, mimic kinematically decoupled cores (see Arnold, de Zeeuw & Hunter 1994, and references therein). Spectroscopic absorption line-strength indices (Faber et al. 1985; Trager et al. 1998) constrain the luminosity-weighted stellar population age, metallicity and alpha-element overabundance by comparison with evolutionary population synthesis models (Worthey 1994; Maraston 1998; Tantalo et al 1998; Vazdekis 1999; Thomas, Maraston & Bender 2003, hereafter TMB; Bruzual & Charlot 2003). Absorption line-strength indices have been measured out to one effective radii for elliptical galaxies (e.g., Davies et al. 1993; González 1993; Halliday 1999; Mehlert et al. 2000). Such measurements can distinguish between merging and dissipational formation scenarios by the constraint of metallicity gradients, dating of the latest episode of star formation and the measurement of the timescale over which the bulk of the star formation has taken place. Davies et al. (1993), Mehlert et al. (2003) and the analysis of literature data by Kobayashi & Arimoto (1999) have found elliptical galaxies to have gradients in metallicity shallower than predicted by dissipational collapse models. Mehlert et al. (1998) presented spectroscopic line-strength data and HST archive imaging for two Coma cluster galaxies with kinematically-decoupled cores and found little evidence that the cores have experienced different star formation histories from their parent galaxies. Using wide-field spectroscopic maps of NGC 4365 acquired using the SAURON instrument, Davies et al. (2001) presented evidence for a metal-rich core but constant age and -enhancement for both the kinematically-distinct core and parent galaxy. Both studies are consistent with the core and the main galaxy having experienced similar star formation histories.
In this paper, we use archival HST imaging and ground-based spectroscopy to investigate the photometric parameters and stellar population diagnostics of the NSDs hosted by the two Virgo galaxies NGC 4458 and NGC 4478. NGC 4458 and NGC 4478 are classified as E0-1 (de Vaucouleurs et al. 1991, hereinafter RC3) and E2 (Sandage & Tammann 1981; RC3), respectively. They are both low-luminosity ellipticals with a (RC3) at a distance of 12.6 Mpc (Tully 1988, Mpc-1). They have a power-law central luminosity profile ( Ferrarese et al. 1994; Faber et al. 1997; Rest et al. 2001) and both galaxies show deviations from the law in their outskirts (Michard 1985; Prugniel et al. 1987; Caon et al. 1990; Peletier et al. 1990), which have been explained as due to tidal interaction with NGC 4461 and NGC 4486. Recently, the stellar kinematics along the major and minor axes of NGC 4458 and NGC 4478 have been measured by Halliday et al. (2001), who found the signature of a kinematically-decoupled core in their inner arcsec. In particular, NGC 4458 has a clear counter-rotating core along the major axis, while NGC 4478 has a cold component detected along both the major and the minor axis.
In Section 2 we perform the photometric analysis of the archival HST images of the nuclei of NGC 4458 and NGC 4478 in order to derive the surface brightness profiles and scale parameters of their NSDs. In Section 3 we present the absorption line-strength indices as a function of radius of the major and minor axes of both galaxies from the thesis research of Halliday (1999). In Section 4 we combine photometric and spectroscopic results to assess age, metallicity and overabundances of stellar populations of the two NSDs and surrounding spheroids. This allowed us to suggest possible formation and evolution scenarios for NGC 4458 and NGC 4478. We summarize our conclusions in Section 5.
2 Photometric parameters
2.1 Data reduction
We retrieved Wide Field Planetary Camera 2 (WFPC2) images of NGC 4458 and NGC 4478 from the HST archive. Data for the filter F814W were selected as a compromise between obtaining data in identical bandpasses for both galaxies and minimizing the effects of dust on photometric measurements. Total exposure times were 1120 s for NGC 4458 (5 exposures, Prog. Id. 5512, P.I. S. M. Faber) and 1600 s for NGC 4478 (2 exposures, Prog. Id. 6587, P.I. D. Richstone), respectively. All exposures were taken with the telescope guiding in fine lock, which typically gave an rms tracking error of arcsec. We focused our attention on the Planetary Camera chip (PC) where the nucleus of both galaxies was centred. This consists of pixels of arcsec2 each, yielding a field of view of about arcsec2. The images were calibrated using the standard reduction pipeline maintained by the Space Telescope Science Institute. Reduction steps include bias subtraction, dark current subtraction, and flat-fielding and are described in detail in Holtzman et al. (1995a). Subsequent reduction was completed using standard tasks in the STSDAS package of IRAF111IRAF is distributed by NOAO, which is operated by AURA Inc., under contract with the National Science Foundation. Bad pixels were corrected by means of a linear one-dimensional interpolation using the data quality files and the WFIXUP task. Different images of the same target were aligned and combined using IMSHIFT and knowledge of the offset shifts. Cosmic ray events were removed using the task CRREJ. The cosmic-ray removal and bad pixel correction were checked by inspection of the residual images between the cleaned and combined image and each of the original frames. Residual cosmic rays and bad pixels in the PC were corrected by manually editing the combined image with IMEDIT. The sky level ( count pixel-1) was determined from regions free of sources in the Wide Field chips and subtracted from the PC frame after appropriate scaling.
2.2 Detection of nuclear discs
To test for the presence of a NSD in NGC 4458 and NGC 4478, we constructed the unsharp-masked image of the PC frame using an identical procedure to Pizzella et al. (2002). We divided each image by itself after convolution by a circular Gaussian of width and 6 pixels, corresponding to arcsec and arcsec, respectively (Figure 1). This procedure enhanced any surface-brightness fluctuation and non-circular structure extending over a spatial region comparable to the of the smoothing Gaussian. Two values of were adopted to attempt the identification of structures with different scale lengths.
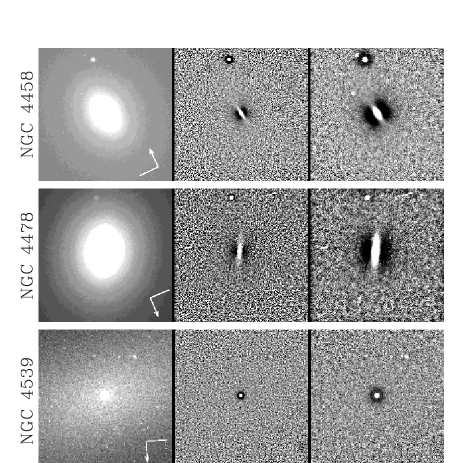
A highly elongated structure is clearly visible in the nucleus of each galaxies. These structures are not artifacts of the unsharp-masking procedure. In Figure 1 we show as a counter-example the unsharp-masked image of NGC 4539 which has been obtained using an identical method to that for NGC 4458 and NGC 4478; we clearly do not detect an elongated disc-like structure. Moreover the nuclear structures of NGC 4458 and NGC 4478 are associated with a central increase in ellipticity measured by performing an isophotal analysis using the IRAF task ELLIPSE (Figure 2).
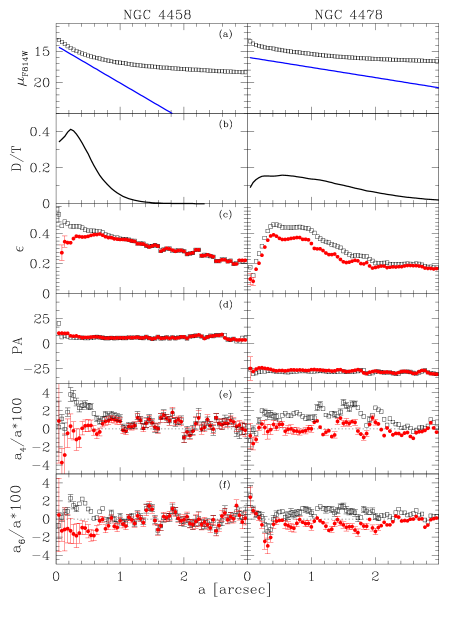
We analyzed the isophotal profiles of both galaxies by first masking foreground stars and then fitting ellipses to the isophotes. We allowed the centres of the ellipses to vary, to test whether the galaxies were disturbed. Within the errors of the fits, we found no evidence of variations in the fitted centre. The ellipse fitting was repeated with the ellipse centres fixed. The resulting azimuthally averaged surface brightness, ellipticity, position angle, the fourth (), and sixth () cosine Fourier coefficients profiles are presented in Figure 2. In the innermost arcsec we measured positive values of the , and Fourier coefficients, which describe the discy deviation of the isophotes from pure ellipses (Jedrzejewski 1987). These photometric features have been also observed in the HST/F555W image for NGC 4458 (Lauer et al. 1995; Trujillo et al. 2004) and in the HST/F702W image of NGC 4478 (van den Bosch et al. 1994; Rest et al. 2001; Trujillo et al. 2004) and confirm the presence of a NSD in both galaxies.
2.3 Photometric decomposition
2.3.1 Photometric parameters of the nuclear discs with the Scorza & Bender method
After establishing the existence of NSDs, we measured their photometric properties using the method described by SB95. This method is based on the assumption that isophotal disciness is the result of the superimposition of a spheroidal component (which is either a host elliptical galaxy or a bulge component) and an inclined disc. The two components are assumed to have both perfectly elliptical isophotes with constant but different ellipticities. When adopting this technique to study the innermost regions of galaxies it is essential to restore the images from the effects of the HST point spread function (PSF) in order to properly derive the photometric parameters of the NSDs, as shown by Scorza & van den Bosch (1998). Such deconvolution was performed through the Richardson-Lucy method by means of the IRAF task LUCY. Although susceptible to noise amplification, this algorithm was shown by van den Bosch et al. (1998) to lead to a restored surface-brightness distribution comparable to that obtained using a multi-Gaussian representation (Monnet et al. 1992; Cappellari 2002). We believe that the results obtained by van den Bosch et al. (1998) are directly applicable to our case: we are dealing with images obtained with similar or longer integration times, galaxies with less steep surface-brightness profiles and NSDs with equal or larger scale lengths. We decided to deconvolve the images with a number of iterations between 3 and 6. A larger number of iterations does not affect the result of the decomposition but does amplify the noise. For each given image and nucleus position on the PC we adopted a model PSF calculated using the TINY-TIM package (Krist & Hook 1999). No correction for telescope jitter was necessary. The SB95 method consists of the iterative subtraction of a thin disc model characterized by an exponential surface-brightness profile with central surface brightness and radial scale length , and by an axial ratio . The disc parameters are adjusted until the departures from perfect ellipses are minimized (i.e., and are close to zero). For each disc model we obtained the disc-free image of the galaxy by subtracting the disc model from the galaxy image. We performed an isophotal analysis on the disc-free image using the IRAF task ELLIPSE. We defined
| (1) |
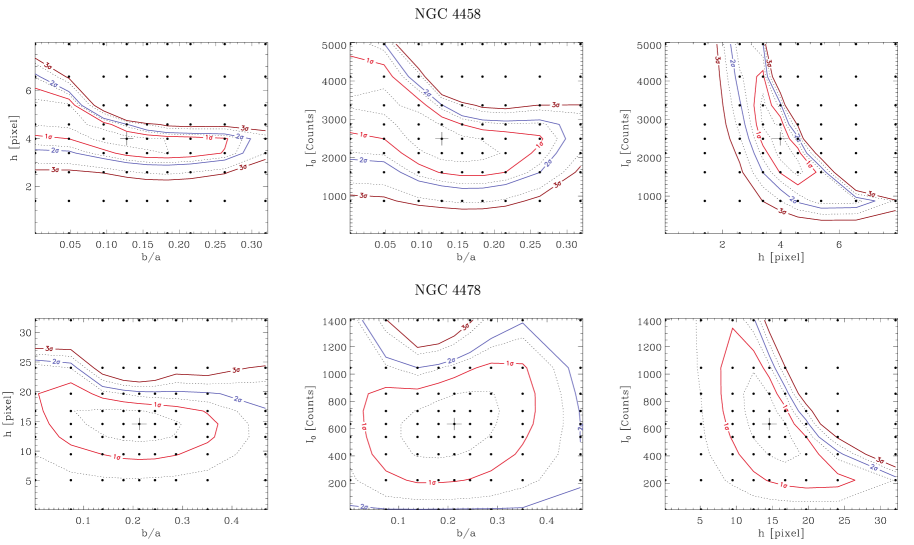
where is the value of the Fourier coefficient measured for the th isophote in the disc-free image, and is the number of fitted isophotes. We assumed as typical error on for all the isophotes in the region of the NSD. We defined the reduced as , where is the number of free parameters, namely , , and . According to our technique for photometric decomposition the minimum value of corresponds to the best-fitting model of the NSD. We found for NGC 4458 and for NGC 4478. We determined and derived its confidence levels under the assumption that the errors are normally distributed (Press et al. 1992). The resulting contour plots of are shown in Figure 3 and they allowed us to derive the best-fitting values of , and and their errors.
We derived the Johnson band central surface brightness of the NSDs from the HST VEGAMAG system (Holtzman et al. 1995b) using the STSDAS task SYNPHOT. Since this correction depends on the galaxy spectral energy distribution, it has been calculated using the spectral template for elliptical galaxies by Kinney et al. (1996). The resulting relation is . We derived the scale length of the NSDs assuming a distance of 12.6 Mpc for both galaxies. The inclination of NSDs has been calculated as . The resulting values of central surface brightness in the band, scale length and inclination for both NSDs are listed in Table 1.
The disciness of NGC 4458 and NGC 4478 disappears after the subtraction of the best-fitting model of the NSD as it results from the elliptical shape of their isophotes as shown by the photometric profiles plotted in Figure 2. We tested that the result of the photometric decomposition is independent of position on the PC chip where the PSF is built. The resulting fraction of total luminosity contributed by the nuclear disc of NGC 4458 and NGC 4478 is plotted as a function of radius in Figure 2.
2.3.2 Photometric parameters of the nuclear discs with the Seifert & Scorza method
In applying the decomposition method by SB95 we assumed that the surface-brightness profile of the NSDs was exponential. To verify this assumption, we derived the surface-brightness profile of the NSDs using the alternative method of Seifert & Scorza (1996, hereinafter SS96). This decomposition method was developed to identify embedded discs in ellipticals and bulges without any a priori assumptions of the parametric law for their surface-brightness profile. In the deconvolved image of the galaxy we masked the region of the NSD with a double-cone mask, and fit ellipses to the isophotes in the remaining part of image using the IRAF task ELLIPSE to derive the photometric properties of the host galaxy. A double-cone mask centred on the galaxy major axis is an optimal choice for the highly-inclined NSDs of NGC 4458 and NGC 4478 since we expect that the isophotes close to the galaxy minor axis will be only slightly contaminated by light from the NSDs. The very central portion of the galaxy image was not masked to allow meaningful isophotes to be fitted. These masks correspond to the central pixel ( arcsec2) of NGC 4458 and pixel ( arcsec2) of NGC 4478. The opening angle of the mask () was adjusted to minimize the influence of the NSD on the fitted parameters of the surrounding galaxy bulge component, but to ensure that a sufficient number of data points for the model derivation remained. A model was constructed to have perfectly elliptical isophotes with the same surface brightness, ellipticity and position angle radial profiles which we obtained from the isophotal fit. We subtracted the galaxy model from the original image to obtain a residual image which shows an elongated structure, namely the NSD, responsible for the higher-order deviations from perfectly elliptical isophotes. We extracted the surface-brightness radial profile along the major axis of the residual disc which was close to being exponential. Scale lengths are consistent within their errors to those measured using the SB95 method, while the central surface brightnesses are somewhat fainter. This discrepancy in the surface brightnesses derived for using the SB95 and SS96 methods is due to the actual shape of the double-cone mask where we excluded the central region in order to allow meaningful isophotes to be fitted. In this way the observed central surface brightness is assigned to the host galaxy and the central surface brightness of the NSD is therefore underestimated.
| Name | ||||
|---|---|---|---|---|
| [mag arcsec-2] | [pc] | [∘] | [L⊙,V] | |
| NGC 4458 | ||||
| NGC 4478 |
2.4 Structural parameters of nuclear discs
It is interesting to compare the scale lengths given in Table 1 ( for NGC 4458 and for NGC 4478) with the “break” radii found in the major and minor axis kinematics of the two galaxies (Halliday et al. 2001). Counter-rotation of about (30 ) is observed in the inner 4 arcsec of the major axis of NGC 4458. In the case of NGC 4478 the velocity dispersion drops in the central 2 arcsec, where the rotational velocity along the major axis drops by from 50 at 2 arcsec to 30 at 3 arcsec from the centre to increase again at larger radii.
Clearly, the spatial resolution of the kinematic data (see Section 3 for details) is smearing the signal of the NSDs. Figure 4 shows the position of the NSDs of NGC 4458 and NGC 4478 in the disc – diagram (adapted from Pizzella et al. 2002; but see also van den Bosch 1998, and Graham 2001). The face-on central surface brightness have been derived from the observed one by applying the following inclination correction
| (2) |
and without taking into account any correction for extinction. The (small) scale length and (high) central surface brightness of the disc of NGC 4458 are typical for NSDs. In contrast, the (relatively large) scale length and (relatively low) central surface brightness of the disc of NGC 4478 are in between the typical values found for discy ellipticals and NSDs. No correlations are found with global properties (e.g., luminosity, scale-length, disc-to-bulge ratio) of the host galaxies.
Finally, on a speculative line of thought without presumption of rigourness, it is interesting to correlate the order of magnitude rotational velocities estimated above (30 for NGC 4458 and 50 for NGC 4478) with the estimated magnitudes of the discs. We find that discs following the Tully-Fisher relation (as in Haynes et al. 1999) and having the same rotational velocities, are expected to be mag brighter than the NSDs of NGC 4458 and NGC 4478. In other words, the NSDs of NGC 4458 and NGC 4478 rotate faster than discs of the same luminosity that follow the Tully-Fisher relation. Taken at face value, this might indicate that they behave like test particles embedded in the dominant gravitational potential generated by the main (bulge) body of the galaxies. However, the situation is complicated by the low spatial resolution of the kinematic data. Using the total masses of the discs derived in Section 4, we estimate that maximum rotational velocities of the order of are generated by the NSDs alone around 0.6-2 arcsec. Clearly, higher resolution kinematic data and proper modelling (including a decomposition of the line-of-sight velocity distributions and seeing convolution) are needed to pin down the issue.

3 Line-strength indices
Absorption line-strength indices are taken from a study of the stellar populations and kinematics of low-luminosity elliptical galaxies, in the Virgo cluster and nearby groups (Halliday 1999; Halliday et al. 2001). We provide a brief summary of our spectroscopic observations. Long-slit spectroscopic data were obtained using the Blue Channel Spectrograph at the Multiple Mirror Telescope, Arizona (USA). A Loral 3k1k CCD chip with a pixel size of 15m15m, a grating of 1200 slits mm-1 and a slit width of 1 arcsec were used. The spectral resolution was 1.5 Å FWHM, wavelength range 4555 - 6045 Å and spatial scale 0.6 arcsec pixel-1. Seeing varied between 0.5 and 0.8 arcsec during observations. The reader is referred to Halliday (1999) for details of the spectroscopic data reduction and Halliday et al. (2001) for a description of the kinematical analyses.
3.1 Measurement of absorption line-strength indices
Line-strength indices were measured as a function of radius to approximately one photometric effective radius along the major and minor axes of each galaxy. One-dimensional spectra were extracted for different luminosity-weighted radii of each axis and line-strength indices were measured for each spectrum using an algorithm developed by G. Baggley and revised by H. Kuntschner (Halliday 1999). The Lick/IDS system line-strength index definitions of Trager et al. (1998) were adopted. A fuller description of the algorithm is given below.
The principal input was a spectroscopic CCD frame for which a basic data reduction had been completed. Before extracting one-dimensional spectra the galaxy spectrum was checked to be aligned with the rows of the CCD frame. Using the IRAF tasks APFIND and APTRACE the position of the galaxy centre was traced along the dispersion axis; this step was performed to an accuracy of 0.03 pixels rms. The pixels were resampled such that the galaxy spectrum was centred on the same row pixel position as a function of dispersion.
One-dimensional spectra were extracted by summing rows of the galaxy frame until a signal-to-noise ratio (hereinafter S/N) of 40 per Å (for the wavelength range 5100–5300 Å) was attained. The dispersion axes of extracted spectra were rebinned to logarithmic intervals of wavelength. Redshifts were measured using the IRAF task FXCOR, by cross-correlating each spectrum with a range of one-dimensional de-redshifted stellar spectra. The mean redshift determined for all templates was used to de-redshift each galaxy spectrum. H, Mg , Fe5270 and Fe5335 line-strength indices were measured for all spectra. Errors for these raw index measurements were calculated based on Poissonian noise, the typical sky level counts subtracted during sky subtraction, and the values of read-out noise and gain of the CCD.
Our line-strength index measurements were transformed to the Lick/IDS system. This procedure involved two steps: (i) correction to zero galaxy velocity dispersion and (ii) correction to the Lick/IDS spectral resolution (8.6 Å).
To correct for the effects of galaxy velocity dispersion, , different stellar spectra were smoothed by Gaussians corresponding to measurements of between 0 km s-1 and 300 km s-1 in intervals of 20 km s-1. Smoothing was performed using the IRAF task GAUSS. Correction factors for different values of were calculated for each index by comparing line index measurements for each smoothed spectrum with measurements for the original unsmoothed stellar spectrum. For the atomic indices H, Mg , Fe5270 and Fe5335 correction factors were defined to be the ratio of measurements for the original unbroadened stellar spectrum, , and that for the spectrum broadened to a particular velocity dispersion, , i.e.,
| (3) |
Mg , Fe5270 and Fe5335 line-strength index measurements were corrected for the effects of using the calibrations for 12 stellar observations; for H data 8 stellar observations were used. Linear relations were interpolated between the mean correction factor for each . The correction factor for an arbitrary measurement of was determined using the linear relation for the range bracketing the measurement. The measurement of as a function of radius was presented for both galaxies in Halliday et al. (2001). We adopt the measurements obtained for a per Å. Measurements of with per Å were adopted at large radii where uncertainties were larger.
Absorption line-strength index measurements and measurements of from Halliday et al. (2001) were measured in general for different galactic radii. Linear interpolations were made between neighboring measurements of . A measurement for a radius at which line-strength indices were measured, was found by linear interpolation from bracketing data. Depending on the appropriate side of the galaxy, if the radius was either less than or exceeded the radius of the most reliable measurement of , the linear interpolation determined for the closest radial interval was used to determine . The errors of line-strength index measurements corrected for galaxy velocity dispersion were calculated to be,
| (4) |
where is the error in the raw measurement calculated as outlined above and ) is the addition in quadrature of the standard deviations of correction factors for measurements of bracketing the measurement.
Corrections for the difference between our spectral resolution and the resolution of the Lick/IDS system were applied. A simulated Lick aperture was extracted for the major axis spectrum of each galaxy studied by Halliday (1999) present in the “pristine” IDS sample of Trager (1997). Spectra were resampled such that the galaxy centre was aligned with the same pixel row position as a function of wavelength. For our spectroscopic slit width of arcsec and spatial scale of arcsec pixel-1 a one-dimensional spectrum corresponding to a Lick/IDS aperture was created by summing the central 9 rows (i.e., the central arcsec of each galaxy spectrum). Line-strength indices were measured using the Lick/IDS definitions of Trager et al. (1998). The galaxy velocity dispersion was measured using the IRAF task FXCOR. Line-strength indices were corrected for the effects of using the calibrations discussed above. Direct comparisons were made with the fully-corrected Lick/IDS arcsec2 aperture measurements of the “pristine” IDS sample of Trager (1997); we considered the Lick/IDS H measurements corrected for the effects of but uncorrected for H emission. Relation fitting was attempted between the simulated Lick/IDS aperture measurements corrected for and the Lick/IDS measurements of Trager (1997), as a function of our -corrected, simulated Lick/IDS aperture measurements. After testing various routines, the median value of offset was found to provide a good fit for all line-strength indices (i.e., for H, 0.272; Mg2, -0.048; Mgb, 0.051; Fe5270, 0.544; Fe5335, 0.697). The -corrected measurements were established on to the Lick/IDS system by subtracting these median values for all index measurements excluding Mg for which no zero correction was required due to the large scatter of offset values around the median.
3.2 Absorption line-strength gradients
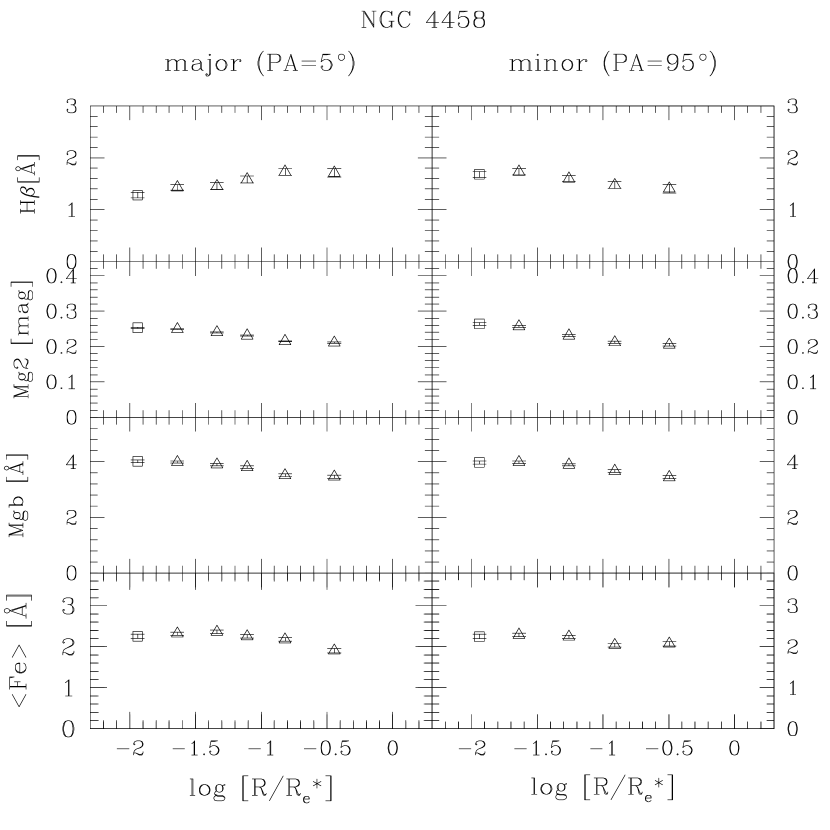
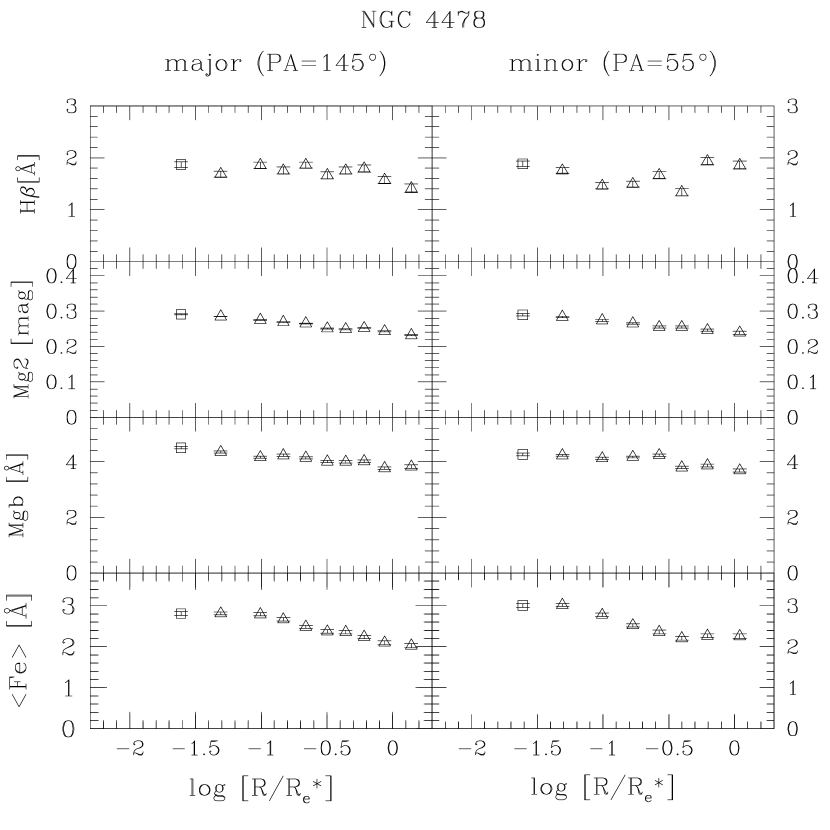
Absorption line-strength index measurements for H, Mg , Mg2 and are shown as a function of radius for the major and minor axes of NGC 4458 and NGC 4478 in Figure 5. Line-strength measurements are presented as a function of the normalized radius , where for the major axis and for the minor axis, respectively. is the circularized effective radius defined as with the diameter of the circle enclosing one-half of the band total flux (RC3), and is the mean ellipticity of the galaxy. We assume arcsec (RC3, corresponding to 1.6 kpc at the adopted distance) and (Lauer et al. 1995) for NGC 4458, arcsec (RC3, corresponding to 0.8 kpc at the adopted distance) and (Peletier et al. 1990) for NGC 4478. The different central values measured along major and minor axis for the same index give an estimate of the true measurement errors. Measurements for Mg2 are shown for completeness and the calibration of this molecular index to the Lick/IDS system is described in Halliday (1999).
For NGC 4478, measurements of H, Mg , Mg2, Fe5270, Fe5335 and were derived previously for the galaxy centre by González (1993) and Trager et al. (1998), and as a function of radius of the major axis by Peletier (1989) and Gorgas et al. (1990). In Figure 6 we compare all previous measurements with our measurements presented here.
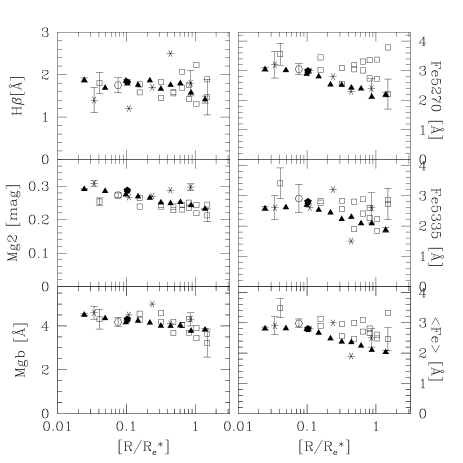
Good agreement within all margins of uncertainty is found between our data and the measurements of Peletier (1989). Measurements and errors for Fe5270 were not tabulated by Peletier (1989) and have been derived using the corresponding measurements of Fe5335 and . Agreement within the errors is found between our measurements and those of Gorgas et al. (1990) for H and Mg but not for Fe5270, Fe5335, and . A single bad pixel column was interpolated for a region corresponding to the red passband of Fe5270 of our spectrum of NGC 4478 but this is unlikely to be the cause of the discrepancy here since no evidence of unsuccessful bad pixel correction was found. Since Fe5270, Fe5335, and are critical indices in the study of stellar populations, it has to be noted that our results are based on our data. At the galaxy centre there is a small difference between our value of the Mg2 index and that of Gorgas et al. (1990), while agreement within the errors is found for data at all other radii. The central measurements of the line-strength indices of González (1993) and Trager et al. (1998) are in good agreement with our measurements.
4 Ages, metallicities and overabundances
In the following we indicate the combined Magnesium-Iron index with
| (5) |
newly defined by TMB. This index is completely independent of the [] overabundance and hence serves best as a metallicity tracer.
We show in the top panels of Figure 7 the line strengths of the and indices at different positions in the galaxies NGC 4458 and NGC 4478 with the grid of models of TMB. No clear trend is observed for NGC 4458. NGC 4478 shows a negative gradient in both the indices and . We show in bottom panels of Figure 7 the line strength of the Mg and indices at different positions in the galaxies NGC 4458 and NGC 4478. For both galaxies, both indices and Mg decrease outward on the mean.

Using stellar population models with variable element abundance ratios from TMB we derive average ages, metallicities and [] ratios as a function of the position in the galaxies, following the procedure of Mehlert et al. (2003). Figure 8 translates the trends observed in Figure 7 as follows. NGC 4458 is uniformly old ( Gyr), has overall low metal content ([] ) and overabundance ([] ). For NGC 4478 instead the central regions () are younger (t Gyr), more metal rich ([] ) and less overabundant ([] ) than the outer regions, where old ages (t Gyr), low metallicities ([] ) and high overabundances ([] ) are observed on both the minor and the major axis. The size of the error bars shows that the decreases in age and overabundance in the central region are significant. Finally, note that within the errors most of the ages shown in Fig. 8 are compatible with the age of Universe favoured by WMAP (Spergel et al. 2003). In the following we will interpret the radial variations described above as the result of the superposition of the central discs detected photometrically in Section 2.2 and the main body of the galaxy. Moreover, we will assume that the main body of the galaxy does not have a [] gradient, in agreement with the results of Mehlert et al. (2003). NGC 4458 has properties similar to giant ellipticals with decoupled cores. Prototypes of decoupled cores in giant ellipticals are as old as and metal richer than the rest of the galaxy, with high and approximately constant overabundance, as in the case of NGC 4816 and IC 4051 (Mehlert et al. 1998), or NGC 4365 (Surma & Bender 1995; Davies et al. 2001). In NGC 4458 the inner disc and the main body of the galaxy appear to have the same stellar populations, with a metallicity gradient for the main body of the galaxy slightly weaker than the cases discussed above. By contrast, the case of NGC 4478 is intriguing. The inner, cold disc is younger, richer in metals and less overabundant than the main body of the galaxy. We tested this conclusion with a composite stellar population model, summing 10% of a young ( Gyr) and metal rich () component with solar ratios, and 90% of an old ( Gyr) metal rich () overabundant ([] ) population, and recovering the observed central values of the line indices. Given the errors of the available spectroscopic data and their spatial resolution, we refrained from a detailed study of the allowed range of alternative solutions, that only spectroscopy at HST resolution can pin down.
Of course, higher than solar ratios for the disk are allowed if we relax the assumption that the ratio of the main body of NGC 4478 is constant. Using these age and metallicity estimates and the models of Maraston (1998), we compute that the mass-to-light ratios of the inner discs are ML⊙ for NGC 4458 (with a range from 5 to 10 judged from the range of ages and metallicities shows in Fig. 8) and ML⊙ for NGC 4478. In this case, given the limitations of the spectroscopic data discussed above, the uncertainties are probably as large as a factor 2. Combined with the luminosities given in Table 1, this gives masses of M⊙ and M⊙, respectively. The kinematic and photometric properties discussed above argue for the presence of (cold) discs at the centres of NGC 4458 and NGC 4478, and therefore for a formation scenario through the dissipational collapse of a gas rich object. The observed kinematic signature of counter-rotation in NGC 4458 argues in addition for an external origin with decoupled angular momentum. The absence of gradients in the stellar population of NGC 4458 indicates that the formation of the inner cold structure happened at the same time as the main body of the galaxy. The younger age and low overabundance of the central structure of NGC 4478 is indicative of a prolonged star formation history (Thomas, Greggio & Bender 1999), typical of an undisturbed disc-like, gas-rich (possibly pre-enriched) structure. This is consistent with the absence of counter-rotation.

5 Conclusions
We have investigated the properties of the central regions of the low-luminosity ellipticals NGC 4458 and NGC 4478, finding that:
-
1.
HST archive images of the two galaxies show the presence of central discs. They have scale lengths and face-on central surface brightnesses which fit on – relation for galaxy discs. For NGC 4458 these parameters are typical of NSDs, while for NGC 4478 they are intermediate between the values for NSDs and the discs of discy ellipticals.
-
2.
Measurements presented by Halliday et al. (2001) along the major and minor axis of the galaxies revealed the presence of decoupled kinematics on the radial scales of the NSDs. A counter-rotating central structure is present in NGC 4458, a cold rotating component in NGC 4478.
-
3.
The Lick/IDS absorption line-strength indices , Mg and measured as a function of radius along the major and the minor axis of the galaxies allow us to estimate the age, metallicity and overabundance of the stellar populations of the two galaxies using simple stellar population models.
-
4.
The radial variations of the derived quantities constrain the stellar population properties of the central discs. The NSD of NGC 4458 has an estimated stellar mass of M⊙ and is similar to the decoupled cores of bright ellipticals, being as old as and richer in metals than the rest of the galaxy, with high and approximately constant overabundance. The cold central disc of NGC 4478 has a similar estimated stellar mass of M⊙, but is younger, richer in metals and less overabundant than the main body of the galaxy.
-
5.
The nearly solar element abundance of the central disc of NGC 4478 indicates a prolonged star formation history, typical of an undisturbed disc-like, gas-rich (possibly pre-enriched) structure.
Acknowledgments
Based on observations made with the NASA/ESA Hubble Space Telescope, obtained from the data archive at the Space Telescope Institute. STScI is operated by the association of Universities for Research in Astronomy, Inc. under the NASA contract NAS 5-26555. We thank the observing committee of the CfA for their generous award of telescope time to obtain the spectroscopic observations presented here. The spectroscopic absorption line-strength measurements presented were derived as part of the Ph.D. thesis research of CH. CH gratefully acknowledges the support of a PPARC studentship at the University of Durham and the grant support of the Italian National Research Centre (grant CNRG00887) and a grant from the Fondo per gli Investimenti della Ricerca di Base of the Italian Ministery of Education, University and Research (grant RBAU018Y7E). We acknowledge A. W. Graham for useful discussion. LM gratefully acknowledges the support of an ESO studentship at the ESO Research Facilities in Santiago. RPS thanks the financial support by the DFG grant SFB375. This research has made use of the Lyon-Meudon Extragalactic Database (LEDA), NASA/IPAC Extragalactic Database (NED) and Starlink facilities.
References
- Arnold et al. (1994) Arnold, R., de Zeeuw, P. T., Hunter, C., 1994, MNRAS, 271, 984A
- Bender et al. (1989) Bender, R., Surma, P., Doebereiner, S., Moellenhoff, C., & Madejsky, R., 1989, A&A, 217, 35
- Bertola & Corsini (1999) Bertola, F. & Corsini, E. M. 1999, IAU Symp. 186: Galaxy Interactions at Low and High Redshift, 186, 149
- Bertola et al. (1999) Bertola, F., Corsini, E. M., Vega Beltrán, J. C., Pizzella, A., Sarzi, M., Cappellari, M., & Funes, J. G., 1999, ApJL, 519, L127
- Balcells, Graham, Domínguez-Palmero, & Peletier (2003) Balcells, M., Graham, A. W., Domínguez-Palmero, L., & Peletier, R. F., 2003, ApJL, 582, L79
- Balcells, Graham, & Peletier (2004) Balcells, M., Graham, A. W., & Peletier, R. F., 2004, ApJ, submitted (astro-ph/0404381)
- Böker et al. (2002) Böker, T., Laine, S., van der Marel, R. P., Sarzi, M., Rix, H., Ho, L. C., & Shields, J. C. 2002, AJ, 123, 1389
- Bruzual & Charlot (2003) Bruzual, G. & Charlot, S., 2003, MNRAS, 344, 1000
- Cappellari (2002) Cappellari, M. 2002, MNRAS, 333, 400
- Caon, Capaccioli, & Rampazzo (1990) Caon, N., Capaccioli, M., & Rampazzo, R., 1990, A&AS, 86, 429
- Carollo, Danziger, Rich, & Chen (1997) Carollo, C. M., Danziger, I. J., Rich, R. M., & Chen, X., 1997, ApJ, 491, 545
- Davies et al., (1993) Davies, R. L., Sadler, E. M., and Peletier, R. F., 1993, MNRAS, 262, 650
- Davies et al. (2001) Davies, R.L., Kuntschner, H., Emsellem, E., Bacon , R., Bureau, M., Carollo, C.M., Copin, Y., Miller, B.W., Monnet, G., Peletier, R.F., Verolme, E.K., de Zeeuw, P.T., 2001, ApJL, 548, L33
- de Vaucouleurs et al. (1991) de Vaucouleurs, G., de Vaucouleurs, A., Corwin, J. R., Buta, R. J., Paturel, G., & Fouque, P. 1991, Third Reference Catalogue of Bright Galaxies (RC3)
- Faber et al., (1985) Faber, S. M., Friel, E. D., Burstein, D., and Gaskell, C. M., 1985, ApJS, 57, 711
- Faber et al. (1997) Faber, S. M., Tremaine, Scott, Ajhar, Edward A., Byun, Yong-Ik, Dressler, Alan, Gebhardt, Karl, Grillmair, Carl, Kormendy, John, Lauer, Tod R., Richstone, Douglas, 1997, AJ, 114, 1771
- (17) Ferrarese, L., van den Bosch, F. C., Ford, H. C., Jaffe, W., O’Connell, R. W., 1994, AJ, 108, 1598F
- González, J. J. (1993) González, J. J. 1993, Line Strength Gradients and Kinematic Profiles in Elliptical Galaxies, PhD thesis, University of California
- Gorgas et al. (1990) Gorgas, J., Efstathiou, G., & Aragón-Salamanca, A. A., 1990, MNRAS, 245, 217
- Graham (2001) Graham, A. W. 2001, MNRAS, 326, 543
- Graham & Guzmán (2003) Graham, A. W. & Guzmán, R. 2003, AJ, 125, 2936
- Halliday (1999) Halliday, C. 1999, Low-Luminosity Elliptical Galaxies, PhD thesis, University of Durham
- Halliday et al. (2001) Halliday, C., Davies, R. L., Kuntschner, H., Bender, R., Birkinshaw, M., Saglia, R. P., & Baggley, G. 2001, MNRAS, 326, 473
- Haynes et al. (1999) Haynes, M.P., Giovanelli, R., Chamaraux, P., da Costa, L.N., Freudling, W., Salzer, J.J., Wegner, G., 1997, AJ, 117, 2039
- Holley-Bockelmann & Richstone (2000) Holley-Bockelmann, K. & Richstone, D. O., 2000, ApJ, 531, 232
- Holtzman et al. (1995) Holtzman, J. A. et al. 1995a, PASP, 107, 156
- Holtzman et al. (1995) Holtzman, J. A., Burrows, C. J., Casertano, S., Hester, J. J., Trauger, J. T., Watson, A. M., & Worthey, G. 1995b, PASP, 107, 1065
- (28) Jaffe, W., Ford, H. C., O’Connell, R. W., van den Bosch, F. C., Ferrarese, L., 1994, AJ, 108, 1567J
- (29) Jedrzejewski, R., 1987, MNRAS, 226, 747J
- Kinney et al. (1996) Kinney, A. L., Calzetti, D., Bohlin, R. C., McQuade, K., Storchi-Bergmann, T., & Schmitt, H. R. 1996, ApJ, 467, 38
- Kobayashi & Arimoto (1999) Kobayashi, C. & Arimoto, N., 1999, ApJ, 527, 573
- Kormendy, (1984) Kormendy, J., 1984,ApJ, 287, 577
- Kormendy et al. (1996) Kormendy, J., Byun, Y.; Ajhar, E. A.; Lauer, T. R.; Dressler, A.; Faber, S. M.; Grillmair, C.; Gebhardt, K.; Richstone, D.; Tremaine, S., 1996, IAU Symp. 171: New Light on Galaxy Evolution, 171, 105
- Kormendy & Bender (1996) Kormendy, J. & Bender, R., 1996, ApJL, 464, L119
- Kormendy & Gebhardt (2001) Kormendy, J. & Gebhardt, K., 2001, AIP Conf. Proc. 586: 20th Texas Symposium on Relativistic Astrophysics, 586, 363
- Krist & Hook (1999) Krist, J., Hook, R. 1999, STIS Instrument Handbook Version 4.0 (Baltimore: STScI)
- Lauer et al. (1995) Lauer, T. R., Ajhar, E. A., Byun, Y.-I., Dressler, A., Faber, S. M., Grillmair, C., Kormendy, J., Richstone, D., Tremaine, S., 1995, AJ, 110, 2622
- (38) Maraston, C., 1998, MNRAS, 300, 872
- (39) Mehlert, D., Saglia, R.P., Bender, R., Wegner, G., 1998, A&A, 332, 33
- Mehlert, Saglia, Bender, & Wegner (2000) Mehlert, D., Saglia, R. P., Bender, R., & Wegner, G., 2000, A&AS, 141, 449
- (41) Mehlert, D., Thomas, D., Saglia, R.P., Bender, R., Wegner, G., 2003, A&A, 407, 423
- Michard (1985) Michard, R., 1985, A&AS, 59, 205
- Monnet et al. (1992) Monnet, G., Bacon, R. & Emsellem, E. 1992, A&A, 253, 366
- Peletier et al. (1989) Peletier, R. F. 1989, PhD thesis, University of Groningen
- Peletier et al. (1990) Peletier, R. F., Davies, R. L., Illingworth, G. D., Davis, L. E., & Cawson, M., 1990, AJ, 100, 1091
- Pizzella et al. (2002) Pizzella, A., Corsini, E. M., Morelli, L., Sarzi, M., Scarlata, C., Stiavelli, M.,& Bertola, F. 2002, ApJ, 573, 131
- Press et al. (1992) Press, W. H., Teukolsky, S. A., Vetterling, W. T., & Flannery, B. P. 1992, Numerical recipes in FORTRAN. The art of scientific computing (Cambridge: University Press)
- Prugniel, Nieto, & Simien (1987) Prugniel, P., Nieto, J.-L., & Simien, F., 1987, A&A, 173, 49
- Ravindranath et al. (2001) Ravindranath, S., Ho, L. C., Peng, C. Y., Filippenko, A. V., Sargent, W. L. W., 2001, AJ, 122, 653
- Rest et al. (2001) Rest, A., van den Bosch, F. C., Jaffe, W., Tran, H., Tsvetanov, Z., Ford, H. C., Davies, J., & Schafer, J., 2001, AJ, 121, 2431
- Rix and White, (1992) Rix, H. W. and White, S. D. M., 1992, MNRAS, 254, 389
- Sandage & Tammann (1981) Sandage, A. & Tammann, G. A. 1981, Revised Shapley-Ames Catalog of Bright Galaxies, (Washington: Carnegie Institution) (RSA)
- Scorza & Bender (1995) Scorza, C. & Bender, R. 1995, A&A, 293, 20 (SB95)
- Scorza & van den Bosch (1998) Scorza, C. & van den Bosch, F. C. 1998, MNRAS, 300, 469
- Seifert & Scorza (1996) Seifert, W. & Scorza, C. 1996, A&A, 310, 75 (SS96)
- Spergel et al. (2003) Spergel, D. N., Verde, L., Peiris, H. V., Komatsu, E., Nolta, M. R., Bennett, C. L., Halpern, M., Hinshaw, G., Jarosik, N., Kogut, A., Limon, M., Meyer, S. S., Page, L., Tucker, G. S., Weiland, J. L., Wollack, E., & Wright, E. L. 2003, ApJS, 148, 175
- Surma & Bender (1995) Surma, P. & Bender, R. 1995, A&A, 298, 405
- Tantalo, Chiosi, & Bressan (1998) Tantalo, R., Chiosi, C., & Bressan, A., 1998, A&A, 333, 419
- (59) Thomas, D., Greggio, L, Bender, R., 1999 MNRAS, 302, 537
- (60) Thomas D., Maraston, C., Bender R. 2003, MNRAS, 339, 897 (TMB)
- Tomita et al. (2000) Tomita, A., Aoki, K., Watanabe, M., Takata, T., Ichikawa, S., 2000, AJ, 120, 123
- Trager (1997) Trager, S. C. 1997 The Stellar Population Histories of Elliptical Galaxies, PhD thesis, University of California
- Trager et al. (1998) Trager, S. C., Worthey, G., Faber, S. M., Burstein, D., & Gonz ́alez, J. J. 1998, ApJS, 116, 1
- Tran et al. (2001) Tran, H. D., Tsvetanov, Z., Ford, H. C., Davies, J., Jaffe, W., van den Bosch, F. C., Rest, A., 2001, AJ, 121, 2928
- Trujillo, Erwin, Ramos, & Graham (2004) Trujillo, I., Erwin, P., Ramos, A. A., & Graham, A. W. 2004, AJ, 127, 1917
- Tully (1988) Tully, R. B. 1988, Nearby Galaxy Catalog, (Cambridge: Cambridge University Press)
- van den Bosch et al. (1994) van den Bosch, F. C., Ferrarese, L., Jaffe, W. Ford, H.C., O’Connell, R.W., 1994, AJ, 108, 1579
- van den Bosch (1998) van den Bosch, F. C. 1998, ApJ, 507, 601
- van den Bosch & Emsellem (1998) van den Bosch, F. C. & Emsellem, E., 1998, MNRAS, 298, 267
- van den Bosch et al. (1998) van den Bosch, F. C., Jaffe, W. & van der Marel, R. P. 1998, MNRAS, 293, 343
- (71) van Dokkum, P. G.& Franx, M., 1995, AJ, 110, 2027V
- Vazdekis (1999) Vazdekis, A., 1999, ApJ, 513, 224
- Worthey, (1994) Worthey, G., 1994, ApJS, 95,107