High-Redshift Extremely Red Objects in the HST Ultra Deep Field Revealed by the GOODS IRAC Observations
Abstract
Using early data from the Infrared Array Camera (IRAC) on the Spitzer Space Telescope, taken for the Great Observatories Origins Deep Survey (GOODS), we identify and study objects that are well-detected at 3.6m, but are very faint (and in some cases, invisible) in the Hubble Ultra Deep Field (HUDF) ACS and NICMOS images and in very deep VLT -band imaging. We select a sample of 17 objects with . The analysis of their spectral energy-distributions (SEDs) from 0.4 to 8.0m shows that the majority of these objects cannot be satisfactorily explained without a well-evolved stellar population. We find that most of them can be well fitted by a simple two-component model, where the primary component represents a massive, old population that dominates the strong IR emission, while the secondary component represents a low amplitude, on-going star-formation process that accounts for the weak optical fluxes. Their estimated photometric redshifts () range from 1.6 to 2.9, with the median at . For the simple star formation histories considered here, their corresponding stellar masses range from 0.1 to for a Chabrier Initial Mass Function (IMF). Their median rest-frame -band absolute magnitude is mag in AB system, or for present–day elliptical galaxies. In the scenario of pure luminosity evolution, such objects may be direct progenitors for at least 14 to 51% of the local population of early–type galaxies. Due to the small cosmic volume of the HUDF, however, this simple estimate could be affected by other effects such as cosmic variance and the strong clustering of massive galaxies. A full analysis of the entire GOODS area is now underway to assess such effects.
1 Introduction
The Spitzer Space Telescope, the fourth and last of NASA’s Great Observatories, provides order-of-magnitude improvements in capabilities of studying the infrared sky over a wide wavelength coverage (Werner et al. 2004). IRAC, one of the three instruments on-board Spitzer, is a four-channel camera that simultaneously takes images at 3.6, 4.5, 5.8, and 8.0m (Fazio et al. 2004). Extremely deep observations with IRAC are a key component of the GOODS Spitzer Legacy program. By the time of writing, the first epoch of GOODS IRAC observations has been finished. With a typical exposure time of 23 hours per pixel, these data have already imaged the 3.6–8.0m sky to an unprecedented depth. About 1/3 of the GOODS area, including the Hubble Ultra Deep Field (HUDF 111See http://www.stsci.edu/hst/udf; PI. S. Beckwith), has been observed in all four IRAC channels.
A subject of immediate interest is whether these IRAC data have revealed any objects with unusual properties at these largely unexplored depths and wavelengths. In this paper, we discuss a particular population that are bright in all IRAC channels, but are extremely faint or even invisible at optical wavelengths. The red colors of these objects are reminiscent of those for the so-called “Extremely Red Objects” (EROs; e.g., Elston et al. 1988; McCarthy et al. 1992; Hu & Ridgway 1994; Thompson et al. 1999; Yan et al. 2000; Scodeggio & Silva 2000; Daddi et al. 2000), which are commonly selected based on or photometry. We will therefore refer to our objects as IRAC-selected Extremely Red Objects (IEROs), and will discuss their possible connection to conventional EROs in this paper. To better constrain their optical fluxes, we concentrate our discussion on the area defined by the HUDF, where the deepest optical data are available. Throughout this paper, we adopt the following cosmological parameters: , , and km sMpc-1. All magnitudes are in the AB system unless specified otherwise.
2 Data, Photometry and Sample Definition
The data from the first epoch of GOODS IRAC observations on the CDF-S are described by Dickinson et al. (2004, in preparation). The nominal exposure time per pixel is about 23.18 hours in each channel. The southern 2/3 of the entire field has been covered by m and m channels, while the northern 2/3 has been covered by m and m channels. The middle 1/3 of the field, which includes the HUDF, has been observed in all four IRAC channels. The images were “drizzle”-combined (Fruchter & Hook 2002), and the pixel scale of the final mosaics is , or approximately half of the native IRAC pixel size. For an isolated point source, the formal detection limits () from background shot noise in regions with full exposure time range from 0.11 (in m) to 1.66 Jy (in m). In practice, crowding and confusion influence the detection limits. As discussed later, we will restrict ourselves to objects which are reasonably well isolated.
We used SExtractor (Bertin & Arnouts 1996) in double-image mode to perform matched-aperture photometry. We detected objects in a weighted average of the m and m images in order to provide a single catalog that covers the entire GOODS area with reasonable uniformity. A pixel Gaussian convolving kernel with a FWHM of was used for detection. We required a detected object have a minimum connected area of two pixels (in the convolved image) that were 1.5 above the background. We adopted the photometric calibration constants provided in the image headers generated by the Spitzer Science Center IRAC data processing pipeline. The “MAG_AUTO” option was used throughout. Photometric errors were estimated using realistic noise maps generated as part of the data reduction process, but these include background photon noise only. Crowding and source blending will generally increase the photometric uncertainties, although in this paper we will limit ourselves to reasonably well isolated objects. In total, there are 552 IRAC sources detected within the solid angle covered by the ACS images of the HUDF (10.34 arcmin2 in size).
We used the HUDF -band-based catalog of Yan & Windhorst (2004) for optical identification. The magnitudes in this catalog are matched-aperture “MAG_AUTO” magnitudes. The source matching was done by identifying the closest ACS object within a radius from the IRAC source centroid. The -to- flux density ratio () histogram of the matched sources has its peak at 1.7. We define IEROs as objects that have . The unmatched IRAC sources automatically satisfy this criterion. No attempt has been made to correct the differences in flux measurement that caused by the different apertures used in generating the IRAC catalog and the -band catalog, since such differences are at most 0.1 mag (based on Monte Carlo simulations using artificial sources and tests using larger photometry apertures) and thus will not affect the selection for these extreme objects.
The major difficulty for reliable IERO selection and photometry is contamination due to source blending. Here, we adopt a conservative approach, by visually inspecting each source in both the IRAC and the ACS + NICMOS HUDF images, and considering only those sufficiently isolated objects that crowding should not significantly affect the photometry. We inspected 75 IRAC sources that met the criterion , and rejected 58 that had nearby objects that might have influenced the IRAC photometry, or that were clearly the blended emission from two or more sources as revealed by the ACS images. The remaining 17 objects constitute our final sample. Fifteen of these objects do not have any companion within a radius from the IRAC centroids as seen in the ACS images. The other two have one or two close neighbors in the ACS images. However, we believe that their identifications are secure for two reasons: in the ACS bands these neighbors are all at least 1.0 mag fainter than the identified counterparts, and are all centered more than from the IERO centroids.
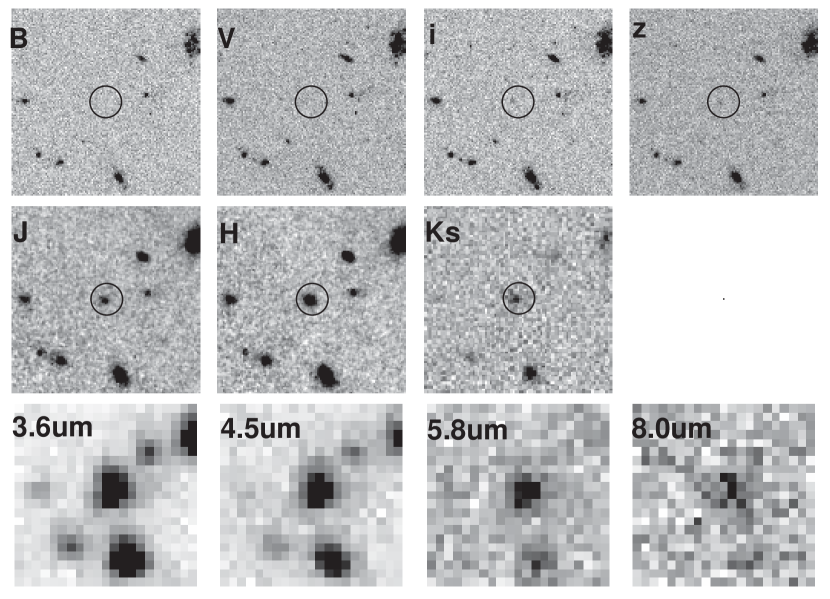
Table 1 gives the coordinates and photometric properties of these 17 IEROs. The source fluxes are in the range . Among these objects, 12 are within the field coverage of the HUDF NICMOS Treasury Program (Thompson et al. 2004, in preparation), of which 11 (including the two objects that have no optical counterparts) are identified in both the and the bands. The unidentified one is the faintest IRAC source in our sample (object #10). In addition, we also searched for their counterparts in the deep -band images obtained by ISAAC at VLT, which were taken as part of the ground-based supporting data for GOODS (Giavalisco et al. 2004). Fifteen of the IEROs have counterparts in the images, and the other two are not seen because they are too faint. The , and magnitudes of the IEROs are also listed in Table 1 when available. As an example, the image cut-outs of one of these objects are displayed in Figure 1.
3 The Nature of IEROs
Without exception, the IEROs that have optical counterparts all show a monotonic trend of increasing in flux from -band to m-band, and most of them show this trend starting in the -band. This flux-increasing trend closely resembles that of the “unusual infrared object” found by Dickinson et al. (2000) in the HDF-North, whose nature remains uncertain.
Here, we look for the simplest explanation for the IERO population as a whole. The red nature of these objects immediately leads to a number of broad possibilities: Galactic brown dwarfs, old and/or dusty galaxies, and objects at extremely high redshifts. We can rule out the possibility that they are stars in the Galaxy, because they are all resolved in the HST images (ACS and/or NICMOS). Furthermore, as 15 out of the 17 objects are visible in the ultra-deep optical images to at least -band, we can also reject the very-high-z () interpretation. In fact, most of these objects are visible even in -band, indicating that they reside at .
On the other hand, the IR parts of their SEDs seem to be consistent with those of evolved stellar populations. Indeed, a SED template of local E/S0 (e.g., Coleman, Wu & Weedman 1980) redshifted to 1–3 can reasonably fit most of the objects in the IR region. Such an empirical template, however, has a major drawback that its age ( Gyr) is much older than the age of the universe at the inferred redshifts. To overcome this problem, we explored the stellar population synthesis models of Bruzual & Charlot (2003), which provides the flexibility of adjusting the parameters of a model galaxy, especially its age and star-formation history. We used a Chabrier IMF (Chabrier 2003) and solar metallicity. As an extremely red color can also be produced by dust, we also considered the effect of dust using the extinction laws of Calzetti et al. (2000; at Å) and Fitzpatrick (1999; at Å).
For most of the IEROs, we find that the shape of their SEDs in the 1 to 8 m wavelength range is best explained by the presence of a well-evolved stellar component with ages in the range of 1.5–3.5 Gyr, observed at redshifts . The gentle curvature of the infrared SED is like that expected from older stars, whose flux density peaks around 1.6m in the rest frame (e.g., Simpson & Eisenhardt 1999). It is not well matched by models dominated by heavily dust-obscured, young starlight (Fig. 2, top panel). Although 1.5–3.5 Gyr-old stars formed in an instantaneous burst (or Simple Stellar Population; SSP) match the infrared SED well, such a model significantly under-predicts the observed optical (rest-frame ultraviolet) fluxes of these objects. We find that this can be solved by adding a weaker component of younger stars, which we model as a secondary instantaneous burst with an age of Gyr (Fig. 2, bottom panel). This two-component scheme can explain the majority of the IEROs if the composite spectra are put at the right redshifts. The best fit for each object requires fine-tuning the ages of both components, but this level of adjustment is not well motivated here, since other variables may also be important, including more complex past star formation histories, metallicity, and dust extinction. For the sake of simplicity, we choose to fit all 17 IEROs by the combination of a 2.5 and a 0.1 Gyr-old bursts, leaving only the redshift and the burst amplitudes as adjustable parameters. We emphasize that this two-component model is a highly simplified approximation to the actual physical processes and should not be over-interpreted. In particular, this model does not exclude the possibility that dust reddening may play a role in the galaxy colors, but simply emphasizes that the SED shape strongly favors the presence of a dominant older stellar population, formed at a significantly higher redshift than that at which the galaxy is observed. The young, secondary component represents weaker star formation that was on-going or recently completed at the observed redshift. The two-component model generally provides a much better fit than does the young, dusty model. As an example, the goodness-of-fit for any of the top panel models in Fig. 2 is 3–4 worse than the two-component fit shown in the bottom. The GOODS MIPS 24m observations will further help distinguish if any of these IEROs are dusty. For instance, if they have only an insignificant amount of dust, our two-component model predicts that the brightest IEROs have 24m flux densities only at 2Jy level and thus will not be seen even by the deep GOODS 24m observations. On the other hand, if the IEROs are very dusty, their 24m flux will be much higher and thus could possibly be detectable.
We also note that there is a degeneracy between the photometric redshift obtained during the fit and the ages of the components (especially the primary components). Choosing an instantaneous burst older than 2.5 Gyr as the primary component does not change significantly (at a level of ), but using a burst younger than 2.5 Gyr does tend to increase the derived , with in extreme cases. However, the overall values are not likely much different from the current fits, since the plausible templates can neither be much older than 2.5 Gyr because of the constraint from the age of the universe, nor much younger than 1.5 Gyr because of the shape of the SEDs.
Fig. 3 shows the SEDs of all 17 IEROs (filled boxes), along with the fitted two-component models (open boxes connected by dashed lines). Four of these objects have very uncertain photometric redshifts. Object #10 (the faintest in the sample) is only significantly detected in four of the bands considered here, and thus can be fitted by templates at a variety of redshifts. Object #1 and #2 do not have optical detections and can be fitted by templates over a large redshift range. They are noteworthy, however, as their estimated redshifts (3.6 and 3.4, respectively, albeit very uncertain), are the highest among the IEROs. The SED for object #5 is different from that of any other object in the sample, with steeply increasing flux density from 3.6 to 8m, and yields the worst fit from our chosen models. Therefore, these four objects are excluded from most of the discussion below. The remaining 13 objects have values ranging from 1.6 to 2.9, with the median at . The adopted model template is self-consistent with the redshift lower bound of , because it gives at , which does not meet our color selection criterion even considering systematic errors in photometry. We refer to the sample of these 13 objects as the refined sample. Their values are listed in Table 2. This table also lists the corresponding rest-frame absolute magnitudes of these objects, which are derived using the m measurements and the K-corrections based on the fitted model SED templates. The masses of the primary, older stellar components in the refined sample range from 0.1 to 1.6 (with a median value of 5), which are 0.1 to 2 the characteristic at from Cole et al. (2001; rescaled to account for the choice of the Chabrier IMF that we adopt here). Using a younger template, for example, a 1.5 Gyr-old template, will decrease the mass estimate by no more than a factor of two. The masses of the secondary bursts are 2–3 dex less. The median estimated masses of these objects is larger than the typical “best fit” stellar masses estimated by Papovich et al. (2001) for Lyman break galaxies (LBGs) at (, again adjusting for the choice of IMF) and larger than the LBG masses derived by those authors using their “maximum M/L” models.
Two of these IEROs, #7 and #9, are detected in X-ray by Chandra (Giacconi et al. 2001; XID 515 and 605, respectively). The X-ray hardness ratios of both sources are very high, indicative of heavily absorbed emission. Using the derived and assuming an intrinsic X-ray power-law slope of slope of , we estimate the obscuring column densities and the unobscured X-ray luminosities () in rest-frame 0.5–7keV. Source #7 has erg s-1 with ; for #9, which is detected solely in the hard 2–7 keV band, we obtain erg s-1, assuming a lower limit on intrinsic absorption . With X-ray luminosities far exceeding that of starburst galaxies ( erg s-1), these sources are likely obscured (Type 2) AGN, but are below the QSO regime ( erg s-1; see Norman et al. 2002). We estimate their observer-frame m AGN emission by extrapolating from the unobscured assuming a flat (e.g., Elvis et al. 1994). Even assuming negligible rest-frame NIR extinction, the predicted m contribution from the AGN would be 0.575 and 0.09 for #7 and #9, respectively, or 11% and 1.5% of the measured IERO flux densities. We therefore conclude that the AGN contribution to their optical-infrared SED is safely ignored and the fitting described above is not affected by the AGN.
4 Discussion
It is instructive to consider the relation between IEROs and other classes of faint, red galaxies, such as conventional EROs. From the magnitudes and the interpolated magnitudes listed in Table 1, one can see that nearly all IEROs do satisfy the conventional ERO criterion of mag (or mag). Are IEROs just EROs, but selected at redder wavelengths? The answer does not seem to be that simple, because we find that most bright EROs do not meet the IERO color criterion. Moustakas et al. (2004) present a sample of EROs in the CDF-S with mag, 16 of which are in the HUDF and match IRAC sources. However, none of these 16 EROs is selected as an IERO, either because they do not pass the color criterion or because their IRAC photometry is uncertain due to blending. As all but one of our IEROs have mag, it is important to consider fainter ERO samples. We use interpolated -band magnitudes and the ISAAC -band data to select a sample of 27 fainter EROs at mag. Two-thirds (18/27) of them match the initial list of 75 IERO candidates, including sources that we the rejected due to blending issues. Among these 18 fainter EROs, 13 match our IERO sample, i.e., roughly 50% (13/27) of this fainter sample of EROs qualify as IEROs. However, another 33% (9/27) do not match any IERO candidates.
Therefore, while most bright ( mag) EROs are not IEROs, there is a substantial (but not complete) overlap between the two selection criteria at fainter magnitudes. A consistent interpretation would be that the IERO color criterion picks up the fainter, higher redshift equivalents of conventional EROs. The photometric redshifts of our IEROs are at (possibly extending to ), with the median at . By contrast, redshifts (photometric and spectroscopic) for the Moustakas et al. ERO sample peak at (only a minority at ), with the median at . Furthermore, the (, 3.6m) filter pair samples roughly the same rest-frame wavelength range at as does the (, ) filter pair at , and corresponds to mag, i.e., the IERO criterion selects roughly the the same rest-frame feature at higher redshifts as the ERO criterion does at lower redshifts.
Several authors (e.g., Totani et al. 2001; Franx et al. 2003; Saracco et al. 2004; Chen & Marzke 2004) have used near-infrared colors to identify high redshift galaxy candidates. All of our IEROs with sufficiently deep – and –band photometry satisfy the mag criterion used by Franx et al., and have a similar surface density on the sky. Five IEROs also satisfy the mag criterion used by Totani et al. and Saracco et al. Most of these objects populate the more distant end of our photometric redshift range (). Chen & Marzke (2004) report nine faint, red galaxies selected from the HUDF ACS and NICMOS data, with mag and . Four of our IEROs (#1, 2, 8 and 9) are also in the Chen & Marzke list. Most of these authors have suggested that these red, IR-selected galaxies have relatively massive, old stellar populations at , although Totani et al. interpret them as highly obscured, star-bursting proto-ellipticals. By extending photometry to 8m with IRAC, we also find that the SED shapes for most of the IEROs favor the presence of dominant, old stellar populations.
If most of these IEROs are indeed at –2.9, their IR luminosities indicate that they are at the bright end of the luminosity function. The rest-frame -band absolute magnitudes of the objects in the refined sample range from to mag, while the median is at mag. Most of these objects are significantly brighter than the near-IR value in the local universe. For example, the 2MASS -band LF of Kochanek et al. (2001) gives for early type galaxies, which corresponds to mag.
A detailed treatment of the space density of IEROs is beyond the scope of this paper, and requires a more extensive analysis of source detection efficiency and incompleteness in the crowded IRAC images, which is presently underway. Here, we limit ourselves to some simple comparisons to the number density of local, early–type galaxies, which we regard as likely descendants of the IEROs. We assume the volume over which IEROs can be observed extends from , consistent with the lowest redshift at which an unreddened old stellar population should meet the IERO color criterion, to , the highest redshift for an object in the refined sample. The least luminous IERO (#12) in the refined sample has mag at . If we assume a roughly flat SED (in vs. ) in the IRAC bands (as is typically observed), and redshift it to , this galaxy would have mag, and would be easily detected with a formal point source S/N38. The actual detection likelihood will be smaller due to the blending, which affects our catalogs over a wide range of flux. We neglect this here, and naively assume that the refined sample represents a lower bound to a complete and volume-limited set of objects with mag at .
Within this volume, the refined IERO sample with mag has a space density of Mpc-3, of which the six most luminous objects (with mag; hereafter “the luminous subsample”) contribute Mpc-3. The actual number density of such objects is certainly larger, due to catalog incompleteness and the conservative screening process during the selection. We compare these number densities to those calculated by integrating the local –band LF for early–type galaxies (Kochanek et al. 2001). For the (unphysical) case of no evolution (NE), the local LF predicts 12.4 and objects per Mpc3 for and mag, respectively. The (likely incomplete) IERO sample therefore makes up 25% of the number density of early–type galaxies with comparable luminosities in the local universe, while the luminous subsample has virtually the same space density as for comparably luminous local ellipticals. We might assume instead that the IERO population undergoes pure luminosity evolution (PLE) down to the present day. A simple, single–age stellar population fades by 1.0 mag in the rest–frame –band from an age of 2.5 to 13 Gyr (Bruzual & Charlot 2003). In this scenario, the entire refined sample and the luminous subsample make up 14% and 20% of the corresponding local number densities of early–type galaxies with and mag, respectively. We note that the galaxies in the luminous subsample are found entirely at the upper end of the redshift range, , and if this volume were used instead, their space densities would be 2.55 larger, making up 51% of the local population under the PLE model to mag.
The HUDF samples a small cosmic volume, and we may expect the most luminous and massive galaxies to cluster strongly, potentially leading to large field–to–field variance in the densities. We must therefore regard these simple estimates with caution, pending analysis of the full GOODS area, with proper treatment of sample incompleteness (although we note that only the HUDF has sufficiently deep optical imaging data to enable firm color constraints on IEROs down to the flux limit of the Spitzer IRAC images). Nevertheless, we may say that the IEROs appear to be a significant and numerous population of objects, most naturally interpreted as galaxies with relatively old and massive stellar populations at .
To summarize, using the first epoch of the GOODS Spitzer Legacy Program observations in the CDF-S, we have identified 17 well-isolated objects in the HUDF that are significantly detected by IRAC but are very faint in the ACS images. Their SEDs are best explained by the presence of an old ( to 2.5 Gyr) stellar population in galaxies at . A few of the objects may have higher redshifts, but this is yet uncertain. The old stars dominate the infrared light, with a median rest-frame -band luminosity that is that of present–day early-type galaxies, and stellar masses to for a Chabrier IMF. They are substantially more massive than typical Lyman break galaxies at similar redshifts. A much smaller component of recent star formation is needed to explain the optical (rest-frame UV) portion of the SED. The IEROs are likely the higher-redshift analogs of conventional EROs, selected via similar color criteria applied at longer wavelengths. The GOODS IRAC observations contribute to the mounting evidence for a significant population of red, evolved galaxies at high redshifts. In a simple PLE scenario, the IEROs may be direct progenitors for at least 14 to 51% of the local population of massive, early-type galaxies.
References
- (1) Bertin, E. & Arnouts, S. 1996, A&AS, 117, 393
- (2) Bruzual, A. G. & Charlot, S. 2003, MNRAS, 344, 1000
- (3) Calzetti, D., et al. 2000, ApJ, 533, 682
- (4) Chen, H.-W. & Marzke, R. 2004, submitted to ApJL (astro-ph/0405432)
- (5) Chabrier, G. 2003, PASP, 115, 763
- (6) Cole, S., et al. 2001, MNRAS, 326, 255
- (7) Coleman, G. D., Wu, C.-C., & Weedman, D. W. 1980, ApJS, 43, 393
- (8) Daddi, E., Cimatti, A., & Renzini, A. 2000, A&A, 362, L45
- (9) Dickinson, M., et al. 2000, ApJ, 531, 624
- (10) Elstion, R., Rieke, G. H., & Rieke, M. J. 1988, ApJ, 331, L77
- (11) Elvis, M., et al. 1994, ApJS, 95, 1
- (12) Fazio, G. G., et al. 2004, accepted for publication in ApJS (astro-ph/0405616)
- (13) Fitzpatrick, E. L. 1999, PASP, 111, 63
- (14) Franx, M., et al. 2003, ApJ, 587, L79
- (15) Giacconi, R., et al. 2001, ApJ, 551, 624
- (16) Hu, E. M. & Ridgway, S. E. 1994, AJ, 107, 1303
- (17) Kochanek, C. S., et al. 2001, ApJ, 560, 566
- (18) McCarthy, P. J., Persson, S. E., & West, S. C. 1992, ApJ, 386, 52
- (19) Moustakas, L. A., et al. 2004, ApJ, L131
- (20) Norman, C., et al. 2002, ApJ, 571, 218
- (21) Papovich, C., Dickinson, M & Ferguson, H. C. 2001, ApJ, 559, 620
- (22) Scodeggio, M. & Silva, D. R. 2000, A&A, 359, 953
- (23) Simpson, C. & Eisenhardt, P. 1999, PASP, 111, 691
- (24) Thompson, D., et al. 1999, ApJ, 523, 100
- (25) Totani, T., Yoshii, Y., Iwamuro, F., Maihara, T., & Motohara, K., 2001, ApJ, 558, L87
- (26) Werner, M. W., et al. 2004, accepted for publication in ApJS (astro-ph/0406223)
- (27) Yan, H. & Windhorst, R., 2004, accepted for publication in ApJL (astro-ph/0407493)
- (28) Yan, L., McCarthy, P. J., Weymann, R. J., Malkan, M. A., Teplitz, H. I., Storrie-Lombardi, L. J., Smith, M., & Dressler, A. 2000, AJ, 120, 575


| ID | RA&DEC(J2000) | m() | m() | m() | m() | |||||||||
|---|---|---|---|---|---|---|---|---|---|---|---|---|---|---|
| 1 | 3:32:42.86 -27:48:09.29 | — | 27.010.10 | 24.630.02 | 23.630.09 | 21.990.01 | 21.860.02 | 21.350.07 | 21.390.09 | |||||
| 2 | 3:32:38.74 -27:48:39.96 | — | 26.580.05 | 24.680.01 | 24.280.24 | 22.100.01 | 21.880.01 | 21.670.05 | 21.780.07 | |||||
| 3 | 3:32:43.52 -27:46:38.96 | 30.140.48 | 28.140.06 | (28.15) | 28.180.07 | 27.910.09 | — | — | 23.650.18 | 22.280.01 | 21.790.01 | 21.380.05 | 21.410.05 | 178.8 |
| 4 | 3:32:41.74 -27:48:24.84 | 30.220.36 | (29.54) | 28.880.12 | 27.960.09 | 25.880.03 | 24.600.01 | 23.820.11 | 22.400.01 | 22.260.02 | 22.300.12 | 22.690.20 | 167.3 | |
| 5 | 3:32:43.66 -27:48:50.69 | 29.710.23 | 29.330.11 | (29.32) | 29.290.12 | 28.760.13 | — | — | 23.280.03 | 22.920.04 | 22.370.11 | 21.190.05 | 156.6 | |
| 6 | 3:32:33.25 -27:47:52.19 | 29.750.50 | 28.960.17 | (28.60) | 28.150.09 | 27.200.06 | 26.140.05 | 24.880.02 | 24.170.18 | 22.500.02 | 22.690.04 | 22.770.24 | 23.220.40 | 75.4 |
| 7 | 3:32:32.16 -27:46:51.60 | 28.720.16 | 27.360.03 | (27.19) | 26.940.03 | 26.710.04 | — | — | 23.730.15 | 22.150.01 | 21.930.02 | 21.630.07 | 21.610.07 | 67.1 |
| 8 | 3:32:35.06 -27:46:47.46 | 27.940.11 | 26.670.02 | (26.51) | 26.260.02 | 25.860.02 | 25.110.04 | 23.420.01 | 22.820.06 | 21.440.01 | 21.370.01 | 21.010.05 | 21.140.06 | 58.6 |
| 9 | 3:32:39.16 -27:48:32.44 | 27.520.04 | (27.01) | 26.440.02 | 26.120.02 | 25.450.03 | 23.360.01 | 22.870.06 | 21.930.01 | 21.950.02 | 21.740.10 | 22.100.16 | 47.6 | |
| 10 | 3:32:37.15 -27:48:23.54 | (30.38) | 29.260.12 | 28.490.10 | 24.380.09 | 24.620.21 | 44.3 | |||||||
| 11 | 3:32:30.26 -27:47:58.24 | 29.810.50 | 28.500.10 | (28.06) | 27.550.05 | 26.960.05 | — | — | 23.870.14 | 22.960.01 | 22.830.02 | 22.860.10 | 22.910.12 | 39.8 |
| 12 | 3:32:29.82 -27:47:43.30 | 30.110.45 | 27.870.04 | (27.53) | 27.100.02 | 26.980.03 | — | — | 24.180.14 | 23.300.03 | 23.310.05 | 23.240.27 | 23.710.44 | 29.4 |
| 13 | 3:32:39.11 -27:47:51.61 | 28.870.16 | 27.110.02 | (26.79) | 26.370.01 | 25.570.01 | 24.400.01 | 23.230.01 | 22.640.05 | 21.980.01 | 22.030.02 | 21.870.08 | 22.680.18 | 27.2 |
| 14 | 3:32:48.55 -27:47:07.58 | 29.320.45 | 27.120.04 | (26.35) | 25.630.01 | 24.730.01 | — | — | 21.890.04 | 21.300.01 | 21.270.01 | 21.790.10 | 22.470.20 | 23.6 |
| 15 | 3:32:38.76 -27:48:27.07 | 28.540.18 | 27.210.04 | (27.12) | 26.970.03 | 26.840.05 | 26.270.04 | 24.790.02 | 24.560.23 | 23.410.04 | 23.340.06 | 23.320.31 | 23.120.29 | 23.6 |
| 16 | 3:32:35.71 -27:46:38.96 | 27.260.04 | 26.680.02 | (26.40) | 26.020.01 | 25.540.01 | 24.940.03 | 24.100.02 | 23.340.08 | 22.140.01 | 22.100.01 | 22.000.08 | 22.080.08 | 23.0 |
| 17 | 3:32:33.67 -27:47:51.04 | 28.450.19 | 26.760.03 | (26.27) | 25.720.01 | 24.970.01 | 23.560.01 | 22.670.00 | 22.390.04 | 21.710.01 | 21.760.01 | 21.950.07 | 22.240.10 | 20.1 |
| ID | m(3.6) | K-correction | |||
|---|---|---|---|---|---|
| 21.99 | 3.6 | — | — | — | |
| 22.10 | 3.4 | — | — | — | |
| 3 | 22.28 | 2.9 | |||
| 4 | 22.40 | 2.7 | |||
| 23.28 | 2.8 | — | — | — | |
| 6 | 22.50 | 2.3 | |||
| 7 | 22.15 | 2.7 | |||
| 8 | 21.44 | 2.9 | |||
| 9 | 21.93 | 2.8 | |||
| 24.38 | 2.1 | — | — | — | |
| 11 | 22.96 | 2.4 | |||
| 12 | 23.30 | 1.9 | |||
| 13 | 21.98 | 1.9 | |||
| 14 | 21.30 | 1.6 | |||
| 15 | 23.41 | 2.7 | |||
| 16 | 22.14 | 2.4 | |||
| 17 | 21.71 | 1.6 |