Discovery of high-amplitude X-ray variability in the Seyfert–LINER transition galaxy NGC 7589
Abstract
We present the first result of a programme to search for large flux variations in the X-ray sources of the XMM Serendipitous Survey compared to previous ROSAT observations. An increase in X-ray flux by a factor 10 was discovered from the nucleus of the galaxy NGC 7589 on a timescale of less than 5 years. The 0.4–10 keV XMM spectrum can be approximated by a power-law with photon index of 1.7–1.8, though it seems to flatten above 5 keV, suggesting a possible complex model, such as partial covering or disc reflection. A classification based on an analysis of its optical spectrum places NGC 7589 in the Seyfert region, but close to the Seyfert–LINER border-line on the AGN diagnostic diagrams. We classify NGC 7589 as either Seyfert 1.9 or LINER I, in the light of the detection of a broad H line, which makes NGC 7589 an AGN in the low-luminosity regime. We interpret the observed variability in terms of either changes in covering factor of absorbing gas in the AGN, or variability in the intrinsic X-ray luminosity. Should the latter be the case, the inferred Eddington accretion rate increased from the radiatively inefficient accretion dominated regime to a value close to the putative critical value, at which a transition of the accretion mode is supposed to take place. This possibility presents a new prospect of studying accretion physics in the central black holes of external galaxies by direct observing changes of ‘spectral state’, as is common in stellar black hole binary systems.
keywords:
galaxies: active galaxies: individual: NGC 7589 - X-ray: galaxies1 Introduction
In contrast to typical active galactic nuclei (AGN), low luminosity AGNs (LLAGNs) as a class radiate at a power much lower than the Eddington luminosity111=1.26 , is black hole mass in M☉., i.e. in terms of the bolometric/Eddington luminosity ratio (Eddington ratio), 0.01 (Ho 2004). As such, black holes in LLAGNs are hypothesised to accrete via radiatively inefficient accretion flows (RIAF, see Quataert 2001 for a review), such as an advection-dominated accretion flow (ADAF, see Narayan et al. 1998 for a review), rather than an optically thick, geometrically thin standard accretion disc (thin disc hereafter, Shakura & Sunyaev 1973). In fact, the high-end of their distribution encompasses the critical value222Hypothesised as 0.01–0.1 Eddington ratio for ADAF (Narayan et al. 1998); however, observations show that the transition always occurs at a luminosity around (e.g. Tanaka 1999), which corresponds to a few per cent Eddington ratio. above which a RIAF is to be replaced with a standard thin disc. As a consequence, in LLAGNs exhibiting violent variability of luminosity, a transition of the accretion mode is expected to take place once crosses the critical value. This is where observations can be used to test black hole accretion theories. While such a transition of the accretion mode can, indeed, explain the observed changes of the ‘spectral states’ in X-ray binaries (e.g. Esin et al. 1997, Meyer et al. 2000), the situation is not clear in massive extragalactic black hole systems. On galactic scales the major difficulty in observations is the long timescales of the X-ray variability, which is roughly scaled with the black hole mass. Timely detection of violent variability in AGN, especially in LLAGN, is of particular interest with this regard.
About 40 per cent of nearby galaxies exhibit LLAGN activity (Ho et al. 1997), the majority among of belong to a class known as low-ionisation nuclear emission-line regions (LINER, Heckman 1980). Large amplitude X-ray variability is sometimes seen in low luminosity Seyferts (e.g. Nandra et al. 1997), whereas no similar behaviour is found in LINERs (e.g. Ptak et al. 1998, Komossa et al. 1999, Terashima et al. 2002).
In this letter we report the discovery of large amplitude X-ray variability in the galaxy NGC 7589 at a redshift of 0.0298. This is one of the first results of a search of long-term highly variable X-ray sources (in preparation; see also Yuan et al. 2002) of the XMM Serendipitous Survey (Watson et al. 2002). We selected candidates which varied by a factor of at least 10 for further follow-up studies in the X-ray and other wavebands. We used a luminosity distance of 123.3 Mpc calculated from the radial velocity of 8562 km s-1 (LEDA) relative to the cosmic microwave background by assuming =71 km s-1 Mpc-1, =0.73, and =0.27.
2 The XMM X-ray data of NGC 7589
2.1 XMM observations
The XMM observations, data screening, and source extraction are summarised in Table 1. It should be noted that the PN camera was not active during the first observation in the XMM orbit 272. The XMM Science Analysis System (SAS, v.5.4) was used for data reduction. Source X-ray events were extracted from a circle of 32 ″radius. Background events were extracted from source-free regions using a concentric annulus of 40/120 ″radii for the MOS detectors, and circles of 32 ″radius at the same CCD read-out column as the source position for the PN detector.
| orbit number | orbit 272 | orbit 361 | |
|---|---|---|---|
| detectors | MOS1/2 | MOS1/2 | PN |
| date | Jun. 03 2001 | Nov. 11 2001 | |
| observation ID | 0066950301 | 0066950401 | |
| duration (ks) | 12.2 | 12.6 | 13.2 |
| GTI CRa | 0.35 | 0.35 | 1.0 |
| events pattern | 0–12 | 0–12 | 0–4 |
| good exposure (s) | 7366/7151 | 9175/9826 | 8133 |
| net source CTS | 555/503 | 243/276 | 843 |
| src CR () | 7.5/7.0 | 2.6/2.8 | 10.4 |
-
a
Count rate criteria for rejecting high-background periods identified by single events (PI, Pattern=0) in units of .
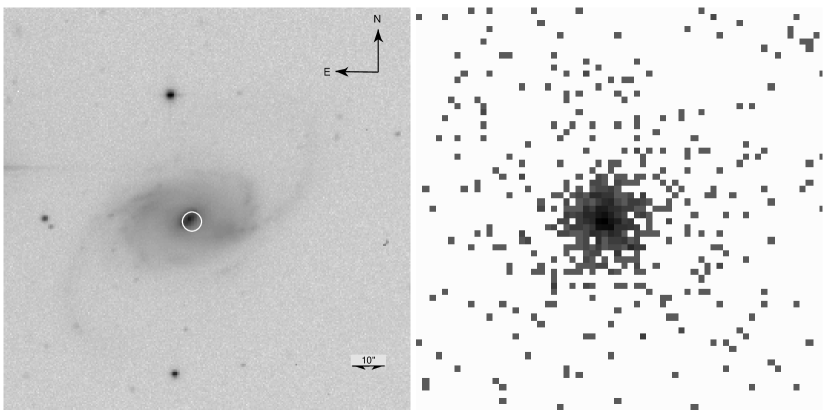
In both observations an X-ray source was detected at the position RA=23h 18m 15.6s, Dec=0o 15′38.9″(J2000), coincident with the nucleus of NGC 7589 (Fig. 1). The source spatial profile in the 0.3–2keV band was found to be point-like. No time variability was found on timescales shorter than the XMM observational intervals of about 12 ksec. The galaxy was also observed with the XMM Optical Monitor (OM) with the UVW1 filter (2000–4000Å) and was detected as an extended source.
2.2 The XMM X-ray spectra and fluxes
The MOS1 and MOS2 spectra were co-added to produce a single, combined spectrum. We used XSPEC (v.11.3) for spectral modelling. Spectral bins below 0.4 keV were excluded because of uncertain calibration below 0.35 keV (XMM-SOC-CAL-TN-0018). From orbit 361 we have both PN and MOS spectra; they were jointly fitted with independent normalisations. In comparisons of the two observations, the fitted spectral parameters agree with each other for most or all the parameters except the normalisations, which differ by a factor of . To improve photon statistics, we also performed fits to the two spectra from the different epochs with most of the parameter values tied together. The results are summarised in Table 2 and explained in below.
Power-law models: A simple absorbed power law gives statistically acceptable fits to all the spectra; however, the fitted is lower than the Galactic HI column density along the line-of-sight =4.06 (at the 92 per cent confidence level). The fits over the restricted 0.4–2 keV and 2-10 keV ranges yielded =1.720.12 and =1.42, respectively, indicating a spectral flattening towards high energies. This can be seen from the residuals in Fig. 2, which compares the data to a fitted model using only the 0.4–2 keV spectra. In fact, a broken power-law model of =1.75 and =1.03 improved the fit significantly, with for 2 additional free parameters; the -test gave a probability level for no improvement over power-law as being 1 per cent. The fitted was also recovered to value consistent with .

Complex spectral models: Spectral flattening is often seen in AGNs as a result of scattered X-rays, likely by an accretion disc, or X-rays transmitted through optically thick gas. Accordingly, we fit disc reflection and partial covering models to the spectra. Both types of models, either cold or ionised, were found to provide excellent and statistically indistinguishable fits to all the data. The overall absorption values were in general consistent with . The disc inclination was not constrained and so was fixed at 30 degrees. The disc reflection models require a larger reflection/direct ratio (i.e. ) than that from a medium subtending a solid angle, implying that the primary continuum is partially obscured in this case. No significant iron K line was seen at around 6.4 keV; 90 per cent upper limits for the line equivalent width were found to be 550 eV and 110 eV for the 1st and 2nd observations, respectively. Modelling the high-energy excess simply by an extremely broadened iron line (the diskline model) gave no satisfactory fit.
| data set | orbit 272 | orbit 361 | both orbits |
| detectors | MOS | MOS+PN | orb272/orb361 |
| power law, fixed = =4.06 | |||
| 1.690.09 | 1.680.08 | 1.680.06 | |
| / | 14.20.9 | 5.50.5 | 14.11.0 /5.40.5 |
| /dof | 44/39 | 58/62 | 103/102 |
| partial covering by cold matter, = | |||
| 1.80 | 1.74 | 1.77 | |
| / | 30 | 48 | 40 |
| covering factor | 0.54 | 0.54 | 0.55 |
| /dof | 38/37 | 55/60 | 93/100 |
| partial covering by ionised absorber (absori), = | |||
| 1.77 | 1.73 | 1.75 | |
| / | 70-56 | 74-61 | 76-30 |
| 123 | 31 | 137/60 | |
| covering factor | 0.54 | 0.55 | 0.53 |
| /dof | 37/35 | 55/58 | 92/96 |
| reflection from cold disc (pexrav), fixed =4.06 | |||
| 1.85 | 1.74 | 1.79 | |
| rel-refl | 8.0 | 3.5 | 5.9/5.0 |
| /dof | 38/38 | 56/61 | 95/100 |
| reflection from ionised disc (pexriv), fixed = | |||
| 1.77 | 1.73 | 1.75 | |
| 157 | 3 | 186/4 | |
| rel-refl | 3.5 | 3.3 | 3.2 |
| /dof | 37/37 | 56/60 | 94/99 |
Errors are at the 90 per cent level when quoted;
if not given they are not
constrained within the physically meaningful ranges.
: column density in units of cm-2
: normalization at 1 keV in units of
phot cm-2 s-1 keV-1;
values quoted are for the combined MOS detectors.
rel-refl: factor of reflection relative to the primary continuum.
: ionisation parameter defined as
for absorber with density at a distance to a source
with an ionising luminosity
(Done et al. 1992).
X-ray fluxes and luminosities: The X-ray fluxes were calculated using the best-fit power-law spectral model with =, i.e. =1.68 (1.73) for 0.5–10 (0.5-3) keV. In the 0.5–10 keV band, the Galactic absorption corrected fluxes are 9.1 and 3.7 , for orbits 277 and 361 respectively, which correspond to luminosities of 1.7 and 0.7 , respectively. In consideration of the likely presence of the partial covering or disc reflection (assuming a flat disc subtending a 2 solid angle) component, the intrinsic X-ray luminosities are likely a factor of 2 and 3–5 higher, respectively.
3 The long-term X-ray variability
3.1 Fluxes from the ROSAT and Einstein data
NGC 7589 was within the field of view (10 arcmin off-axis) of a 5.4 ksec pointing observation made by ROSAT with its PSPC detector (0.1–2.4 keV) on 16–17 June, 1995. No source was detected at the position of NGC 7589. We derived a limit on the source flux in two ways. The first was a simple estimate using the countrate of the weakest detected source neighbouring NGC 7589. This led to a conservative upper limit on the source count rate of 2.7 . A more rigorous estimation was made using the PSPC X-ray image. Photon counts from the background and a possible source were extracted from a circle of 45 ″radius (enclosing 95 per cent power of the PSF) at the position of NGC 7589, yielding a measured Cs+b=17 cts. Following Poisson statistics, the expected counts C̄s+b is distributed as C̄24 (27) at the (one-tail) probability of 95 (99) per cent. The contribution of the background was estimated as Cb=9.5 cts, using the averaged local background estimated from an annulus of of 90″/225″radii. The expected net source counts was estimated to be C̄ C̄s+b-Cb=14.5 (17.5) cts. After correction for the vignetting and extraction aperture, the source count rate was estimated to be 2.9 (3.4) . Assuming the spectrum to be the same as that measured with XMM, we derived the 0.1–2.4 keV flux limit to be 5.9 (7.0) at the 95 (99) per cent level, after correction for the Galactic absorption.
A less stringent flux limit of 5.6 was set by the data extracted from the ROSAT All-sky Survey performed in 1992. By searching the data archives of various X-ray satellites, we found that, in addition to ROSAT, NGC 7589 was also serendipitously observed by the Einstein Observatory with its IPC detector at an off-axis angle of 10.8 arcmin for 2540 sec in May 1980. Similar estimation using a source extraction radius of 3′, yielded a limit on the unabsorbed flux of 3.5 . Both limits are quoted at the 95 per cent level.
3.2 Variability in the X-rays and UV
For comparison of the fluxes among the different missions we used the overlapping 0.5–2.4 keV energy band. The light curve in Fig. 3 reveals a dramatic increase in luminosity, by a factor of 10, occurring sometime between the ROSAT pointing and the XMM observation in orbit 272, on a timescale 5 years. Given the poor sampling, the flux seen by XMM may not represent the flux at the ‘highest state’, which means that the peak luminosity could be even higher. Therefore the actual variability amplitude must be 10. The flux decreased by a factor of 2.5 between the two XMM observations over a period of 5 months, whereas the overall 0.4–10 keV spectral shape appeared to remain unchanged.
The OM UV magnitude within a central 6″-radius aperture was measured to be 16.990.06 and 17.030.05 for the orbit 272 and 361, respectively. However, the emission is dominated by the extended bulge and no significant point-like source is present; thus no meaningful constraint on variability could be obtained.

4 Optical spectroscopic classification
NGC 7589 was observed spectroscopically in the Sloan Digital Sky Survey (SDSS; York et al. 2000) on Sep. 29th, 2000, about 8 months prior to the high state caught by XMM. The spectrum was taken from the SDSS Data Release 2. The contribution of stellar light from the host galaxy was subtracted from the observed spectrum by modelling stellar absorption lines employing a range of galaxy spectral templates, using the method developed by Li et al. (2004) (A full account of the spectral analysis and estimation of the black hole mass for NGC 7589 is to be presented elsewhere.) Single-component Gaussians were fit to the emission lines. This provided satisfactory fits, except for H which required the presence of a second, broad component. The broad H line, which was blueshifted, had a width of FWHM 3428 km s-1, compared to the narrow lines of FWHM 228 km s-1.
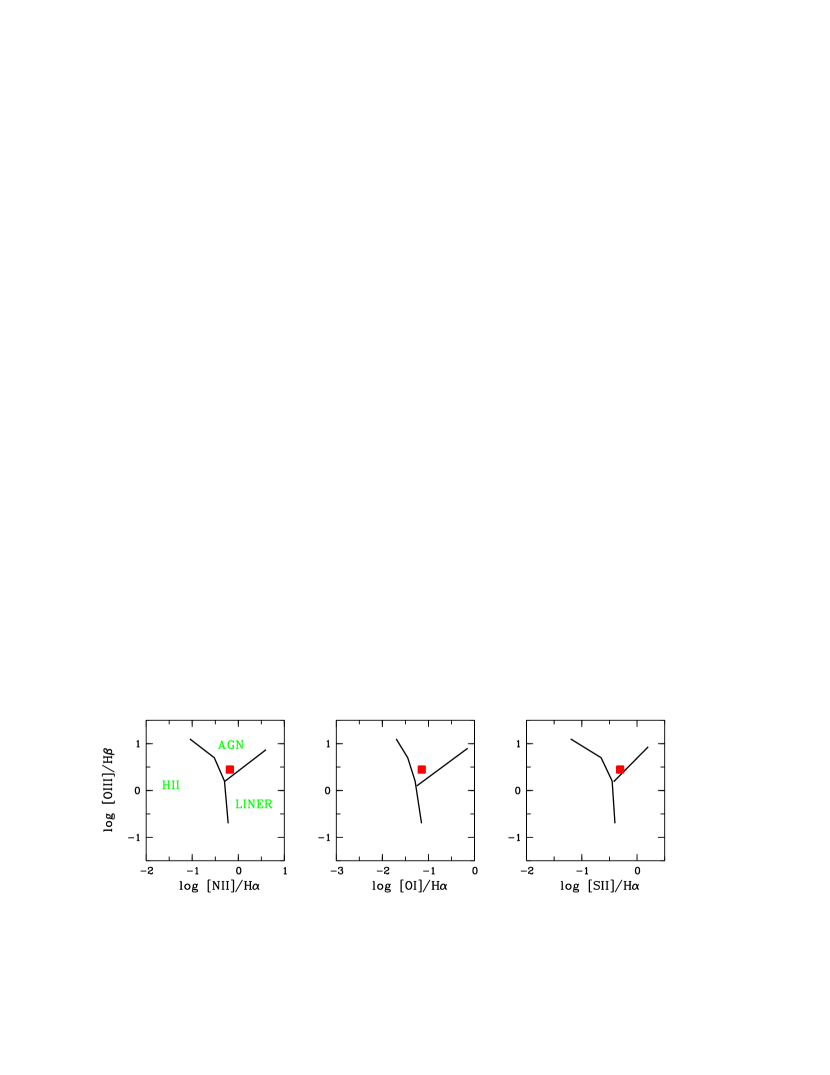
The emission-line ratios place NGC 7589 in the Seyfert region of the diagnostic diagrams of Veilleux & Osterbrock (1987), close to the border-line with the LINERs (see Fig. 4). The same conclusion also holds if we use the classical definition of LINERs (Heckman et al. 1980) which only makes use of Oxygen emission-line ratios. For LINERs, [OII]3727/[OIII]50071 and [OI]6300/[OIII]50071/3 (and lower for ‘[OI]-weak’ LINERS), while NGC 7589 shows [OII]3727/[OIII]5007 0.5 and [OI]6300/[OIII]5007 = 0.1. This places NGC 7589 in a region populated by Seyferts (see Fig. 1b of Filippenko & Terlevich 1992) but, again, close to the borderline with LINERs. We note that the measured line ratios are insensitive to the galaxy spectrum subtraction—the same result holds even the unsubtracted spectrum was used. The detection of a broad component in H reveals a type-I AGN and leads to the classification of NGC 7589 as either a Seyfert 1.9 or possibly a LINER I.
5 Discussion
5.1 Classification of NGC 7589
On the classification diagrams based on emission line ratios, the distribution of the LLAGNs in the Ho et al. (2004) sample has a continuous and smooth transition between Seyferts and LINERs. This makes the conventional, ‘operational’ dividing lines somewhat arbitrary and physically insignificant. NGC 7589 falls within the area in which galaxies are classified as Seyferts, however, it is too close to the border region to allow an ultimate classification as either a Seyfert or LINER. A similar conclusion holds when the emission line width is considered (e.g. Ho et al. 2003). We therefore treat NGC 7589 as a member of the important ‘border-line objects’, which probe the physics in transition from Seyfert to LINER. Optically NGC 7589 is a giant, bulge-dominated low surface brightness galaxy (Pickering et al. 1997).
The high-amplitude X-ray variability detected is exceptional, given the transition nature of NGC 7589. While there is a trend in Seyferts showing enhanced X-ray variability with decreasing luminosity (e.g. Nandra et al. 1997), the trend breaks at low luminosities; in particular LINERs do not vary much in X-rays (e.g. Ptak et al. 1998, Komossa et al. 1999, Terashima et al. 2002). Those that do rarely exceed a factor of two variability. The high-amplitude variation in the X-ray luminosity of the order of magnitudes of on timescales of a few years suggests black hole accretion as the ultimate source of the power in NGC 7589 . This is in line with the AGN nature of NGC 7589 indicated by the broad line.
We may ask whether the XMM ‘high-state’ or the ROSAT ‘low-state’ is more representative of the average X-ray luminosity. We assume that the narrow line luminosities in the SDSS spectrum represents the average state of NGC 7589. By making use of the correlation for LLAGN (Halderson et al. 2001), a luminosity of 1 (1.5 ) is predicted in the 0.1–2.4 keV (0.5–10keV) band assuming = 1.7. This value is significantly below the high-state luminosity, and is comparable to the low-state upper limit. This suggests that probably NGC 7589 normally behaves like a LLAGN, and underwent an outburst that was caught by XMM. At the high-state, reached the lower end of typical Seyfert luminosity range ( ), and the very upper end of LINERs. The power-law model is again consistent with both Seyfert and LINER types, while the partial covering/reflection model would favor a Seyfert.
5.2 The X-ray variability
In general, X-ray variability in AGN may have two distinct origins: variations in intrinsic radiation and variations in absorption/obscuration. Below we discuss briefly our results in this context. For NGC 7589, the mass of the central black hole is of the order of M☉, as found in our on-going follow-up work (in preparation).
Variable absorption: Evidence for variable absorption has been found in some Seyfert galaxies, especially in type 2 and intermediate-type, on timescales of months to years (e.g., Risaliti et al. 2002) through variation of and/or covering factor (e.g. NGC 3227: Komossa et al. 2001, NGC 3516: Guainazzi et al. 2001). The absorbers are postulated to be gas clouds in the ‘broad-line region’ (BLR) producing relatively fast variations, and a parsec-scale ‘torus’ producing relatively long-term variations. In particular, NGC 7589 might be an analogue to the LLAGN in M 51, in which a suspected large-amplitude X-ray variation could be well explained by placing a thick () absorber on and off the line-of-sight (Fukazawa et al. 2001).
For the ROSAT low-state, taking the best-fit cold partial covering model for the XMM spectrum at the highest state (Table 2) and increasing artificially the covering factor up to , the soft X-ray flux was then suppressed below the ROSAT detection limit. For the flux decrease between the two XMM observations, we considered the joint fit with the partial covering model (Table 2) by assuming the continuum levels to be the same and tieing them together, and we still obtained an acceptable fit, though slightly worse than that in Table 2; this yielded a much larger value of and covering factor (8.0 and 0.72) at the epoch of orbit 361 than those of orbit 272 (1.9 and 0.29). Both the timescales of 5 years and of 5 months are consistent with the motion of gas clouds (3,400 km s-1) in the BLR for a M☉ black hole.
Variable intrinsic emission: For the ROSAT low-state, the Eddington ratio was estimated conservatively to be several times , much lower than the critical accretion rate (see Sect. 1). This value indicates that the accretion proceeded via a RIAF. A RIAF has been postulated to be present in some LLAGN (e.g. Fabian & Rees 1995, Lasota et al. 1996, Quataert et al. 1999, Ptak et al. 2004). In particular, the proto-type of such a class, the LINER NGC 4258 (Lasota et al. 1996), has values of and similar to those we found for NGC 7589. A thin disc would be truncated and only exist at large radii (e.g. Quataert et al. 1999, Lu & Wang 2000, Meyer & Meyer-Hofmeister 2002). The broad iron line and reflection hump, which are characteristic of typical Seyferts and believed to be evidence for a thin disc, are not expected to be seen in a RIAF. These different accretion modes also predict distinct spectral shapes in the broad band spectral energy distribution (SED) and possibly in the X-ray spectra. Therefore a good X-ray spectrum and/or SED in a low-state is essential to test the RIAF hypothesis.
In the XMM high-state, the identification of the accretion mode is not clear. The was estimated to be a few per cent, which is immediately close to the critical value. Thus the accretion flow was possibly in a transition state between a RIAF and a thin disc. Had the flux ever reached a peak much higher than the XMM high-state sometime between the observations, a transition of the accretion mode might have taken place, according to the current accretion theories. The observed timescale of 5 years is consistent with the mass diffusion timescale on which a thin disc drifted inwards down to several from a transition radius of up to hundreds . However, the quality of the obtained X-ray spectra does not allow to distinguish a dominating thin disc (extending down to a few Schwarzschild radii ) and a disc truncated at hundreds , though the probable spectral flattening—if this is indeed due to reflection of the X-rays, would favour the former. Deep X-ray observations for NGC 7589 and of other objects of this kind are essential to confront seriously current accretion theories.
Large (by a factor of 10 or higher) X-ray variability events appear to be rare. The first results from our programme, which searched over 386 XMM fields previously covered with ROSAT pointed observations, yielded only one, or possibily two, detections. The total sky area covered (66 sqr. deg.) contains, statisically, 26 galaxies brighter than 15 magB and 180 galaxies brighter than 16.4 magB (cf. NGC 7589 of 15.2 magB). A further extensive search, as well as the measurement of the variability timescale, is needed in order to be able to estimate the event rate.
Acknowledgements
We thank Cheng Li and Tinggui Wang for helping with the subtraction of the stellar spectrum, and Christopher Brindle for help in verifying the XMM OM results. W.Y. thanks Matteo Guainazzi for useful discussion. Funding for the creation and distribution of the SDSS Archive has been provided by the Alfred P. Sloan Foundation, the Participating Institutions, the National Aeronautics and Space Administration, the National Science Foundation, the U.S. Department of Energy, the Japanese Monbukagakusho, and the Max Planck Society. This research has made use of the NASA/IPAC Extragalactic Database (NED).
References
- (1) Done et al. 1992, ApJ 395, 275
- (2) Esin A.A., et al., 1997, ApJ 489, 865
- (3) Halderson E., et al., 2001, ApJ 122, 637
- (4) Fabian A.C. & Rees M.J., 1995, MNRAS 277, L55
- (5) Filippenko A., Terlevich R., 1992, ApJ 379, L79
- (6) Fukazawa Y., et al., 2001, A&A 374, 73
- (7) Guainazzi M., et al., 2001, MNRAS 323, 75
- (8) Heckman T., 1980, A&A 87, 152
- (9) Ho L.C., Filippenko A.V., Sargent W.L.W., 1997, ApJ 487, 568
- (10) Ho L.C., Filippenko A.V., Sargent W.L.W., 2003, ApJ 583, 159
- (11) Ho L.C., 2004, in Carnegie Observatories Astrophysics Series, Vol. 1: Coevolution of Black Holes and Galaxies,, ed. L.C. Ho (Cambridge: Cambridge Univ. Press), in press
- (12) Komossa S., Böhringer H., Huchra J., 1999, A&A 349, 88
- (13) Komossa S., Burwitz V., Predehl P., Kaastra J., 2001, in proc. The central kpc of starbursts and AGN, Knapen J.H. et al. (eds), ASP conf. series 249, 411
- (14) Lasota J.-P., et al., 1996, ApJ 462, 142
- (15) Li C., Wang T., Zhou H., et al., 2004, astro-ph/0407015
- (16) Lu Y. & Wang T., 2000, ApJL 537, 103
- (17) Meyer F., Liu B.F., Meyer-Hofmeister E., 2000, A&A 354, L67
- (18) Meyer F. & Meyer-Hofmeister E., 2002, A&A 392, L5
- (19) Narayan R., Mahadevan R., Quartaert E., 1998, in: The Theory of Black Hole Accretion Discs, eds. M.A. Abramowicz et al., Cambridge University Press, p.148
- (20) Nandra K., et al., 1997, ApJ 476, 70
- (21) Pickering T.E., et al. 1997, AJ 114, 1858
- (22) Ptak A., et al., 2004, ApJ 606, 173
- (23) Ptak A., et al., 1998, ApJL 501, 37
- (24) Quataert E., et al., 1999, ApJL 525, 89
- (25) Quataert E.,2001, in proc. Probing the physics of active galactic nuclei by multiwavelength monitoring eds. Peterson B.M., et al., p71
- (26) Risaliti G., ELvis M., Nicastro F. 2002, ApJ 571, 234
- (27) Shakura N.I, & Sunyaev R.A., 1973, A&A 24, 337
- (28) Tanaka Y.,1999, in: Proc. Disk Instablities in Close Binary Systems, eds. S. Mineshige and J.C. Wheeler, Universal Academic Press, Kyoto, p21
- (29) Terashima, et al., 2002, ApJS 139, 1
- (30) Veilleux S., Osterbrock D.E., 1987, ApJS 63, 195
- Watson et al (2001) Watson M.G., et al., 2001, A&A 365, L51
- (32) York D.G., et al., 2000, AJ 120, 1579
- (33) Yuan W., McMahon R., Komossa St., Watson M., 2002, in proc. New Visions of the X-ray Universe in the XMM-Newton and Chandra era, ed. F. Jansen, in press