The Crab Nebula’s Wisps in Radio and Optical
Abstract
We present four new, high-resolution VLA radio images of the Crab nebula, taken between 2001 February 25 and April 17. The radio images show systematic variability in the Crab’s radio emission throughout the region near the pulsar. The principal geometry of the variable features is that of elliptical ripples very similar to the optical wisps. The radio wisps are seen to move systematically outward with projected speeds of up to . Comparing the new radio images to our earlier ones from 1998 and 2000, we show there are also more slowly moving features somewhat farther away from the pulsar. In particular, there is a prominent moving feature to the northwest of the pulsar which has a projected speed of order km s-1. Striation is seen throughout the nebula, suggesting the presence of wave-like disturbances propagating through the synchrotron bubble. The radio images were taken simultaneously with HST optical observations as part of a unique observing campaign to obtain simultaneous, time-resolved, high-resolution images of the Crab in different wavebands. Comparing the radio to the optical images, we find that the radio wisps are sometimes displaced from the optical ones or have no optical counterparts. We also find that some optical wisps in particular, the brightest optical wisps near the pulsar, do not seem to have radio counterparts. In the exterior of the nebula, by contrast, there is generally a good correspondence between the radio and optical features.
Subject headings:
ISM: Individual (Crab Nebula) — Radio Continuum: ISM — supernova remnants1. Introduction
The Crab Nebula (catalog ) is the most easily accessible pulsar nebula, and thus an object of singular importance. Recent results have highlighted the remarkable nature of the region near the pulsar in the Crab Nebula. An image of this region from the Chandra X-ray observatory (Weisskopf et al. 2000) showed a complex geometry consisting of a tilted toroidal structure with a jet along the symmetry axis of the torus. A sequence of images from the Hubble Space Telescope (HST ) by Hester et al. (1996) revealed astonishing details in this region. In particular, there is a series of elliptical ripples in this region, which are usually called “wisps.” These wisps have long been known to be variable (Lampland 1921; Scargle 1969), but only recent observations have shown how dynamic they really are. They are variable on time-scales of days, and move outward rapidly, with speeds up to (Hester et al. 1996; Tanvir, Thomson, & Tsikarishvili 1997). Corresponding rapid motions are seen in the X-ray (Mori et al. 2002; Hester et al. 2002). In Bietenholz, Frail, & Hester (2001; Paper I hereafter) we showed that rapid motions in the wisp region were also apparent in the radio, and that at least one wisp was moving outward with a projected speed of over a period of months. Wisps are not unique to the Crab, since similar radio features have been seen in Vela (Bietenholz, Frail, & Hankins 1991), 3C 58 (Frail & Moffet 1993), and in B1509-58 (Gaensler et al. 2001), although none of these have yet been shown to be as dynamic as those in the Crab.
The exact nature of the wisps is not yet known, but they are generally thought to be associated with a shock in the wind from the pulsar which powers the nebula. As the Crab pulsar spins down, it is losing erg of rotational energy per second. The bulk of this energy emerges from the pulsar as a highly collimated wind of relativistic particles and magnetic field. The particles are thought to be mostly electrons and positrons, accelerated to relativistic energies, with possibly a lesser number of ions. In the remainder of this paper, we use “electrons” to refer to both electrons and positrons. This outflow from the pulsar is ultimately responsible for the synchrotron emission we observe from the body of the nebula. The process by which this prodigious transfer of energy happens, however, is not yet well understood (see e.g., Lyubarsky 2003; Lyutikov 2003; Spitkovsky & Arons, 2004; Arons 2002; Begelman 1999; Hester 1998; Chedia et al. 1997).
The energy spectrum of the particles in the nebula can be deduced from the synchrotron emission spectrum, which has a power-law form extending over many decades of frequency, implying also power-law energy spectra of the electrons. The mechanism by which this particle spectrum is generated is still not known. In particular, most of the present theories of the particle acceleration process fail to produce a substantial number of electrons with relatively low energies, i.e., with Lorentz factors, , less than , which are required to produce the nebula’s radio emission (e.g., Arons 2002; Atoyan 1999). The electrons with dominate by number, although the electrons with , which produce the nebular optical and X-ray emission dominate the energy of the population. The current radio brightness of the Crab requires a time-averaged electron injection rate over the lifetime of the nebula of s-1.
Studying the wisps is of particular importance because they are the only observational window on the neutron-star nebular interface. The wisps are now generally thought to be associated with the shock which terminates the highly collimated outflow from the pulsar and randomizes it before it enters the body of the nebula. It is also in this region that the nebular particle spectrum is established. Multi-wavelength observations may therefore provide observational constraints which can help answer the basic questions of how the power is transferred from the pulsar into the nebula and how the nebular particle spectrum is established. A synchronized multi-wavelength campaign of time-resolved observations of the Crab was undertaken using NRAO’s VLA111The NRAO Very Large Array is a facility of the National Science Foundation operated under cooperative agreement by Associated Universities, Inc., the HST and the Chandra X-ray satellite.
The radio observations are of special interest because, as mentioned, the origin of the radio emitting electrons presents a particular problem. The continuity of the emission spectrum from the radio to the optical suggests that the radio-emitting electrons are produced by the same mechanism as the higher energy ones, and the uniformity of the radio spectral index over the nebula suggests that only a single acceleration mechanism produces all or most of the radio-emitting electrons (Bietenholz et al. 1997). Understanding the acceleration process, therefore, will require understanding the origin of the majority population of radio-emitting electrons.
In this paper, we will discuss chiefly the radio results and the comparison between the radio and optical results of the multi-wavelength campaign mentioned above. A discussion of the optical and X-ray observations can be found in Hester et al. 2002 and Mori et al. 2002. We describe our observations in §2. We show a selection of representative images and describe the time-evolution of the radio synchrotron emission in §3. In §4, we compare the radio images and their time-evolution to the optical and X-ray results, and finally in §5, we discuss our findings.
2. Observations and Data Reduction
The radio observations of the Crab Nebula were carried out with the VLA in the 5 GHz band. We observed approximately every two weeks between 2001 February and 2001 April. Table 1 shows details of our four observing runs, all of which were done using the VLA in the B configuration. In all four sessions, we observed at frequencies of 4615 and 4885 MHz with a bandwidth of 25 MHz, used 0556+238 as a phase calibrator, and calibrated the amplitude scale using observations of both 3C 48 and 3C 286. The total time per observing session was 12 hours. We chose to observe at a spaced pair of frequencies within the 5 GHz band for better u-v coverage, which is critical when imaging an object as extended as the Crab.
Our goal was to obtain time-resolved observations, which would complement those in the optical with the HST and in the X-ray with the Chandra X-ray satellite. Time resolved radio observations with the VLA present the problem that the Crab Nebula exhibits structure at spatial scales from 6′ down to 1″. This range of spatial scales is not well sampled by any single VLA array configuration, and the B array configuration we used samples only spatial scales between 50″ and 14 at 5 GHz. The usual approach of recovering the large scale structure by additional observations using more compact array configurations is precluded by the fact that VLA configuration changes occur only once every four months.
We devised a strategy for obtaining reliable observations using only a single array configuration in Paper I, and we repeat a brief description here. Any rapid time evolution must occur on the smaller spatial scales, since a speed of represents a proper motion of only 3″ per month. Our solution to the problem of the large scale structure is to use maximum entropy deconvolution (AIPS task VTESS; see Cornwell & Evans 1985, Cornwell 1988) by supplying a low resolution support (default) in the deconvolution process. The deconvolved image is then biased to be as close to the support as is allowed by the data. We chose this support to be the same for all four of our epochs, and we used the same default image that was used in Paper I (made from data taken in the B,C and D array configurations in 1980-81; Bietenholz & Kronberg, 1990, 1991). We did scale the support according to the known radio expansion of 0.13% year-1 (Bietenholz et al., 1991), although the effect is small over our observing period. The use of the same default for each session serves to make any differences between our images at different epochs be only those that are demanded by the data.
We also compare the images from 2001 to our earlier images from Paper I, taken on 1998 August 10, October 13, and 2000 February 11, in order to determine whether there are any longer timescale variations. The reduction of these earlier data was essentially the same as for the present data222We note that for the 2000 February 11 epoch, we used the image from 1998 October 13 rather than our usual default image. The reason for this was that this data set had slightly different u-v coverage, and the deconvolution errors appeared to be larger. Using the 1998 October 13 image as a default reduced the spurious differences from the other images. These spurious differences are relatively easy to distinguish from the true changes, so our results are not dependent on the exact choice of the default image., and is more fully described in Paper I. We re-imaged the data using the same grid spacing as was used for the 2001 data.
Our process of deconvolving with a default image causes the structure in our radio images on the large spatial scales, i.e. those 50″, to be derived predominately from the support image, and thus from considerably earlier multi-configuration data. This larger-scale structure is thus not directly comparable to that in the optical and X-ray observations. However, as we argued above and in Paper I, there is little reason to expect rapid variations on these scales. Our chief interest in this paper is in the smaller scale structure. On spatial scales smaller than 20″ our u-v coverage is excellent, and we believe that our images reliably indicate the structure of the nebula, and in particular, changes therein from one epoch to another. To further ensure the reliability of the images we present, we work for the remainder of this paper only with spatially high-pass filtered radio images. We conservatively filtered with a Gaussian of full width at half-maximum (FWHM) 14″, which serves to isolate those spatial features for which we have good u-v coverage and thus reliable imaging. The high-pass filtering will ensure that our images at each epoch contain only structure reliably determined by the data and not derived from the support, and will reduce any spurious differences between the images due to possible deconvolution errors.
The optical observations were carried out with the HST Wide Field Planetary Camera 2 (WFPC2) using a relatively line-free filter centered near 5500 Å (F547M). They consisted of 24 visits between 2000 August and 2001 April at 11 day intervals. The radio observations occurred during the period between HST visits 19 to 24. The X-ray observations were carried out using the Chandra Advanced CCD Imaging Spectrometer (ACIS). The optical and X-ray observations are more fully described in Mori et al. 2002 and Hester et al. 2002.
3. Results
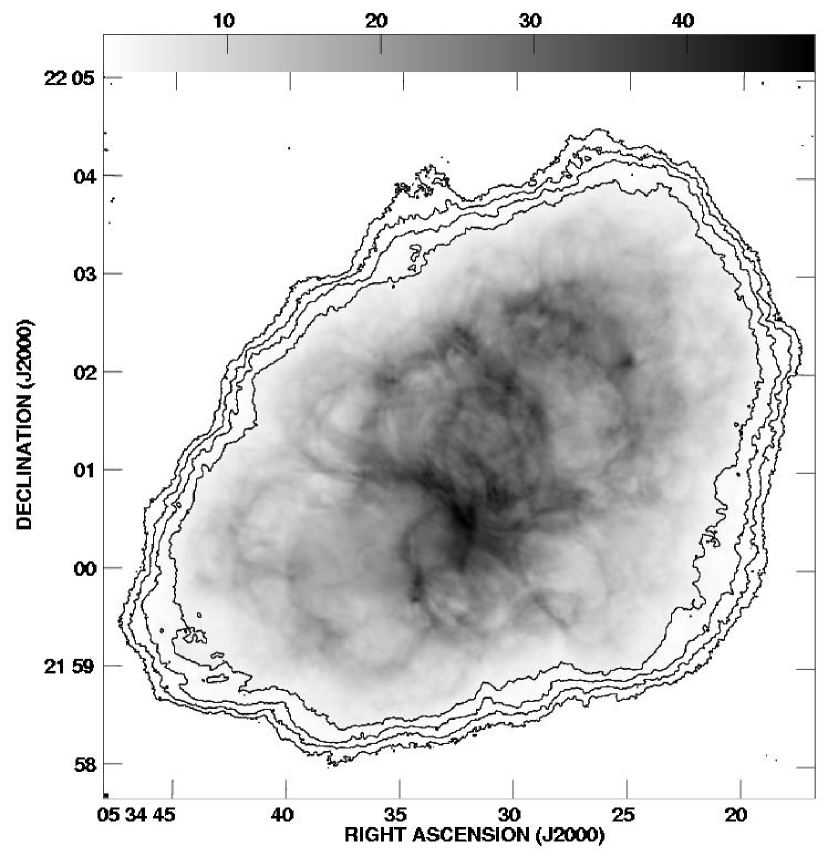
In Figure 1, we show our latest radio image of the Crab Nebula, taken on 16 April 2001. The size of the restoring beam was 14 FWHM, which was conservatively chosen as a common size for all seven epochs. The peak brightness was 49 mJy beam-1, and the rms background level was 48 Jy beam-1 before applying the primary beam correction, which causes the rms background to rise with the distance from the center of the image, to 65 Jy beam-1 near the edge of the nebula. Table 1 gives the peak brightness and rms background for all our images.
| Date (midpoint) | Length | Midpoint | Image Peak Brightness | rms backgroundaaThe listed values are before the VLA primary beam correction. Making this correction will cause the rms background level to rise farther away from the pulsar, so that the true values near the edge of the nebula are 35% higher than those listed. | ||
|---|---|---|---|---|---|---|
| (hrs) | (days since 1998 Aug 10) | (mJy beam-1) | (Jy beam-1) | |||
| 2001 | Apr | 17 | 12.1 | 981 | 4.83 | 48 |
| 2001 | Mar | 27 | 12.5 | 960 | 4.83 | 73 |
| 2001 | Mar | 13 | 12.5 | 946 | 4.81 | 93 |
| 2001 | Feb | 25 | 12.5 | 930 | 4.80 | 77 |
| …Additional epochs from Paper I | ||||||
| 2000 | Feb | 11 | 9.4 | 551 | 4.77 | 76 |
| 1998 | Oct | 13 | 10.1 | 65 | 4.81 | 82 |
| 1998 | Aug | 10 | 9.6 | 0 | 4.70 | 100 |
Our images at the other epochs in 2001 are very similar to the one shown in Figure 1, and we do not reproduce them here (an image from 2000 can be seen in Paper I). To clearly show the variation, we include an animation accompanying Figure 1, showing the variation in the central region over all seven epochs of radio observations. In order to discuss the variable features in the nebula which are the focus of this paper, we proceed to make difference images by subtracting the image at an earlier epoch from that at a later one.
3.1. Variability in the Radio Images
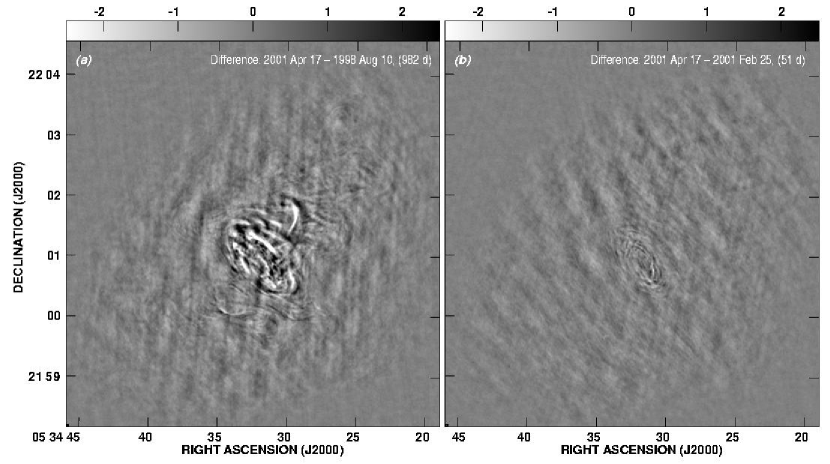
We first discuss the longer term variations in the radio images. The image in Figure 2 shows the difference between 2001 April 17 and 1998 August 10, showing the changes over an interval of 3 years (981 days)333 We expanded the 1998 image by a factor of 1.0035 to account for the overall expansion of the radio nebula of 0.13% per year (Bietenholz et al. 1991) before forming the difference image.. Figure 2 shows the difference between the 2001 April 10 and 2001 February 25 images, showing the changes over a shorter interval of 2 months (51 days). The most prominent differences over both time periods are in the central region of the nebula and consist principally of ripples with an approximately elliptical geometry. These ripples are very similar to what we reported in Paper I where we first showed the elliptical geometry of the radio variation over intervals of months and years.
With the present data we have better time-sampling over both longer and shorter time-scales, and can more reliably determine the motions over both long and short time-scales. The differences over the longer time interval of 3 years are considerably larger than those over the shorter interval of 2 months, especially near the center of the nebula. The average rms variability of the central region ( centered on the pulsar) over the 3 year interval is 0.4 mJy beam-1 while that over the 2 month period is only 0.2 mJy beam-1, representing a fractional rms variability of 1.3% and 0.7%, respectively. The observation of larger amplitude differences over longer time scales is not dependent on the particular selection of images: the differences between 2001 March 27 and 1998 October 13 are similar in amplitude to those in Figure 2, while those between 1998 October 13 and 1998 August 10 are similar to those in Figure 2. A significant component of the variability has a timescale longer than the two month observing period in 2001. In particular, this suggests significant variability on a time scale of a few years, long compared to the rapid wisp motions, but short compared to the age of the Nebula.
The geometry of the variability in the central region consists principally of a series of elliptical arcs, remarkably similar to the geometry of the elliptical wisps seen in the optical and X-ray (Hester et al. 1995, 1996, 2002; Mori et al. 2002; Weisskopf et al. 2000). In general, the difference features seem to consist of positive ridges lying farther from the pulsar than parallel negative ones, implying outward motion. The animations accompanying Figure 1 show more clearly that the motion is generally directly outward.
On the difference image over the 3 year interval (Fig. 2), there are additional striations visible over most of the body of the nebula. The geometry is still generally arc-like but no longer centered on the pulsar. The pattern of positive ridges lying farther from the pulsar than negative ones is less readily discernible in this region, but the most prominent ridges still show this pattern, again implying generally outward motion, albeit at lower velocities and amplitudes than near the pulsar.
Also on this 3 year difference image, there is a prominent feature which does not share the elliptical geometry of the wisps. It is somewhat beyond the wisp region, to the northwest (NW) of the pulsar, and is in roughly the same orientation but on the opposite side of the jet seen in the X-ray and optical. We will call this feature the “moving arc”. It extends from about 44″ to 68″, or 1.3 to 2.0 cm, from the pulsar444We adopt a distance of 2.0 kpc throughout this paper, (Trimble & Woltjer 1971). The part nearer the pulsar seems to be moving transversely, while the more distant part is moving away from the pulsar. The proper motions are difficult to estimate reliably because of the difficulty in isolating the feature in question on the images. From the difference images, we estimate projected speeds of 7500 km s-1 transversely for the end nearer to the pulsar and 14,000 km s-1 radially for the end farther from the pulsar. These speeds should be regarded as somewhat uncertain, since there are probably changes in brightness that are not associated with motion in the moving arc.
3.2. Uncertainties in the Difference Images
Are these features in the difference images real? Deconvolution errors, caused by un-sampled parts of the u-v plane are often larger than the image rms background (Briggs, Schwab, & Sramek 1999). The deconvolution errors are driven by the noise, so they may be different from one epoch to another even in the case of identical u-v coverage. They tend, however, to be confined to poorly sampled areas in the u-v plane. The result in the image plane is undulations which cover much of the deconvolved area. Compact, well-delimited features such as those observed near the center of the Crab Nebula are not likely to be due to deconvolution errors, and neither are the arc-like striations seen outside the central region. There are some undulations on a larger scale in both difference images, however, which likely are the result of deconvolution errors.
4. Comparison to the Simultaneous HST images
We now turn to a comparison of the radio images of 2001 to the (almost) simultaneous HST optical ones. For such a comparison, we must first accurately register the radio and optical images, which is most easily done using the pulsar. The pulsar is identifiable on some of the radio images, particularly that of 2001 March 27. The average radio flux density of the pulsar is mJy and is quite variable (Moffett & Hankins 1996), consistent with what is visible in our images (we note that the pulsar is clearly visible when an image of the rms variation over the radio images is formed as we do below in Figure 5). We identify the brightness peak of the pulsar in the radio images with that in the HST images. By using the pulsar we are ensured of an accurate registration, not dependent on the absolute astrometry of either the radio or the HST images. The radio astrometric scale and rotation are such that the relative positional accuracy should be a few milliarcsec. The HST astrometric scale and rotation are also well known, with estimated relative positional uncertainties over the entire image of 01 (Baggett et al. 2002). We therefore estimate that the radio-optical alignment is accurate to 01 or better.
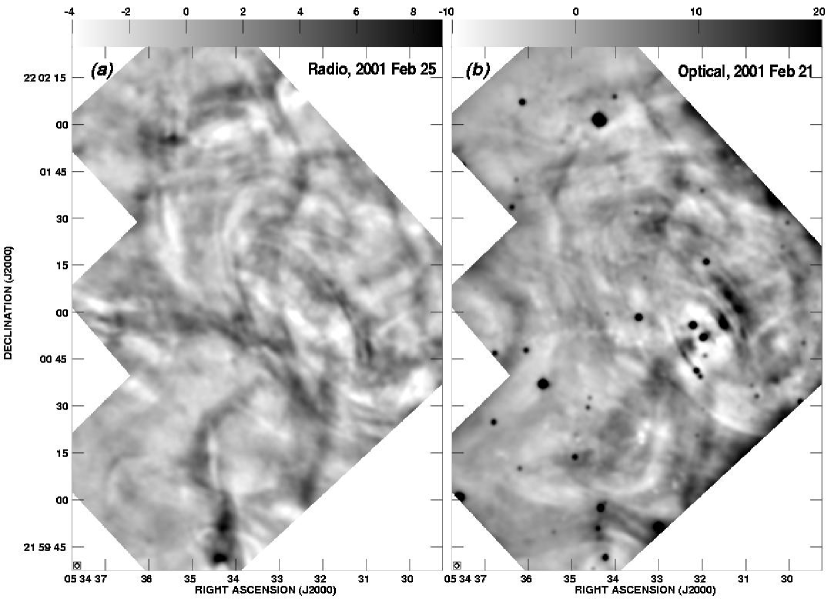
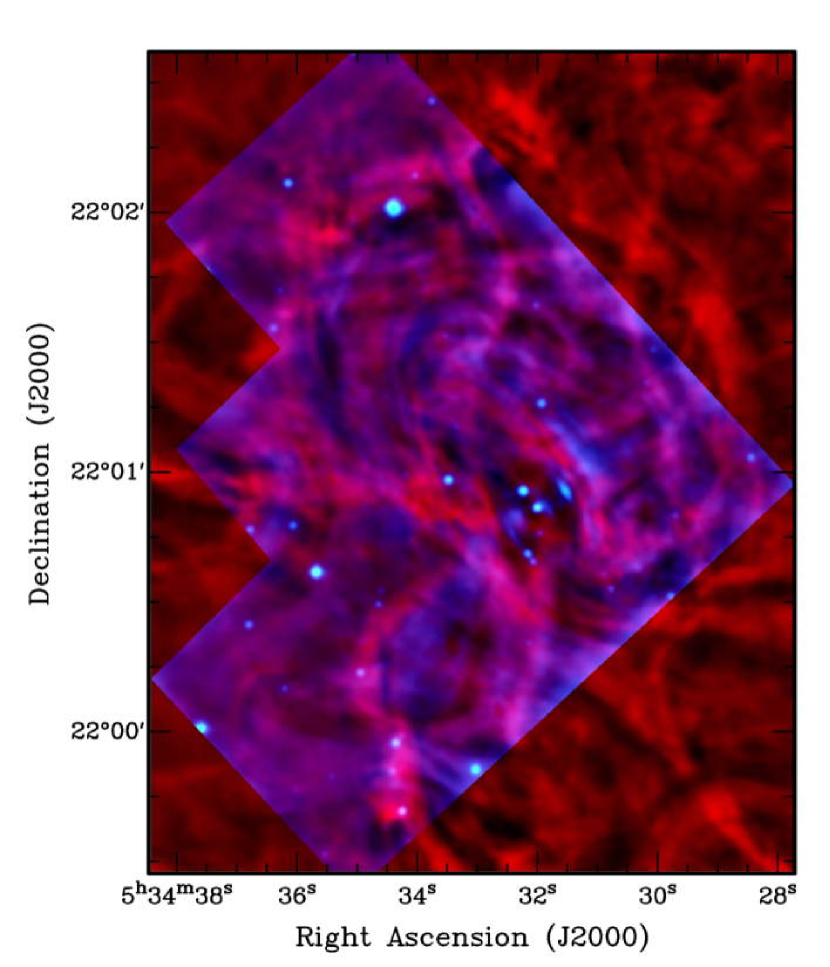
We show first an almost simultaneous pair of images of the whole region covered by the HST CCDs, which is smaller than the radio images. Figure 3 shows high-pass filtered radio image from 2001 February 25, and Figure 3 shows the optical image from 2001 February 21, convolved to the same effective resolution and similarly high-pass filtered. The animation accompanying Figure 3 shows a side-by-side comparison of the central part of the radio and optical images between 2001 February and 2001 April. We also show false color overlays of the radio image of 2001 April 16 with the optical images of 2001 April 17 in Figure 4.
In the outer part of the nebula there is generally a good correspondence between the radio and the optical, with radio counterparts existing to most optical features, with the obvious exception of the stars in the field. Most of the smaller scale structure seems to be common to the radio and the optical. The radio image contains some additional filaments, not visible in the optical, which are presumably in front of, or behind, the optically bright region, since the radio nebula is larger than the optical.
The correlation between the radio and optical brightness is not as good near the pulsar as in the outer part of the nebula. To illustrate this in a statistical fashion we determined the correlation coefficient between the optical and the radio brightness. We sampled our images every 0.9″ in both R.A. and decl. for this comparison, excluding regions near the edge of the HST CCDs and around the bright stars, and then determined the correlation coefficient between radio and optical brightness in various regions. Outside the wisp region, the correlation coefficient between the radio and optical brightness is 0.41 () while inside the wisp region it is 0.30 ().
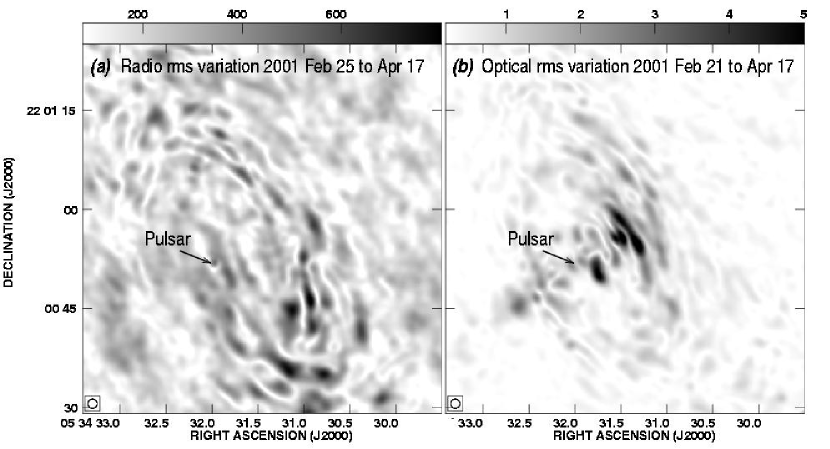
We first compare the general nature of the variability in the wisp region in the radio with that in the optical by examining the rms over our images between 2001 February and April. In Figure 5 we show images of the rms variation with time () in the radio (four images) and () in the optical (six images). The pulsar is visible in the radio rms image as a faint point source because, as mentioned, its average radio flux density is variable. The strongest radio variability occurs 20″ to the southwest (SW) of the pulsar, but radio variability is seen throughout the central region. The strongest optical variation is that of the bright wisps 10″ to the northwest (NW) of the pulsar, and the optical variability is concentrated also in the region to the NW of the pulsar although the base of the optical jet is also visible as a region of enhanced variability to the SE of the pulsar. The peak in the radio rms image represents a fractional variability of 3% in the brightness integrated along the line of sight, while that in the optical represents a fractional variability of 7%.
4.1. Radio Optical Comparisons near the Pulsar
We will search for a detailed correspondence between the radio and the optical wisps, and seek to answer the important question of whether the radio wisps are at the same locations as the optical ones, and whether they move with the same speed.
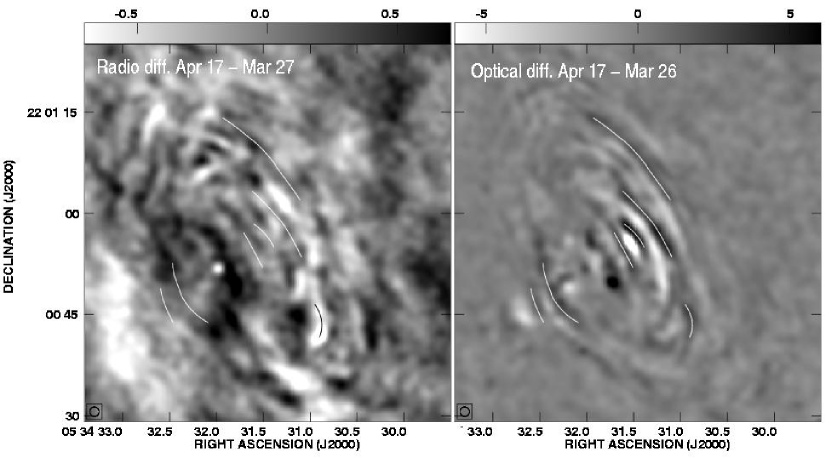
To highlight the rapidly moving wisps, we present further difference images, this time between pairs of successive images of the closely spaced observations in 2001. We form both radio and optical difference images, matching the times over which the differences are formed as closely as possible. We show pairs of radio and optical difference images in Figure 6. On such difference images, motion of a narrow feature results in a pair of parallel positive and negative ridges, with the positive one on the side toward which the motion occurs. In order to compare the precise location of radio and optical features, we mark the prominent positive optical difference ridges, i.e., locations where the optical emission has brightened, in both the radio and the optical images. We indicate the optical difference ridges in preference to the radio ones because they are generally more sharply defined.
The top panel shows the difference between the 2001 March 13 and February 25 radio images, compared with the difference between the March 15 and February 21 optical images. We mark four outwardly moving optical wisps to the NW of the pulsar and one to the S. The outermost wisp in the NW has a faint radio counterpart, at least within our resolution of 14. The next optical wisp seems distinctly displaced from a radio wisp with a similar geometry, with an optical positive ridge lying 14 outside the radio one. The remaining two optical wisps, which are the brightest ones, have no clear radio counterparts. The optical wisp to the S does seem to have a faint radio counterpart. There are also prominent radio features without obvious optical counterparts, particularly to the SW of the pulsar.
The middle panel shows the difference between the 2001 March 27 and March 13 radio images, compared with that between the March 26 and March 15 optical images. The pulsar is clearly visible as a positive point source in the radio image but not in the optical (see § 4). As in the previous set of difference images, the bright optical features nearest the pulsar do not have obvious radio counterparts. The outer, northern wisps seem to exhibit some displacement between the radio and the optical, including some anti-correlation where positive radio ridges correspond to negative optical ones. There is also a prominent radio ridge to the SSW of the pulsar which does not have an optical counterpart.
Finally, the bottom panel shows the difference between the 2001 April 17 and March 27 radio images, compared with that between the April 17 and March 26 optical images. The pulsar has become fainter in the radio, and is visible as a negative source in the radio image. The marked wisp to the SW of the pulsar shows a clear anti-correlation, being negative in the radio and positive in the optical, that is having become fainter between April 17 and March 27 in the radio, but having become brighter over almost the same interval in the optical. As in the previous set of difference images, the bright optical features near the pulsar do not have obvious radio counterparts, and there are also radio features without optical counterparts.
4.2. Is there a Radio Counter-Part to the Optical Jet
A jet is visible in both the optical and the X-ray images, and movement along it can be seen at speeds of at (Hester et al. 2002; Mori et al. 2002). The geometry of the jet in the optical is similar to that in the X-ray: the base of the jet is bright, it extends approximately 1′ to the SE of the pulsar, becoming wider and curving slightly to the S toward its end. The base of the jet is visible as a region of variability 10″ to the SE of the pulsar in the optical rms image (Figure 5). There does not seem to be an obvious radio counterpart to the bright base of the jet, either in the radio rms image (Figure 5) or in the images of individual epochs (e.g., Fig. 3). A highly variable feature called the “sprite” is seen at the base of the jet in the optical (Hester et al. 1998). Although there is a weak, diffuse radio feature roughly at the location of the sprite, the positional alignment is not exact and the radio feature is not especially variable, so it cannot reliably be identified with the sprite.
5. Discussion
We have produced time-resolved high-resolution radio images of the Crab Nebula which are almost simultaneous with similar optical and X-ray images. We confirm the existence of the rapidly moving radio wisps in the central 2′ of Crab Nebula, first detected as spectral index variations by Bietenholz & Kronberg (1992), and subsequently identified as mobile features in Paper I. We show that the rapid motions of the radio wisps are definitely directed outward, with projected speeds of . In addition to the wisp motion, there is complex radio variability over longer time scales of 3 year, including features farther from the pulsar which move much more slowly than the wisps, but still more rapidly than the nebular expansion. We compared the morphology and motions visible in the radio to those visible in the optical synchrotron emission. We now discuss the relevance of these motions in different regions of the nebula in more detail.
5.1. The Wisps and Particle Acceleration in the Crab Nebula
What insight can the observed behavior of the radio and optical wisps give into the establishment of the nebular particle spectrum and in particular the question of the origin of the radio-emitting electrons? We proposed in Paper I that the rapidly variable radio wisps are associated with the optical wisps and the X-ray torus. The fact that the radio and optical wisps show a similar overall geometry of elliptical arcs, and the fact that both are seen to move away from the pulsar with speeds which are substantial fractions of suggests that the radio wisps are intimately associated with the optical ones. The elliptical geometry suggests that the wisps are intrinsically circular features in or near the equatorial plane of the pulsar. The fractional time variability in the radio brightness is of the same order of magnitude as that of the optical brightness, suggesting that the radio-optical spectrum of the time-variable component, i.e., the wisps, is roughly comparable to that of the bulk of the nebula555The fractional variability in the radio brightness is approximately half of that in the optical. However, the radio brightness along lines of sight through the center of the nebula contains considerable emission from regions in front of and behind the optically bright region, since the radio synchrotron nebula is larger than the optical one. Since these optically faint regions far from the pulsar are not likely to be highly variable, it seems probable that the fractional time-variability in the radio would be similar to that in the optical, i.e., on the order of 1%, if one considers similar emitting volumes.. This further implies that the particle spectrum in the wisps is also similar to that in the bulk of the nebula, at least over the range of energies of the particles responsible for the radio and the optical synchrotron emission.
While this evidence of association between the radio and the optical wisps is circumstantial, we feel that it is compelling. The simultaneous observations, however, show that the correspondence between radio and optical wisps is not exact. While some wisps are bright in both radio and optical, others are bright in the radio and faint in the optical or vice versa. This lack of detailed correspondence argues for two different but related processes producing the radio and the optical wisps. By contrast, the correspondence between the optical and the X-ray wisps is good (Hester et al. 2002), suggesting that the X-ray wisps are produced by the same process as produces the optical ones.
A long-standing problem, mentioned in the introduction, is the provenance of the radio emitting electrons, i.e., those with Lorentz factors of . In most theoretical pictures of the Crab, the bulk Lorentz factor of the pulsar wind, , is expected to be (e.g., Wilson & Rees 1978; Kennel & Coroniti 1984a, b; Melatos & Melrose 1996; Arons 2002). The wisps are associated with a shock in the equatorial region of the pulsar wind. It is in, or immediately downstream from, this shock that the nebular particle spectrum is established. The problem posed by the radio-emitting electrons is that it is difficult to produce a substantial number of electrons with much lower than in such a shock. Thus, if is in fact , then the numerically dominant radio-emitting electrons with are difficult to account for. Furthermore, if , then the total number of relativistic electrons currently injected is far too small to account for the number of radio-emitting electrons currently observed in the nebula, even allowing for the fact that the synchrotron lifetimes of the lower-energy electrons exceed the age of the nebula.
One possible explanation for the existence of the radio-emitting electrons is that they are of historical origin (e.g., Atoyan 1999). Since the synchrotron lifetimes of the electrons are longer than the age of the nebula, they could have been injected at some point in the past. A second possibility is that there may be a second outflow process which is responsible for producing the low energy electrons — perhaps the bulk of the energy emerges in an equatorial wind with , but there is an additional, slower, outflow, perhaps at higher latitudes, which is the source of the radio-emitting electrons. In neither of these cases, however, would radio emission currently be expected from the wisp region. Since we do observe radio emission from the wisp region, neither of these two scenarios seem likely to apply.666We note that a population of electrons with a low-energy cutoff such that will produce synchrotron emission with a low frequency tail whose brightness is . However, the radio emission from the wisps is far too bright to be merely the low frequency tail for any reasonable value of , for example .
The association of the radio and the optical wisps suggests rather that there are two closely related processes which produce the radio and the optical wisps, and also the low- and the high-energy relativistic electrons. Two candidates for a two-part process of particle acceleration have been put forward. In both cases, the high-energy particles are produced by Fermi acceleration, which seems capable of producing the required particle spectrum. Gallant et al. (2002) hypothesized that the pulsar wind contains ions in addition to electrons, and that the resonant absorption of ion cyclotron waves accelerates lower energy electrons, as was first suggested by Hoshino et al. (1992). Recently, Lyubarsky (2003; see also Lyubarsky & Kirk 2001), showed that the low energy part of the particle population can be produced by rapid, forced, reconnection of the alternating magnetic field stripes in the termination shock of the pulsar wind. In this case, the pulsar wind before the termination shock is Poynting dominated, but a significant fraction of the energy is transferred to the particles immediately after the shock because of reconnection, with the result that the average particle energy grows as the particles pass through the shock. This would imply a bulk Lorentz factor in the wind of only for an injection rate of s-1. Some separation between the radio and optically bright wisps could be accommodated in either of these scenarios, but neither makes particular predictions as to the relative locations of the radio and optical wisps.
The physical nature of the wisps is also a matter of some debate (e.g., Hester et al 1995; Chedia et al. 1997; Arons 1998; Lou 1998; Begelman 1999; Komissarov & Lyubarsky 2003; Spitkovsky & Arons 2004). Unfortunately none of the models to our knowledge directly address the issue of the lower-energy electrons, or make direct predictions concerning radio wisps, largely because of the aforementioned problem of the origin of the lower-energy electrons. We do not discuss the various theories for the origin of the wisps in detail, but list some observational constraints provided by the observed differences between the radio and optical wisps. The optical wisps to the NW of the pulsar are considerably brighter and move more rapidly than those to the SE, which is plausibly explained by Doppler beaming of material moving out from the pulsar with at least transrelativistic velocities, with the bright parts of the wisps to the NW being those where the motion is toward us. In the case of the radio wisps, by contrast, those to the NW of the pulsar are not notably brighter than those to the SE. The observed projected velocities for the radio wisps are also somewhat lower than those of the optical wisps. This suggests that the bulk flow in the radio wisps is slower. The somewhat more amorphous nature of the radio wisps may further suggest that they are somewhat more widely distributed above and below the pulsar’s equatorial plane than the optical ones. In particular, the brightest optical wisps near the pulsar do not seem to have radio counterparts. Perhaps, the establishment of the low energy particle population is slower than that of the higher energy one, and thus the number of radio emitting electrons is still low in the wisps closest to the pulsar.
5.2. The Moving Arc
The feature we have termed the moving arc, described in § 3.1 above, is prominent in the 3 year difference image (Figure 2). It had already been seen in the radio, showing distinct changes in brightness between two sets of 1.4 GHz observations in 1982 and 1987 (Bietenholz & Kronberg 1992). We note that the speed of its outward motion we estimated is higher than that estimated by Bietenholz & Kronberg, which would imply substantial acceleration of the moving arc. However, we measured the speed of the moving arc from the part with the largest changes in brightness, while Bietenholz & Kronberg measured the speed of the edge toward the pulsar, so a direct comparison of the speeds is probably not warranted. The moving arc is also apparent in the optical: it is clear in an optical difference image, between observations in 1988 and 1994 (Hester et al. 1995), with a very similar morphology as is seen in the radio. It probably also corresponds to the “dark lane” described by Oort & Walraven (1956) and Scargle (1969), and possibly already observed by Lampland (1921). Its present location and speed is approximately consistent with that determined by Scargle (1969), suggesting a secularly evolving feature moving outward through the nebula at a projected speed of order km s-1, about ten times that of the nebular expansion.
The moving arc is approximately opposite the pulsar from the jet seen in the optical and X-ray. Might it be associated with a counter-jet? Although a counter-jet is not clearly seen at any wavelength, there is emission identified as the counter-jet channel in both the optical and the X-ray (Hester et al. 2002). The uniqueness and prominence of the moving arc suggest a possible association with the distant end of the counter-jet. The alignment of the moving arc with the counter-jet is not exact, but since the jet is seen to be curved, it seems likely that the counter-jet is curved also.
A serious problem with the association of the moving-arc with the counterjet is the absence of an at least similarly prominent radio feature associated with the jet. There is in fact a less prominent feature visible approximately opposite the moving arc in Figure 2, however its association with the jet is entirely speculative at this point. Possibly the prominence of the moving arc in the NW over any feature in the SE is due to the more rapid present motion of the counter-jet, since the moving arc is prominent only in difference images. However, any association between radio features and the optical and X-ray jet and its implied counter-jet must remain speculative until future observations show a clear connection.
5.3. Other Motions in the Outer Nebula
On the 3 year difference image in Figure 2, striations are visible in most of the nebula, which suggest wave-like motions. They are not clearly discernible enough to determine the speeds, but proper motions in the range of ″ year-1 are suggested, implying projected speeds of km s-1. Similar motions are reported in the optical in a 6 year difference image (Hester 1995). The morphology suggests traveling waves, perhaps reflecting off the boundary of the nebula and diffracting from the massive filaments of thermal gas. Since the wisps and the jet, where the synchrotron fluid is injected into the nebula, are seen to be unsteady on short time-scales, it seems reasonable to suppose that wave-like disturbances, excited by the wisp and jet instabilities, would propagate away from the injection region in the synchrotron-emitting plasma, where the sound and Alfvén speeds are relatively high.
6. Summary
By studying time-resolved radio observations of the Crab Nebula, and comparing them to simultaneous and similarly time-resolved optical and X-ray images we have found the following:
-
1. We confirm the existence of radio-emitting counterparts to the optical wisps. We show that the radio wisps, like the optical ones, have arc-like geometries and are moving outward at speeds of up to .
-
2. The fractional variability of the brightness at the wisp locations in the radio is similar to that in the optical, implying that the particle spectrum in the wisps is similar to that in the body of the nebula. This suggests that the radio-emitting electrons with are accelerated in the wisp region along with those with higher energies.
-
3. The correspondence between the radio and the optical wisps is not exact. In several cases the radio brightness seems to be anti-correlated with that in the optical. In particular, the brightest optical wisps nearest the pulsar do not seem to have bright radio counterparts.
4. The jet seen in the optical and X-ray does not have an obvious radio counterpart.
5. The lack of detailed radio-optical correspondence suggests two different but related processes for producing the radio and the optical wisps, and the populations of relativistic electrons with below and above .
6. There is a prominent, curved, moving radio feature in the NW of the pulsar that we call the moving arc. It’s projected speed is on the order km s-1, at least an order of magnitude higher than those entailed by the general expansion of the nebula. This is a long-lived feature: it was detected almost 20 years ago in the radio, and at least 30 years ago in the optical.
7. There is considerable variation of the radio emission with time-scales of 1 year, which is longer than those associated with the wisps. On these time-scales, the fractional variability of the radio brightness near the pulsar is 1%.
8. Striation is seen in the radio difference images spanning 3 year, suggesting the presence of wave-like motions in the body of the nebula, albeit with lower amplitudes than the wisps and the moving arc. The geometry is generally arc-like but not centered on the pulsar like that of the wisps.
References
- (1)
- (2) Arons, J. 1998, in The Relationship Between Neutron Stars and Supernova Remnants, eds. R. Bandiera et al., (Memorie della Società Astronomica Italiana, vol. 69, no. 4), 989
- (3) Arons, J. 2002, in Neutron Stars and Supernova Remnants, eds. P. O. Slane and B. M. Gaensler, (ASP Conference Series 271; San Francisco:ASP), 71
- (4) Atoyan, A. M. 1999, A&A, 346, L49
- (5) Baggett, S., et al. 2002, in HST WFPC2 Data Handbook, v4.0, ed. B Mobasher, (Baltimore: STScI)
- (6)
- (7) Begelman, M. C. 1999, ApJ, 512, 755
- (8) Bietenholz, M. F., Frail, D. A., & Hankins, T. H. 1991, ApJ, 376, L41
- (9) Bietenholz, M. F., Frail, D. A., & Hester, J. J. 2001, ApJ, 560, 254 (Paper I)
- (10) Bietenholz, M. F., Kassim, N., Frail, D. A., Perley, R. A., Erickson, W. C., Hajian, A. R. 1997, ApJ, 490, 291
- (11) Bietenholz, M. F., & Kronberg, P. P. 1990, ApJ, 357, L13
- (12) Bietenholz, M. F., & Kronberg, P. P. 1991, ApJ, 368, 231
- (13) Bietenholz, M. F., & Kronberg, P. P. 1992, ApJ, 393, 206
- (14) Bietenholz, M. F., Kronberg, P. P., Hogg, D. E., & Wilson, A. S. 1991, ApJ, 373, L59
- (15) Briggs, D. S., Schwab, F. R., & Sramek, R. A. 1999, in Synthesis Imaging in Radio Astronomy II, ASP Conference Series, vol. 180, ed. G. B. Taylor, C. L. Carilli, & R. A. Perley (San Francisco: ASP), 127
- (16) Chedia, O., Lominadze, J., Machabeli, G., McHedlishvili, G., & Shapakidze, D. 1997, ApJ, 479, 313
- (17) Cornwell, T. J. 1988, A&A, 202, 316
- (18) Cornwell, T. J., & Evans, K. F., 1985, A&A, 143, 77
- (19) Frail, D. A., & Moffett, D. A. 1993, ApJ, 408, 637
- (20) Gaensler, B. M., Arons, J., Kaspi, V. M., Pivovaroff, M. J., Kawai, N., & Tamura, K. 2001, ApJ, 569, 878.
- (21) Gallant, Y. A., van der Swaluw, E., Kirk, J. G., & Achterberg, A. 2002, in Neutron Stars in Supernova Remnants, eds. P. O. Slane and B. M. Gaensler, (ASP Conference Series 271; San Francisco: ASP), 99
- (22) Hester, J. J. 1998, in The Relationship Between Neutron Stars and Supernova Remnants, eds. R. Bandiera et al., (Memorie della Società Astronomica Italiana, vol. 69, no. 4), 883
- (23) Hester, J. J., et al. 1995, ApJ, 448, 240
- (24) Hester, J. J., Mori, K., Burrows, D., Gallagher, J. S., Graham, J. R., Halverson, M., Kader, A., Michel, F. C., & Scowen, P. 2002, ApJ, 577, L49
- (25) Hester, J. J., Scowen, P. A., Sankrit, R., Michel, F. C., Graham, J. R., Watson, A., & Gallagher, J. S. 1996, BAAS, 188, 7502 (see also http://www.stsci.edu/pubinfo/PR/96/22.html)
- (26) Hoshino, M., Arons, J., Gallant, Y. A., & Langdon, A. B., 1992, ApJ, 390, 454
- (27) Kennel C. F., & Coroniti, F. V. 1984a, ApJ, 283, 694
- (28) Kennel C. F., & Coroniti, F. V. 1984b, ApJ, 283, 710
- (29) Komissarov, S. S. & Lyubarsky, Y. E. 2003, MNRAS, 344, L93
- (30) Lampland, C. O. 1921, PASP, 33, 79
- (31) Lou, Y-Q. 1998, MNRAS, 344, L93
- (32) Lyubarsky, Y. E. 2003, MNRAS, 345, 153
- (33) Lyubarsky, Y. E., & Kirk, J. G. 2001, ApJ, 547, 437
- (34) Lyutikov, M. 2003, MNRAS, 339, 623
- (35) Melatos, A., & Melrose, D. B. 1996, MNRAS, 279, 1168
- (36) Moffett, D. A., & Hankins, T. H. 1996, ApJ, 468, 779
- (37) Mori, K., Hester, J. J., Burrows, D. N., Pavlov, G. G., & Tsunemi, H. 2002, in Neutron Stars in Supernova Remnants, eds. P. O. Slane and B. M. Gaensler, (ASP Conference Series 271; San Francisco: PASP), 157
- (38) Oort, J. H., & Walraven, Th. 1956, Bull. Astron. Inst. Netherlands, 12, 285.
- (39) Scargle, J. D. 1969, ApJ, 156, 401
- (40) Spitkovsky, A. & Arons, J. 2004, ApJ, 603, 669
- (41) Tanvir, N. R., Thomson, R. C., & Tsikarishvili, E. G. 1997, New Astronomy, 1, 311
- (42) Trimble, V. & Woltjer, L. 1971, ApJ, 163, 97
- (43) Weisskopf, M. C., et al. 2000, ApJ, 536, L81
- (44) Wilson, D. B., & Rees, M. J. 1978, MNRAS, 185, 297
![[Uncaptioned image]](/html/astro-ph/0408061/assets/x6.png)
![[Uncaptioned image]](/html/astro-ph/0408061/assets/x7.png)